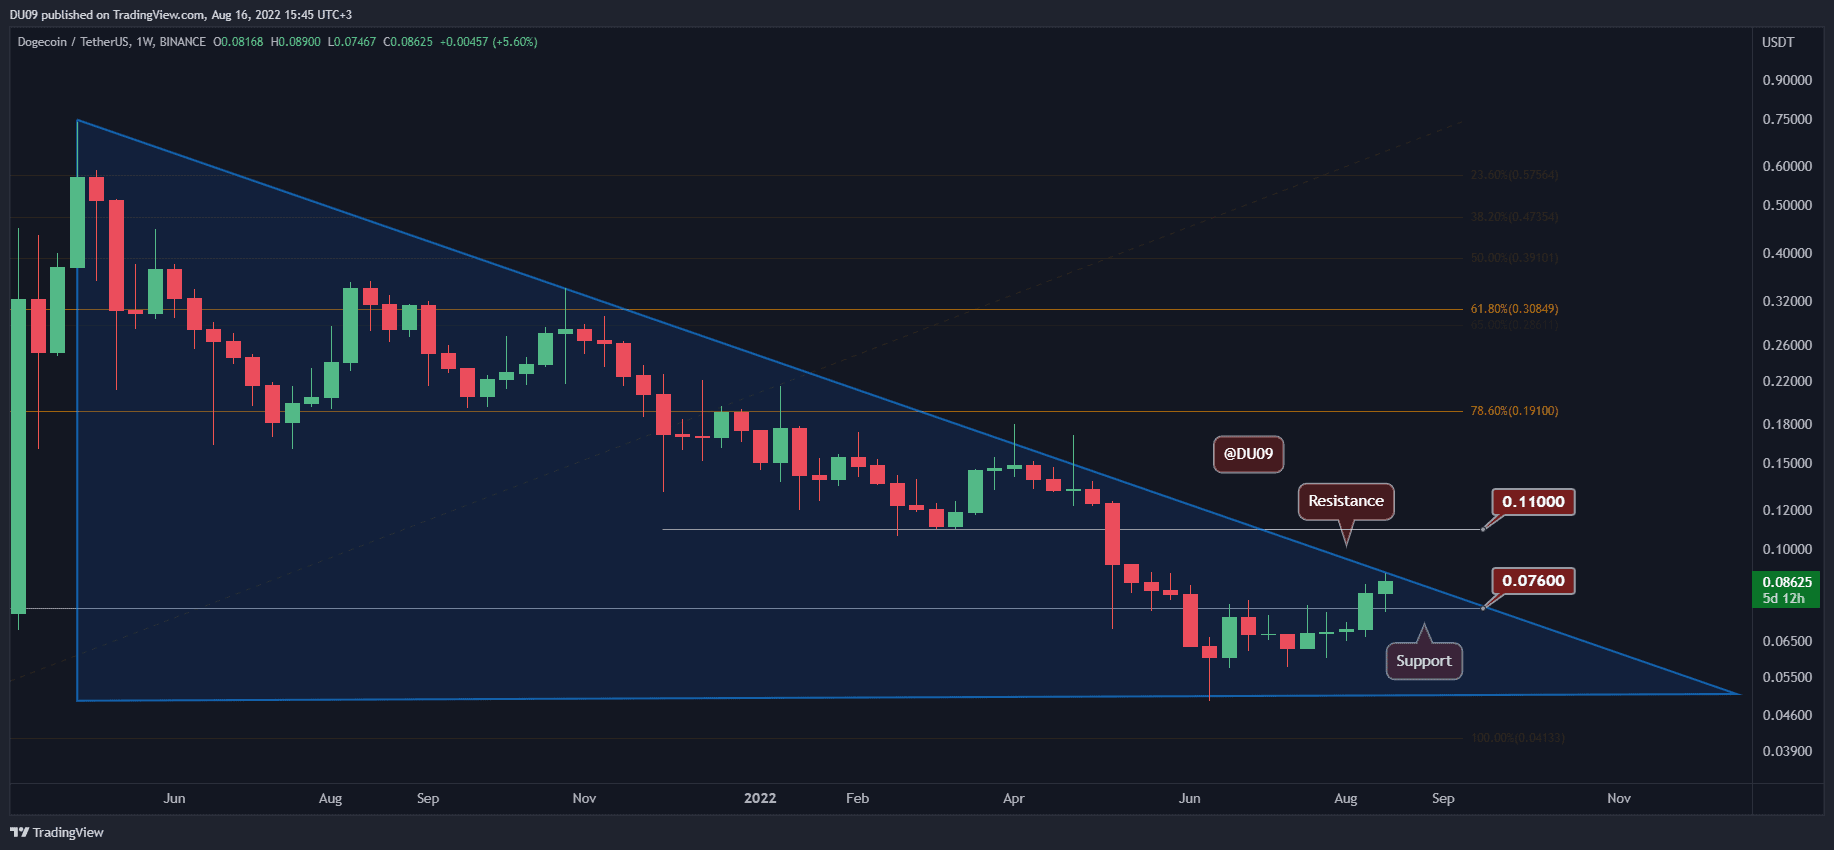
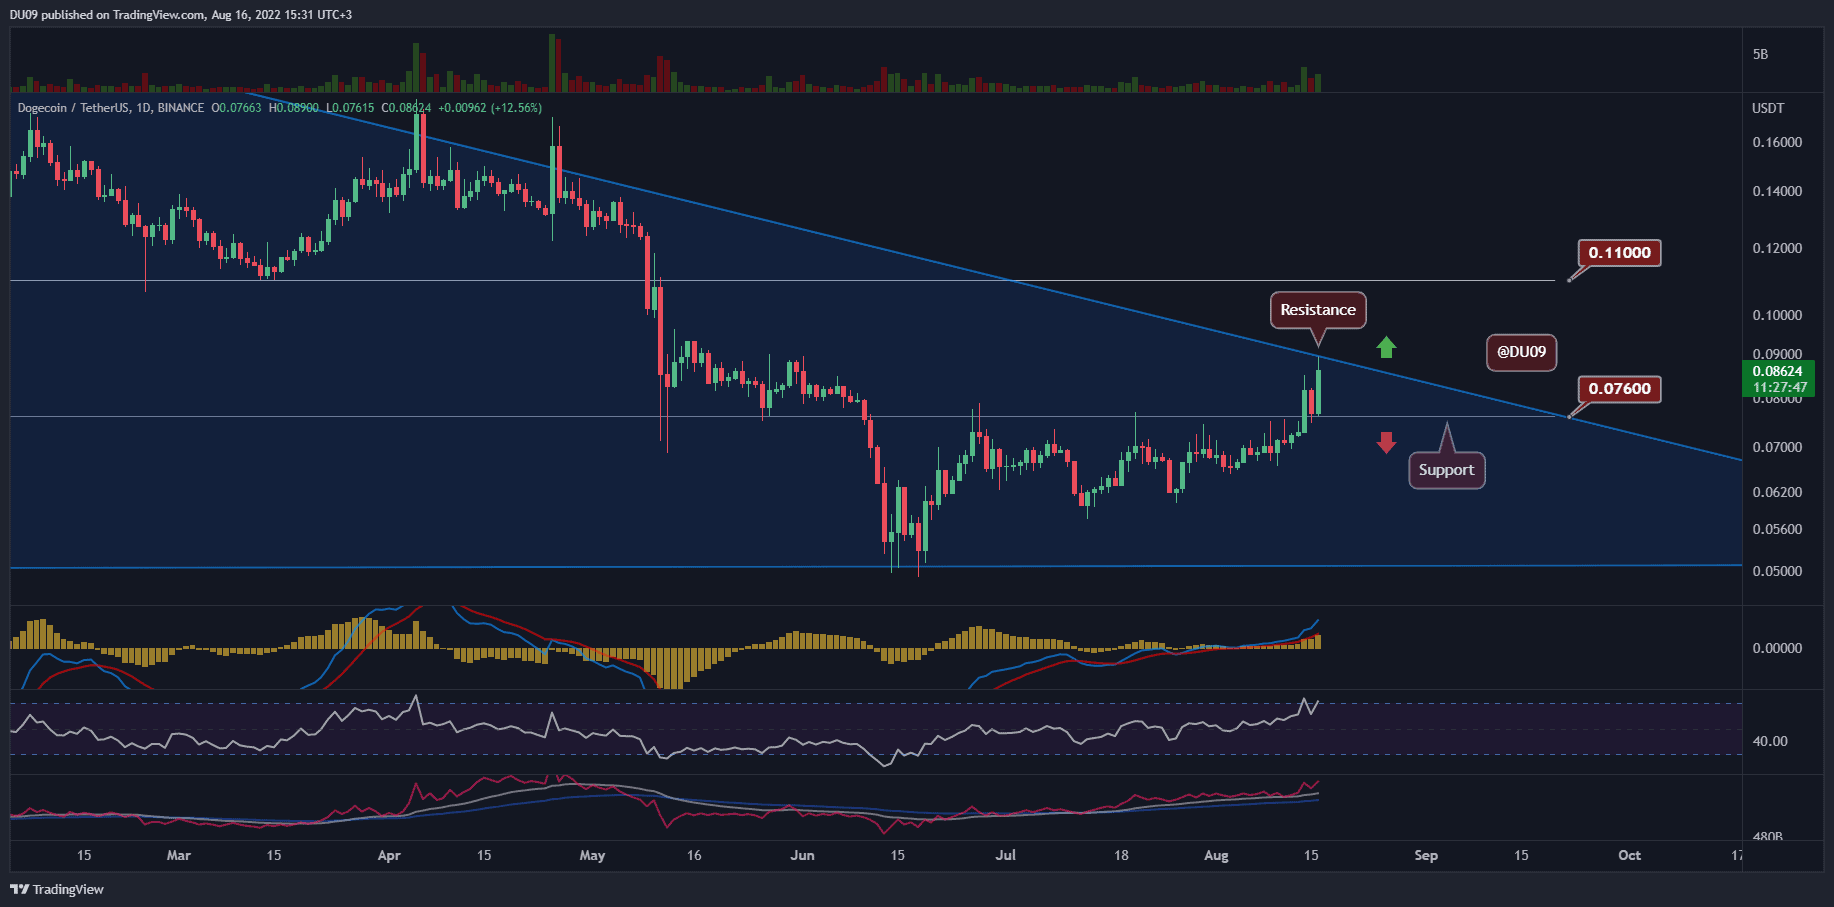
DOGE did not disappoint in August with a 40% rally since the start of the month. The buyers managed to bring the price just under a key resistance which may put some breaks on this rally. Key Support levels: %excerpt%.076 Key Resistance levels: %excerpt%.09, %excerpt%.11 DOGE’s price exploded by 17% today and has hit the key resistance at %excerpt%.09. This is the upper limit of a large descending triangle that has been forming since the all-time high in May 2021. If the bulls manage to break above this triangle, then the next target will be found at %excerpt%.11. The support is at %excerpt%.076. Chart by TradingViewTechnical Indicators Trading Volume: Strong buy volume has taken DOGE much higher today. The big question is if buyers will be able to sustain this momentum. RSI: The daily RSI is in the overbought
Topics:
Duo Nine considers the following as important: DOGEBTC, dogecoin, DOGEUSD, Price Analysis
This could be interesting, too:
Bitcoin Schweiz News writes Früh in Meme Coins einsteigen?
Bitcoin Schweiz News writes Glücksgriff: Sammler zieht Bitcoin-Karte im Wert von über 100’000 Dollar
Bitcoin Schweiz News writes 🔥 Darum ist Meme Coin Trading auf Binance so aufregend – Gewinne, Hype und verrückte Moves!
Bitcoin Schweiz News writes Ein Meme-Coin mit Milliardenbewertung ist kein Zufall – es geht um die Community!
DOGE did not disappoint in August with a 40% rally since the start of the month. The buyers managed to bring the price just under a key resistance which may put some breaks on this rally.
Key Support levels: $0.076
Key Resistance levels: $0.09, $0.11
DOGE’s price exploded by 17% today and has hit the key resistance at $0.09. This is the upper limit of a large descending triangle that has been forming since the all-time high in May 2021. If the bulls manage to break above this triangle, then the next target will be found at $0.11. The support is at $0.076.
Technical Indicators
Trading Volume: Strong buy volume has taken DOGE much higher today. The big question is if buyers will be able to sustain this momentum.
RSI: The daily RSI is in the overbought area at over 70 points. This shows that buyers are eager to get exposure to DOGE, but they may also be caught off guard if bears are able to defend the key resistance.
MACD: The daily MACD is bullish with an expanding histogram and moving average. The current price action shows some euphoria, and this is reflected in the indicators as well.
Bias
The bias for DOGE is bullish, but watch the key resistance.
Short-Term Prediction for DOGE Price
If buyers are able to break the key resistance at $0.09, then DOGE will be more likely to enter a sustained recovery and quickly move towards $0.11. However, the price action for Bitcoin and Ethereum is bearish in the short term, and this may put a stop to DOGE’s rally at this time.