Key Support levels: .4 Key Resistance levels: .8, In the last two days, MATIC registered a 20% price increase after finding support at the .4 level. The key resistance at .8 prevented the price from moving higher, and today, MATIC is quickly re-approaching this level. If it is successful to maintain the momentum, then a successful break may take it to . Chart by TradingViewTechnical Indicators Trading Volume: Despite this most recent increase in price, the volume on green days has been much lower compared to the selloff from last week. RSI: The daily RSI is quickly moving higher after it dropped in the oversold area last week. It also formed a bullish divergence which now appears to be confirmed as the price moves higher. MACD: The daily MACD remains bearish,
Topics:
Duo Nine considers the following as important: MATICBTC, MATICUSD, Polygon (MATIC) Price, Price Analysis
This could be interesting, too:
CryptoVizArt writes ETH’s Path to K Involves Maintaining This Critical Support (Ethereum Price Analysis)
Duo Nine writes Crypto Price Analysis June-29: ETH, XRP, ADA, DOGE, and DOT
Duo Nine writes Crypto Price Analysis June-15: ETH, XRP, ADA, DOGE, and DOT
Duo Nine writes Why is the Shiba Inu (SHIB) Price Down Today?
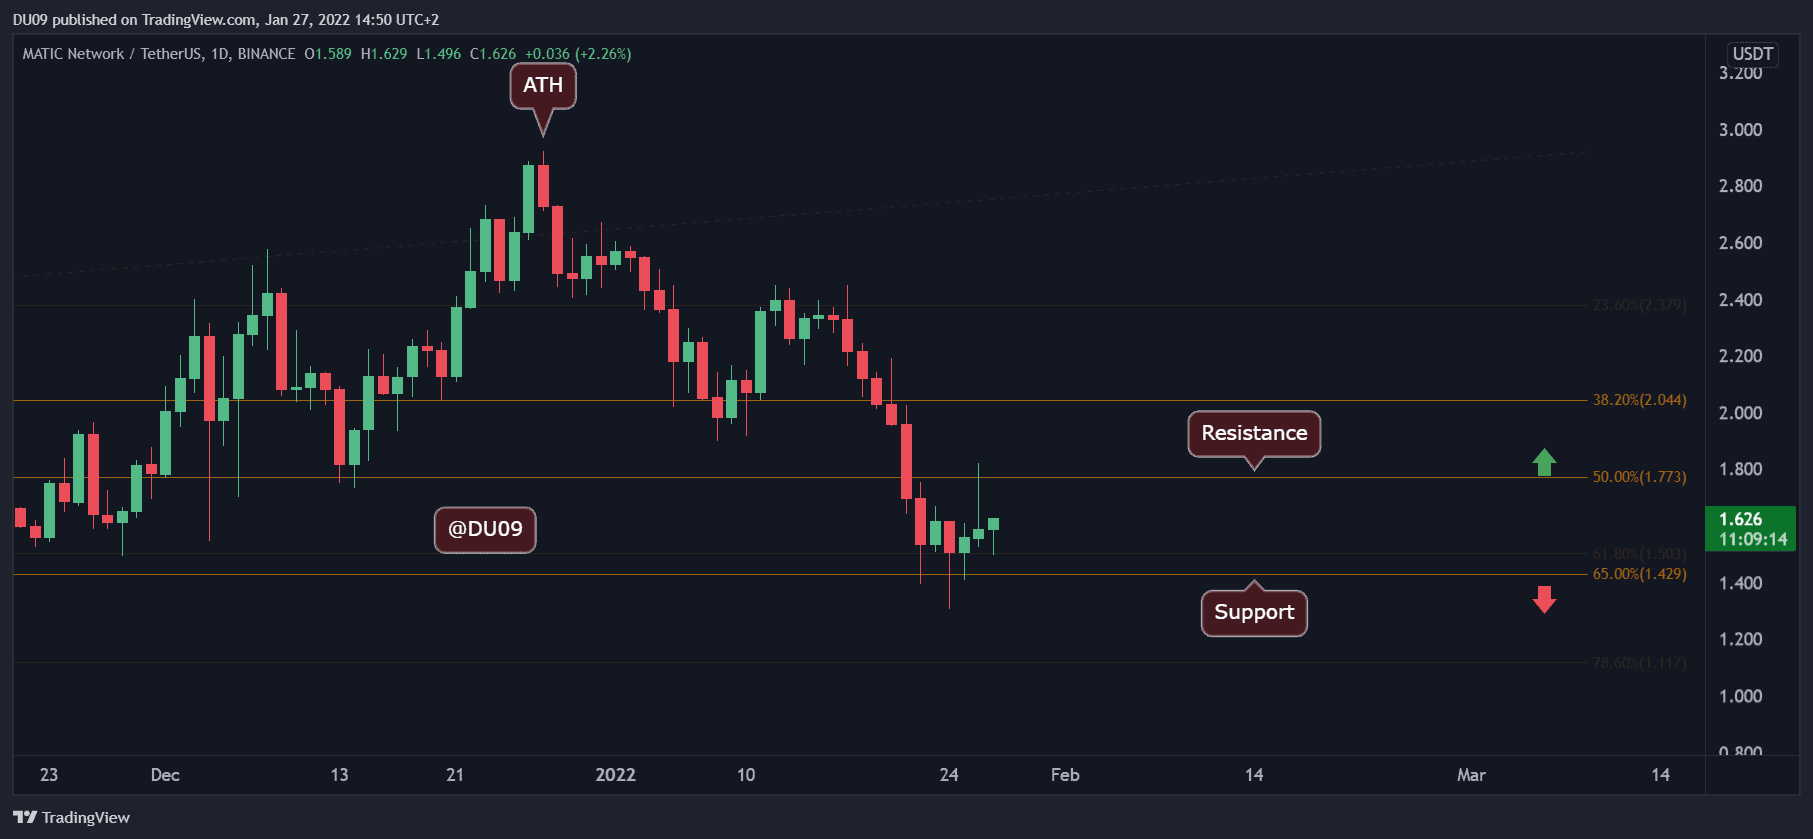
Key Support levels: $1.4
Key Resistance levels: $1.8, $2
In the last two days, MATIC registered a 20% price increase after finding support at the $1.4 level. The key resistance at $1.8 prevented the price from moving higher, and today, MATIC is quickly re-approaching this level. If it is successful to maintain the momentum, then a successful break may take it to $2.
Technical Indicators
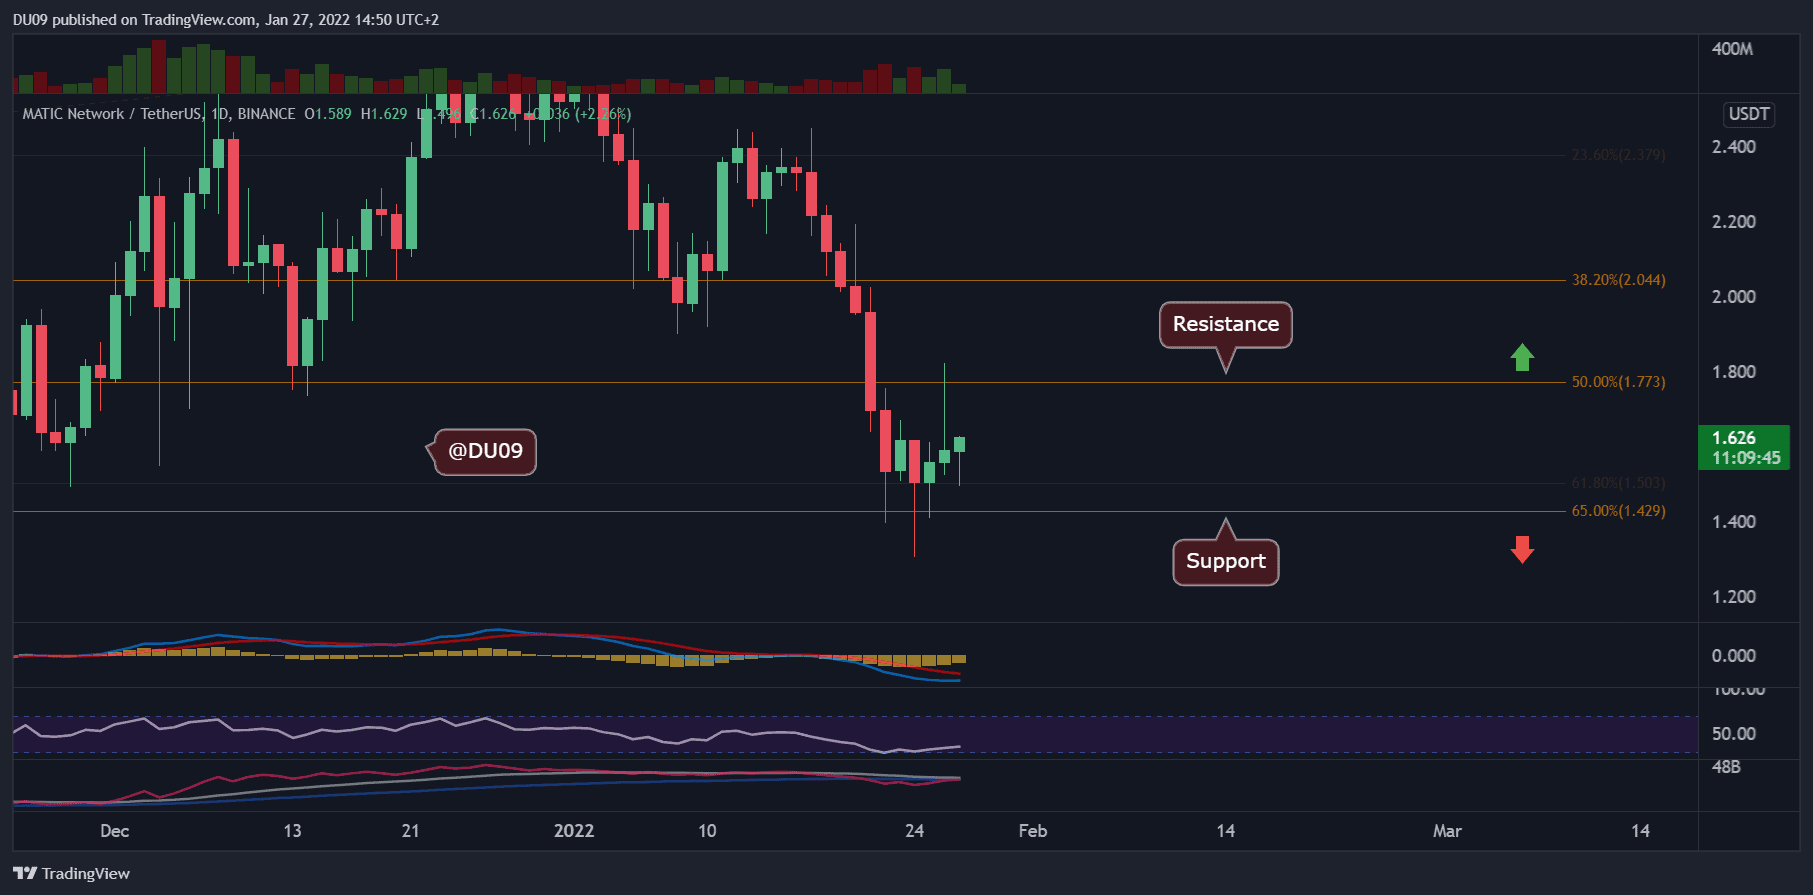
Trading Volume: Despite this most recent increase in price, the volume on green days has been much lower compared to the selloff from last week.
RSI: The daily RSI is quickly moving higher after it dropped in the oversold area last week. It also formed a bullish divergence which now appears to be confirmed as the price moves higher.
MACD: The daily MACD remains bearish, but the moving averages and histogram are both curving up fast. Bulls need to show resilience and move through the resistance levels, otherwise, it is unlikely for MACD to do a bullish crossover.
Bias
The bias for MATIC is presently neutral.
Short-Term Price Prediction for MATIC
MATIC testing the $1.8 level again seems like an option with a relatively high probability. Once there, the strength of this bullish momentum will be put to the test. Any failure is likely to quickly translate into a pullback towards the key support.