Key Support level: %excerpt%.000029, %excerpt%.000023 Key Resistance level: %excerpt%.000034 There is one good thing about this latest crash in price: SHIB managed to avoid a lower low in price (compared to December 20th). For this reason, if SHIB holds at the current support of %excerpt%.000029, then maybe it has a chance to consolidate around the current level. The resistance is found at %excerpt%.000034. Chart by TradingViewTechnical Indicators Trading Volume: Despite an increase in volume during the crash yesterday, the overall volume for SHIB remains low if we compare it to the rally period from late 2021. This shows a lack of interest in SHIB, particularly during bearish price action. RSI: The daily RSI did a lower low, even as the price managed to narrowly avoid it. This is bad news for buyers, and
Topics:
Duo Nine considers the following as important: Price Analysis, Shiba Inu (SHIB), SHIBBTC, SHIBUSD
This could be interesting, too:
Jordan Lyanchev writes Shiba Inu Price Forecasts: Another 50% Crash or 420% Rally Ahead for SHIB?
Dimitar Dzhondzhorov writes This Trader Made Over Million by Selling Shiba Inu (SHIB) Holdings: Details
Dimitar Dzhondzhorov writes Shiba Inu (SHIB) Drops by 15% in 2 Weeks: These Factors Suggest Extended Correction
Jordan Lyanchev writes Meme Coin Bloodbath: BONK, FLOKI, WIF, SHIB, and DOGE Crash by Double Digits
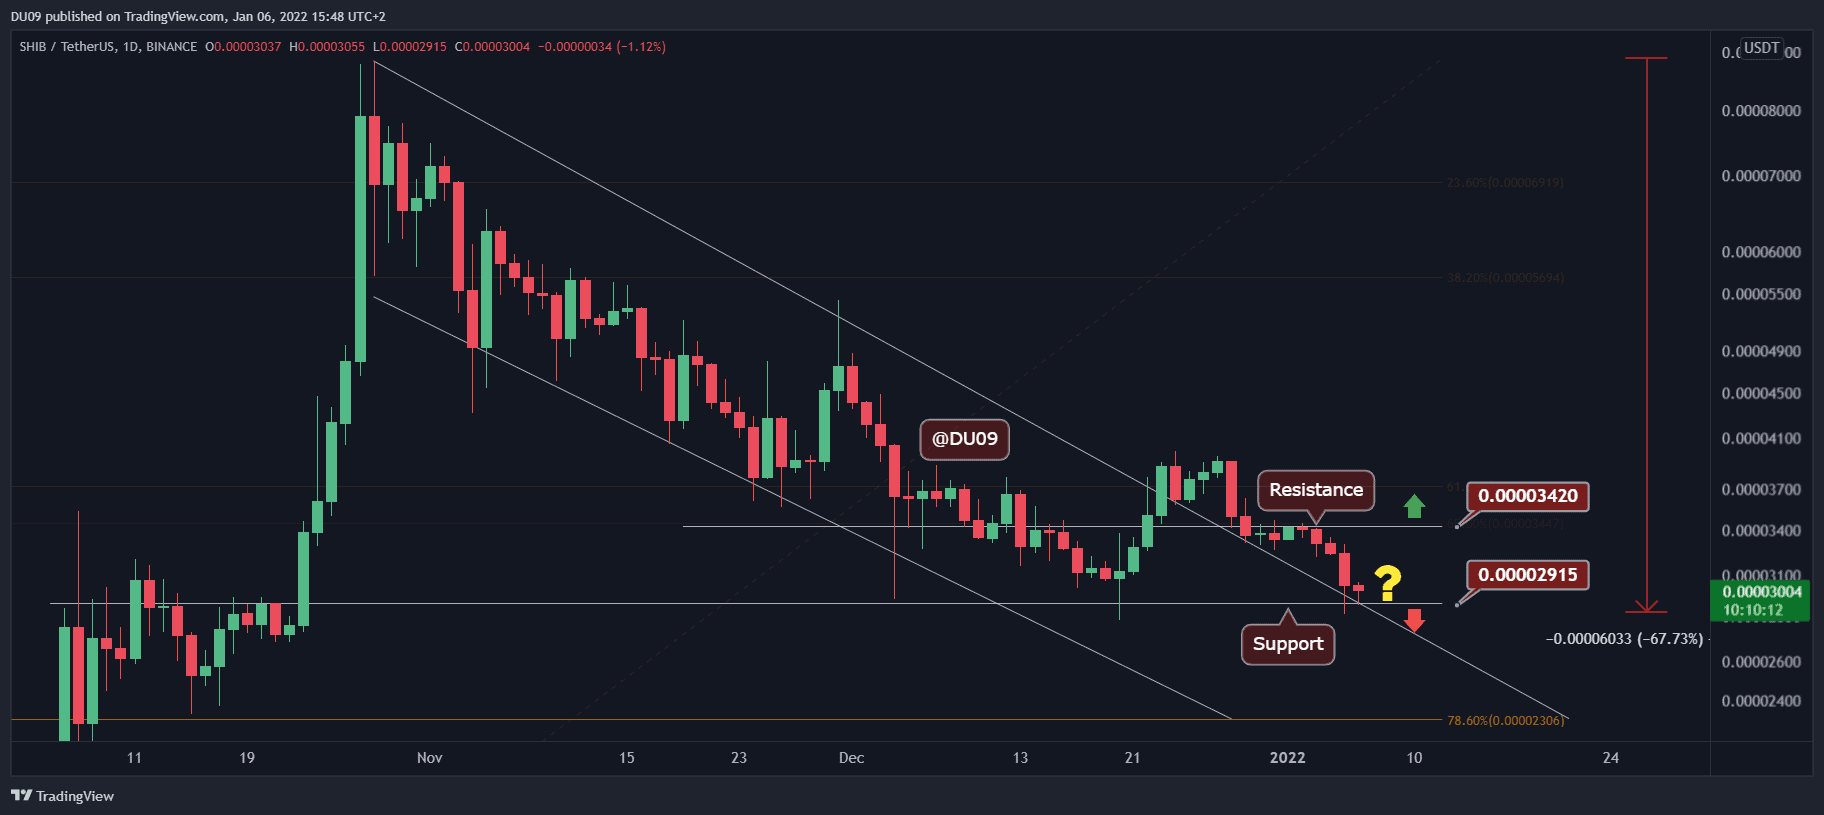
Key Support level: $0.000029, $0.000023
Key Resistance level: $0.000034
There is one good thing about this latest crash in price: SHIB managed to avoid a lower low in price (compared to December 20th). For this reason, if SHIB holds at the current support of $0.000029, then maybe it has a chance to consolidate around the current level. The resistance is found at $0.000034.
Technical Indicators
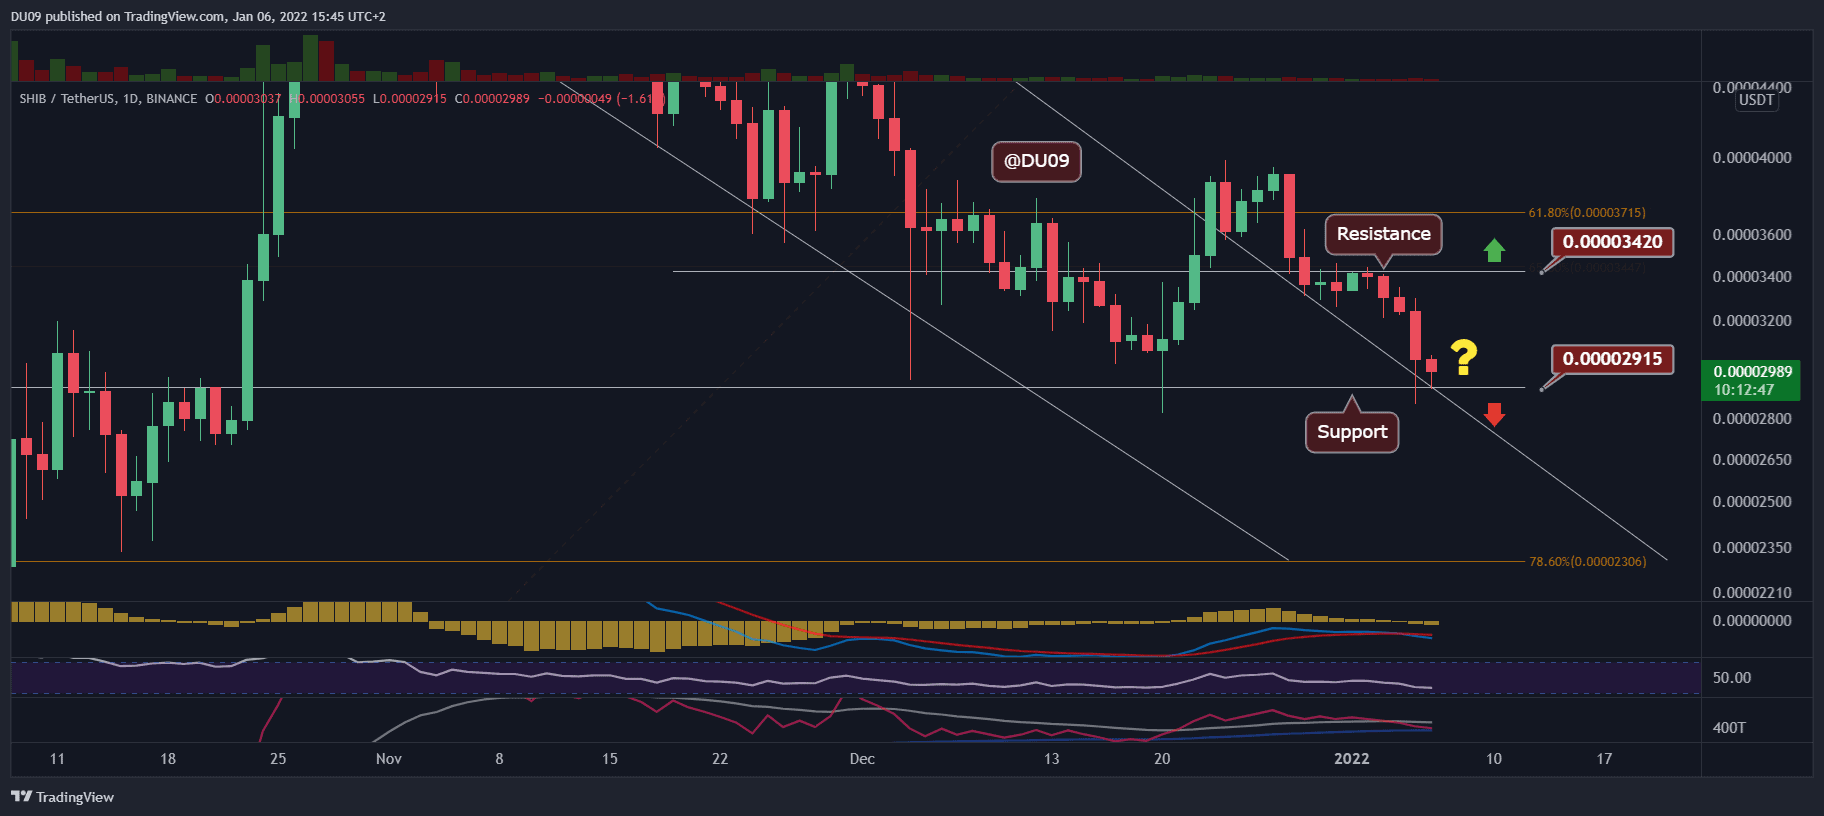
Trading Volume: Despite an increase in volume during the crash yesterday, the overall volume for SHIB remains low if we compare it to the rally period from late 2021. This shows a lack of interest in SHIB, particularly during bearish price action.
RSI: The daily RSI did a lower low, even as the price managed to narrowly avoid it. This is bad news for buyers, and likely the key support will be put under stress again soon.
MACD: The daily MACD is bearish, with momentum building up as the price is falling and the histogram is making lower lows. Until this reverses, it is unlikely for SHIB to stop the downtrend.
Bias
The bias on SHIB is bearish.
Short-Term Prediction for SHIB Price
The cryptocurrency seems to attract attention only during an uptrend, with little volume on the downtrend. This means that price can fall much more on lower volume than initially expected, mostly due to a lack of buyers. The key support at $0.000029 may hold SHIB from further losses, but that is a hard ask considering SHIB fails to bring buyers back.