Key Support level: %excerpt%.000018 Key Resistance level: %excerpt%.000023 SHIB’s misfortunes started in October 2021, and ever since then, the price has been in an uninterrupted downtrend. Every time there was a hope of a reversal, the bears returned stronger. This past Saturday, SHIB made a new lower low and found support at %excerpt%.000018. The resistance is now found at %excerpt%.000023, and bulls are trying to challenge it again after an earlier failure to move SHIB’s price above it. Chart by TradingViewTechnical Indicators Trading Volume: The volume on this most recent drop was high, comparable only with the crash from December. This shows that sellers have plenty of strength to move SHIB lower. RSI: The daily RSI fell in the oversold area for the first time in 2022, from where it bounced up
Topics:
Duo Nine considers the following as important: Price Analysis, Shiba Inu (SHIB), SHIBBTC, SHIBUSD
This could be interesting, too:
Jordan Lyanchev writes Shiba Inu Price Forecasts: Another 50% Crash or 420% Rally Ahead for SHIB?
Dimitar Dzhondzhorov writes This Trader Made Over Million by Selling Shiba Inu (SHIB) Holdings: Details
Dimitar Dzhondzhorov writes Shiba Inu (SHIB) Drops by 15% in 2 Weeks: These Factors Suggest Extended Correction
Jordan Lyanchev writes Meme Coin Bloodbath: BONK, FLOKI, WIF, SHIB, and DOGE Crash by Double Digits
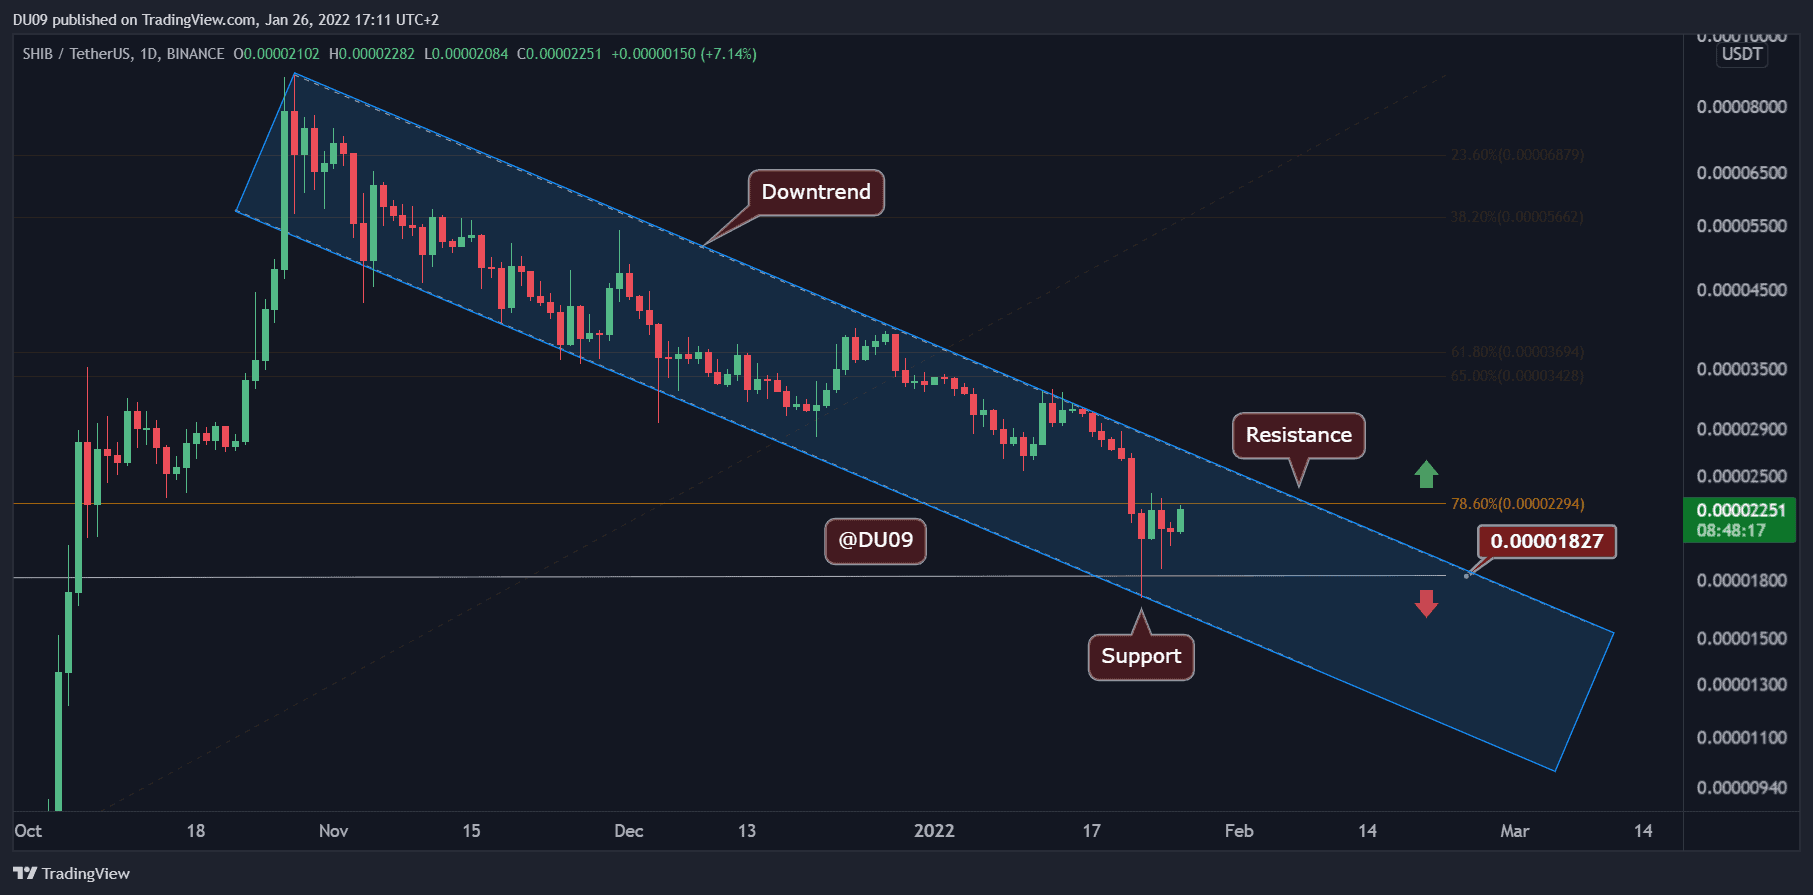
Key Support level: $0.000018
Key Resistance level: $0.000023
SHIB’s misfortunes started in October 2021, and ever since then, the price has been in an uninterrupted downtrend. Every time there was a hope of a reversal, the bears returned stronger. This past Saturday, SHIB made a new lower low and found support at $0.000018.
The resistance is now found at $0.000023, and bulls are trying to challenge it again after an earlier failure to move SHIB’s price above it.
Technical Indicators
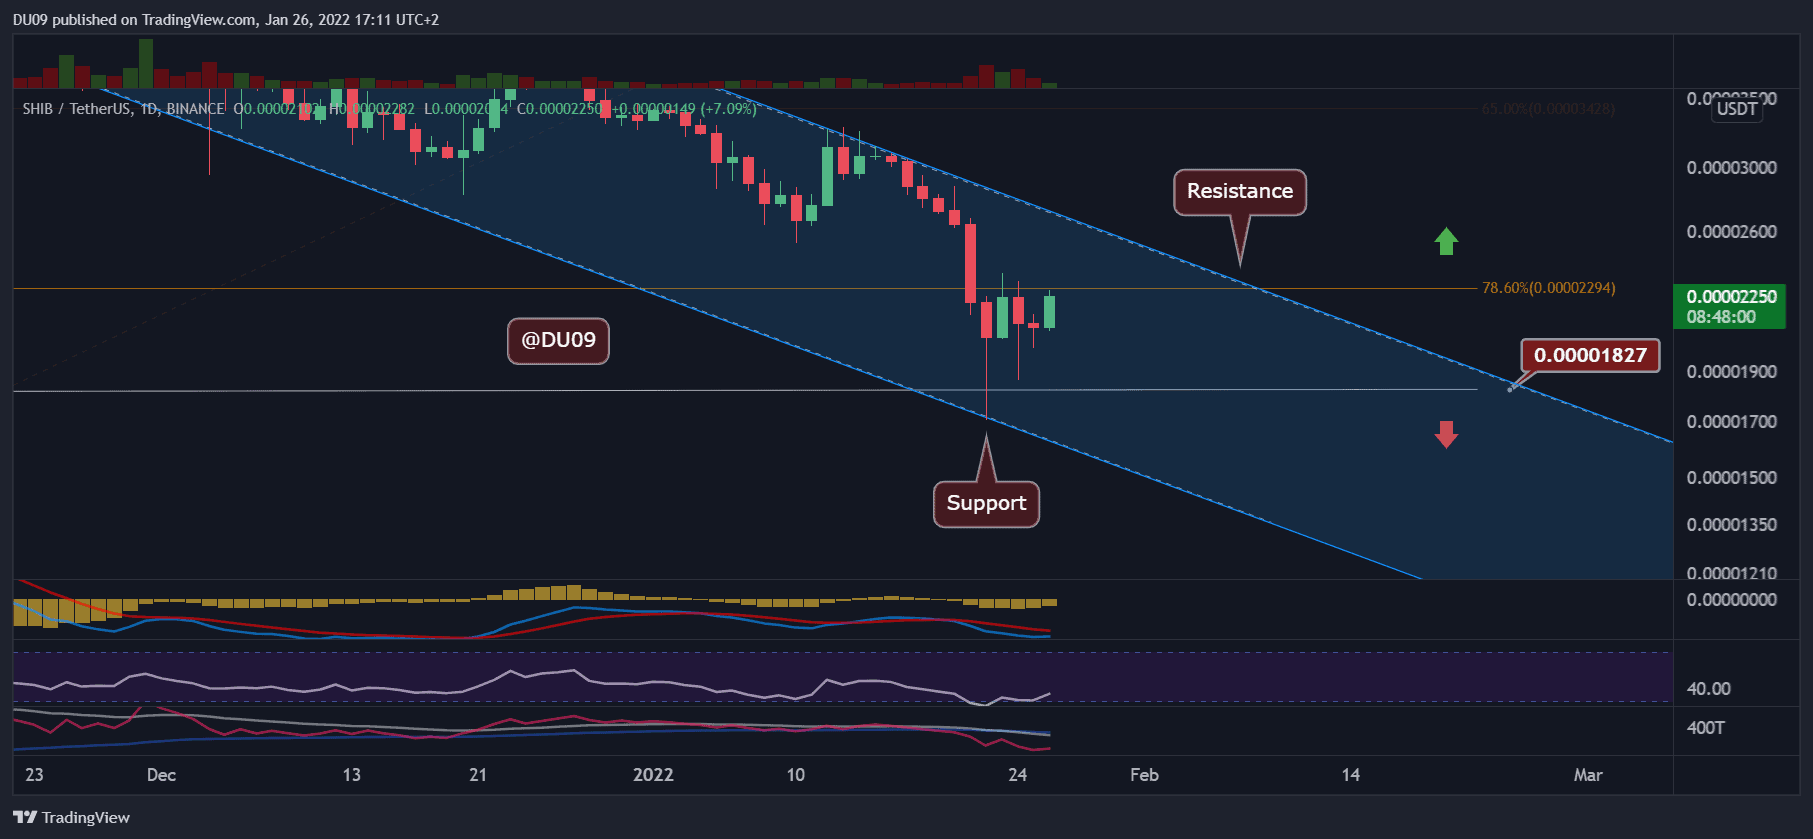
Trading Volume: The volume on this most recent drop was high, comparable only with the crash from December. This shows that sellers have plenty of strength to move SHIB lower.
RSI: The daily RSI fell in the oversold area for the first time in 2022, from where it bounced up quickly. This is good news for the buyers, but the key resistance seems to put up a fight and is currently blocking SHIB from moving higher.
MACD: The daily MACD remains bearish, but the histogram shows some indication of bullishness with a higher low. Buyers really need to break the resistance to turn this around.
Bias
The bias on SHIB is bearish. This may be revisited if the cryptocurrency breaks the resistance level in question.
Short-Term Prediction for SHIB Price
SHIB is just under the key resistance at $0.000023 and does not appear very convinced it can break it. For this reason, any failure here might push the price back on the support at $0.000018.