Ripple has been in a downward trend over the past eleven months. This comes shortly after topping at almost . Despite this week’s green candle so far, the daily candles have not shown any strength. The Daily Chart Technical Analysis By Grizzly Ripple is trading below the EMA200 line (marked by white) on the daily timeframe, which has provided resistance for the recent months, and currently lies at %excerpt%.85. Going forward, the primary key level is the static resistance at (marked by blue), which intersects with dynamic resistance (marked by red) and is also a psychological barrier. Ripple faces a difficult task, and breaking above the shouldn’t be easy. The notable point is the status of the CMF indicator. After touching the yellow area and crossing above the baseline,
Topics:
CryptoVizArt considers the following as important: Ripple (XRP) Price, XRP Analysis, xrpbtc, xrpusd
This could be interesting, too:
Jordan Lyanchev writes Ripple’s (XRP) Surge to Triggers Over Million in Short Liquidations
Jordan Lyanchev writes Trump Confirms Work on Strategic Crypto Reserve: XRP, ADA, SOL Included
Dimitar Dzhondzhorov writes Is a Major Ripple v. SEC Lawsuit Development Expected This Week? Here’s Why
Mandy Williams writes Ripple Releases Institutional DeFi Roadmap for XRP Ledger in 2025
Ripple has been in a downward trend over the past eleven months. This comes shortly after topping at almost $2. Despite this week’s green candle so far, the daily candles have not shown any strength.
The Daily Chart
Technical Analysis By Grizzly
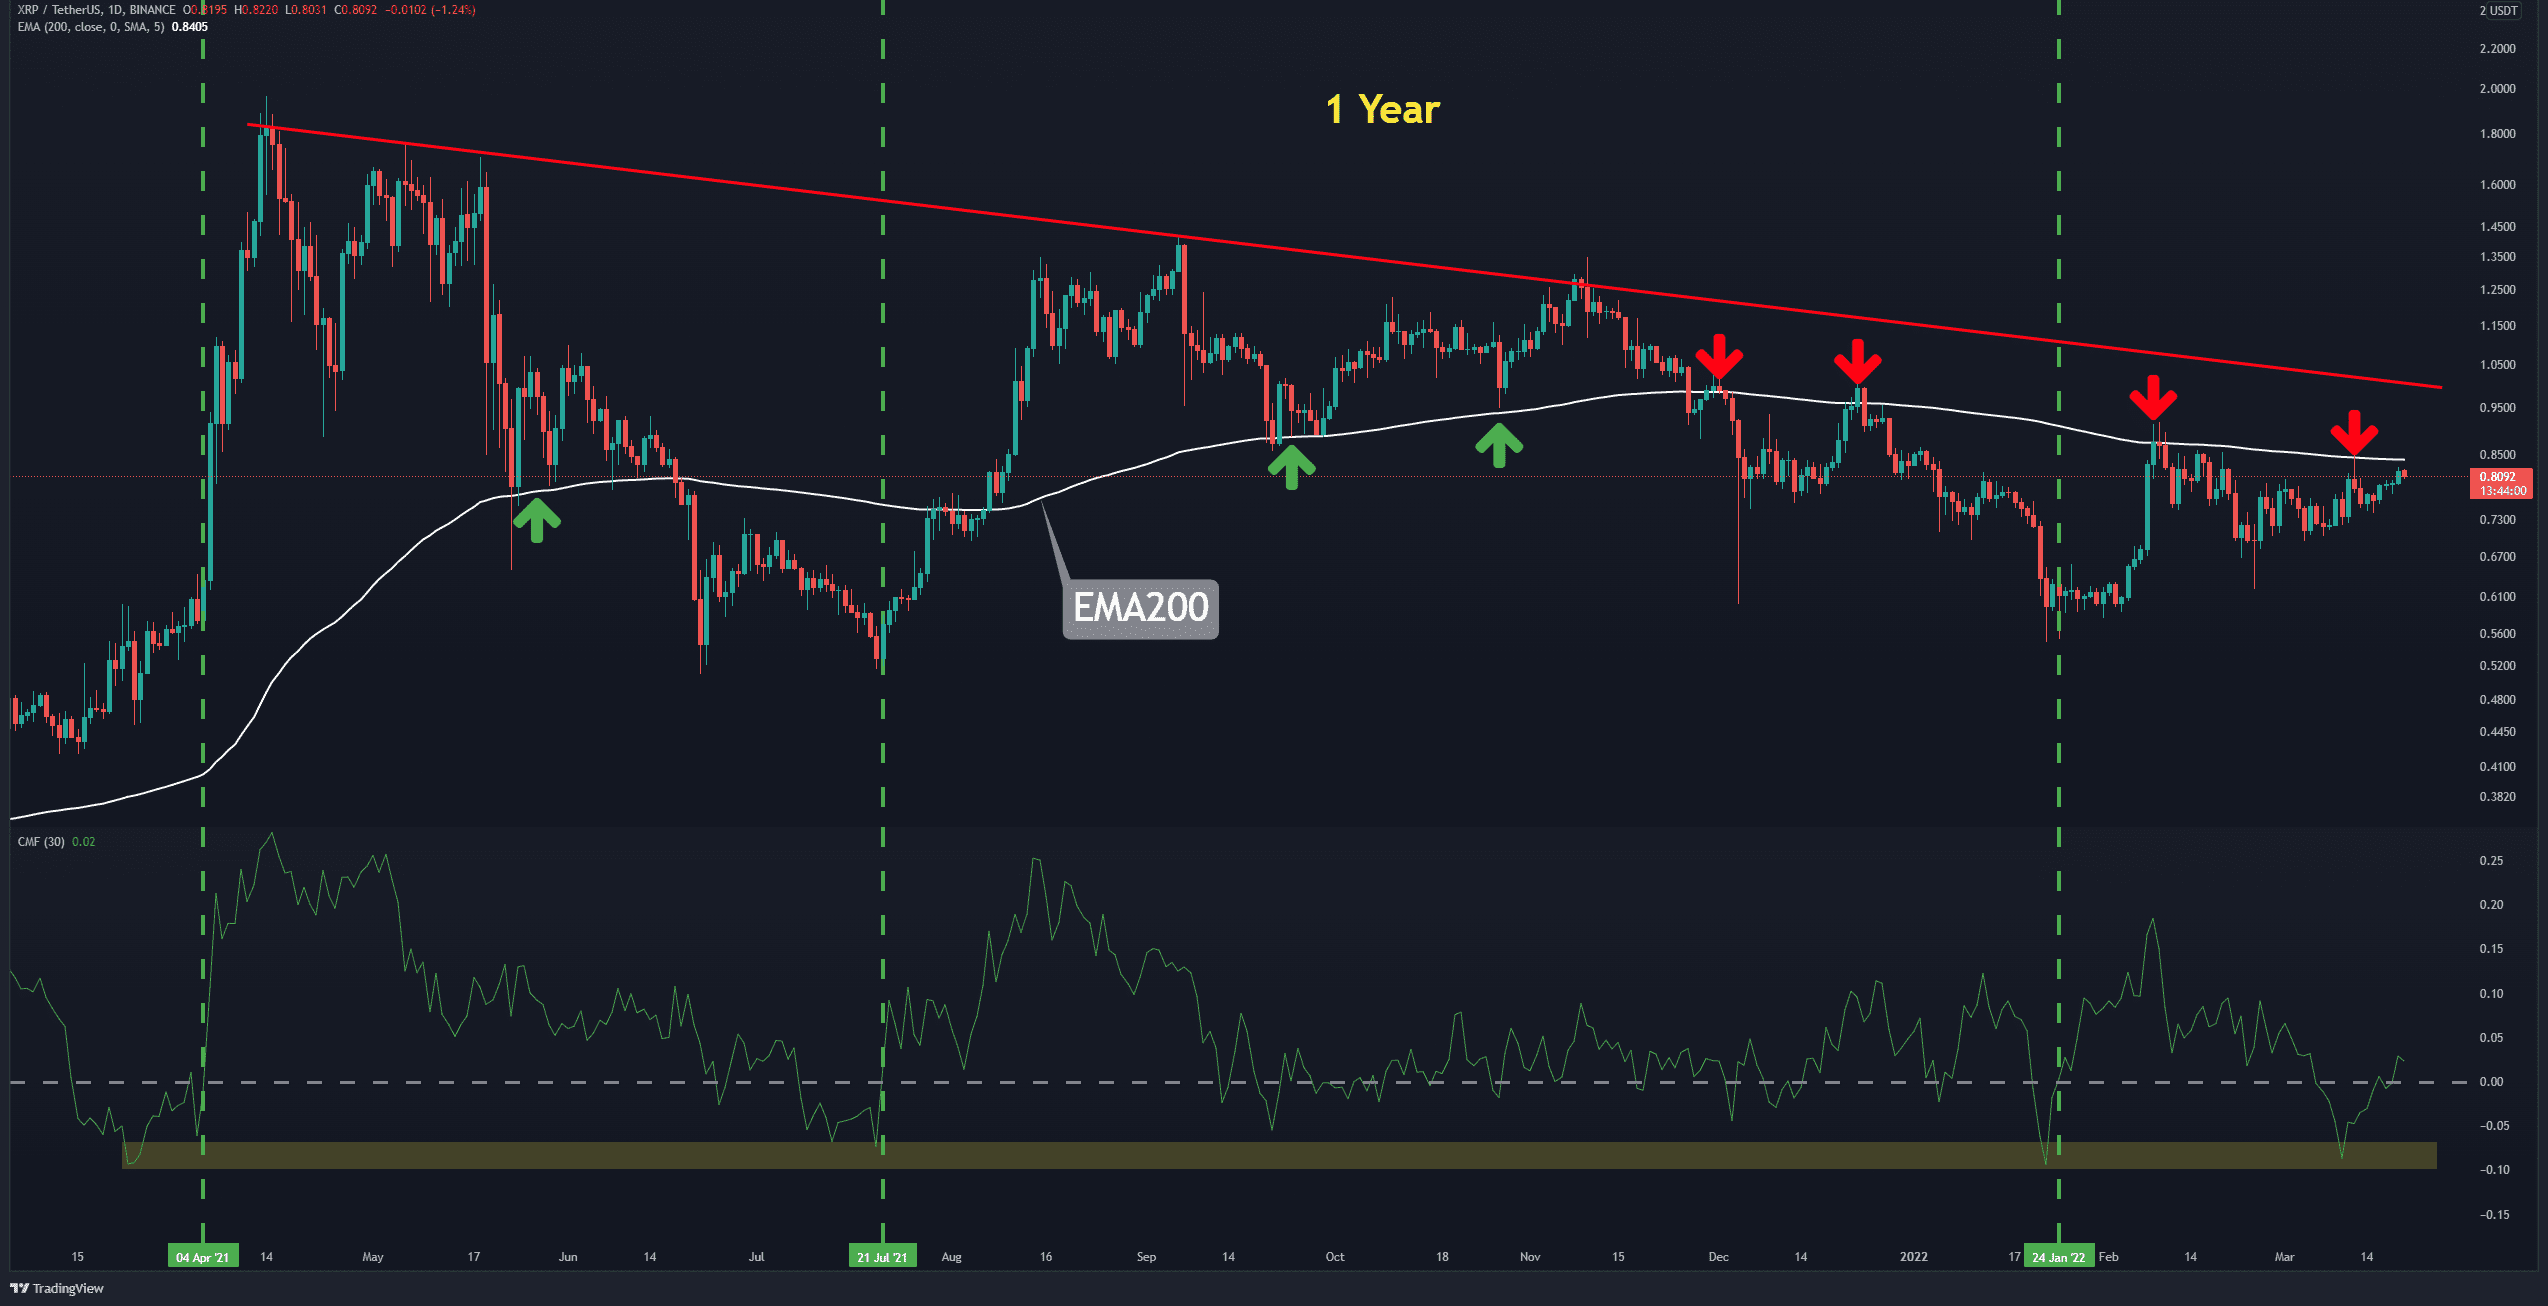
Ripple is trading below the EMA200 line (marked by white) on the daily timeframe, which has provided resistance for the recent months, and currently lies at $0.85.
Going forward, the primary key level is the static resistance at $1 (marked by blue), which intersects with dynamic resistance (marked by red) and is also a psychological barrier. Ripple faces a difficult task, and breaking above the $1 shouldn’t be easy.
The notable point is the status of the CMF indicator. After touching the yellow area and crossing above the baseline, an uptrend had initiated. And now the indicator is in a similar situation, and we have to wait and see whether the price performs the same positive reaction. In this case, the $1 should be retested soon.
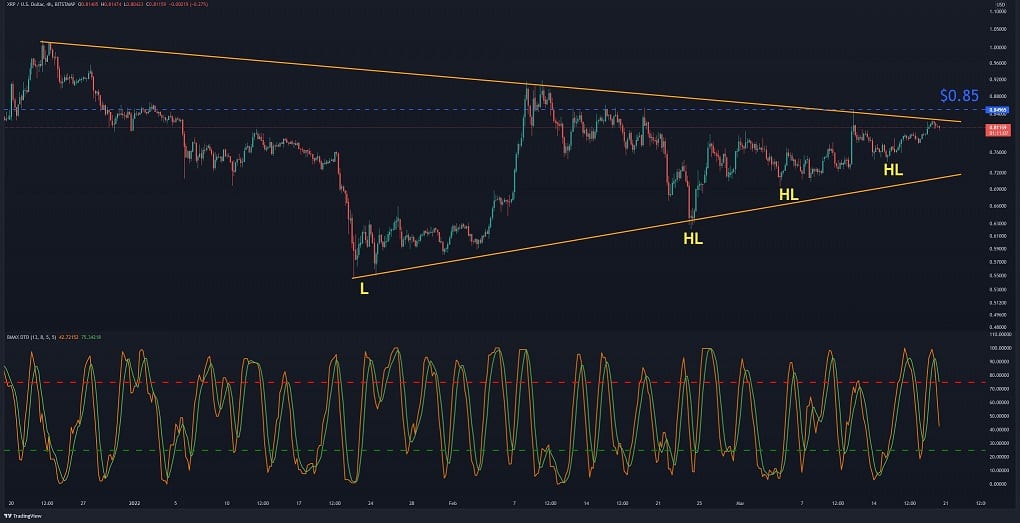
The 4-Hour Chart
on the 4-hour timeframe, as mentioned on the daily timeframe analysis, the short-term resistance lies at $0.85, which seems to provide a lot of supply from sellers.
The BMAX indicator is also moving away from the overbought zone and is expected to gain momentum to test this short-term resistance later. It should be noted that an uptrend in the next short-term is possible as long as a lower low is not formed. Otherwise, the price of XRP can drop to the bottom of the triangle, which lies around the support at $0.70.