A strong resistance level has trapped Ripple for over two months, resulting in the price flirting between %excerpt%.3 to %excerpt%.39 during that period. It seems that the continuation of the upward trend depends on clearing this barrier. However, it’s unsure if there is enough momentum for the bulls. Technical Analysis By Grizzly The Daily Chart Analyzing the following daily chart reveals that the structure formed in the last two months has been textbook bullish, accompanied by the formation of higher highs and higher lows. However, it seems that these highs do not have the strength required in order to proceed further higher. XRP managed to flip above the 100-day moving average (in blue) just two days ago. Consequently, the price touched the resistance zone again in the range of %excerpt%.39
Topics:
CryptoVizArt considers the following as important: Ripple (XRP) Price, XRP Analysis, xrpbtc, xrpusd
This could be interesting, too:
Jordan Lyanchev writes Ripple’s (XRP) Surge to Triggers Over Million in Short Liquidations
Jordan Lyanchev writes Trump Confirms Work on Strategic Crypto Reserve: XRP, ADA, SOL Included
Dimitar Dzhondzhorov writes Is a Major Ripple v. SEC Lawsuit Development Expected This Week? Here’s Why
Mandy Williams writes Ripple Releases Institutional DeFi Roadmap for XRP Ledger in 2025
A strong resistance level has trapped Ripple for over two months, resulting in the price flirting between $0.3 to $0.39 during that period. It seems that the continuation of the upward trend depends on clearing this barrier. However, it’s unsure if there is enough momentum for the bulls.
Technical Analysis
By Grizzly
The Daily Chart
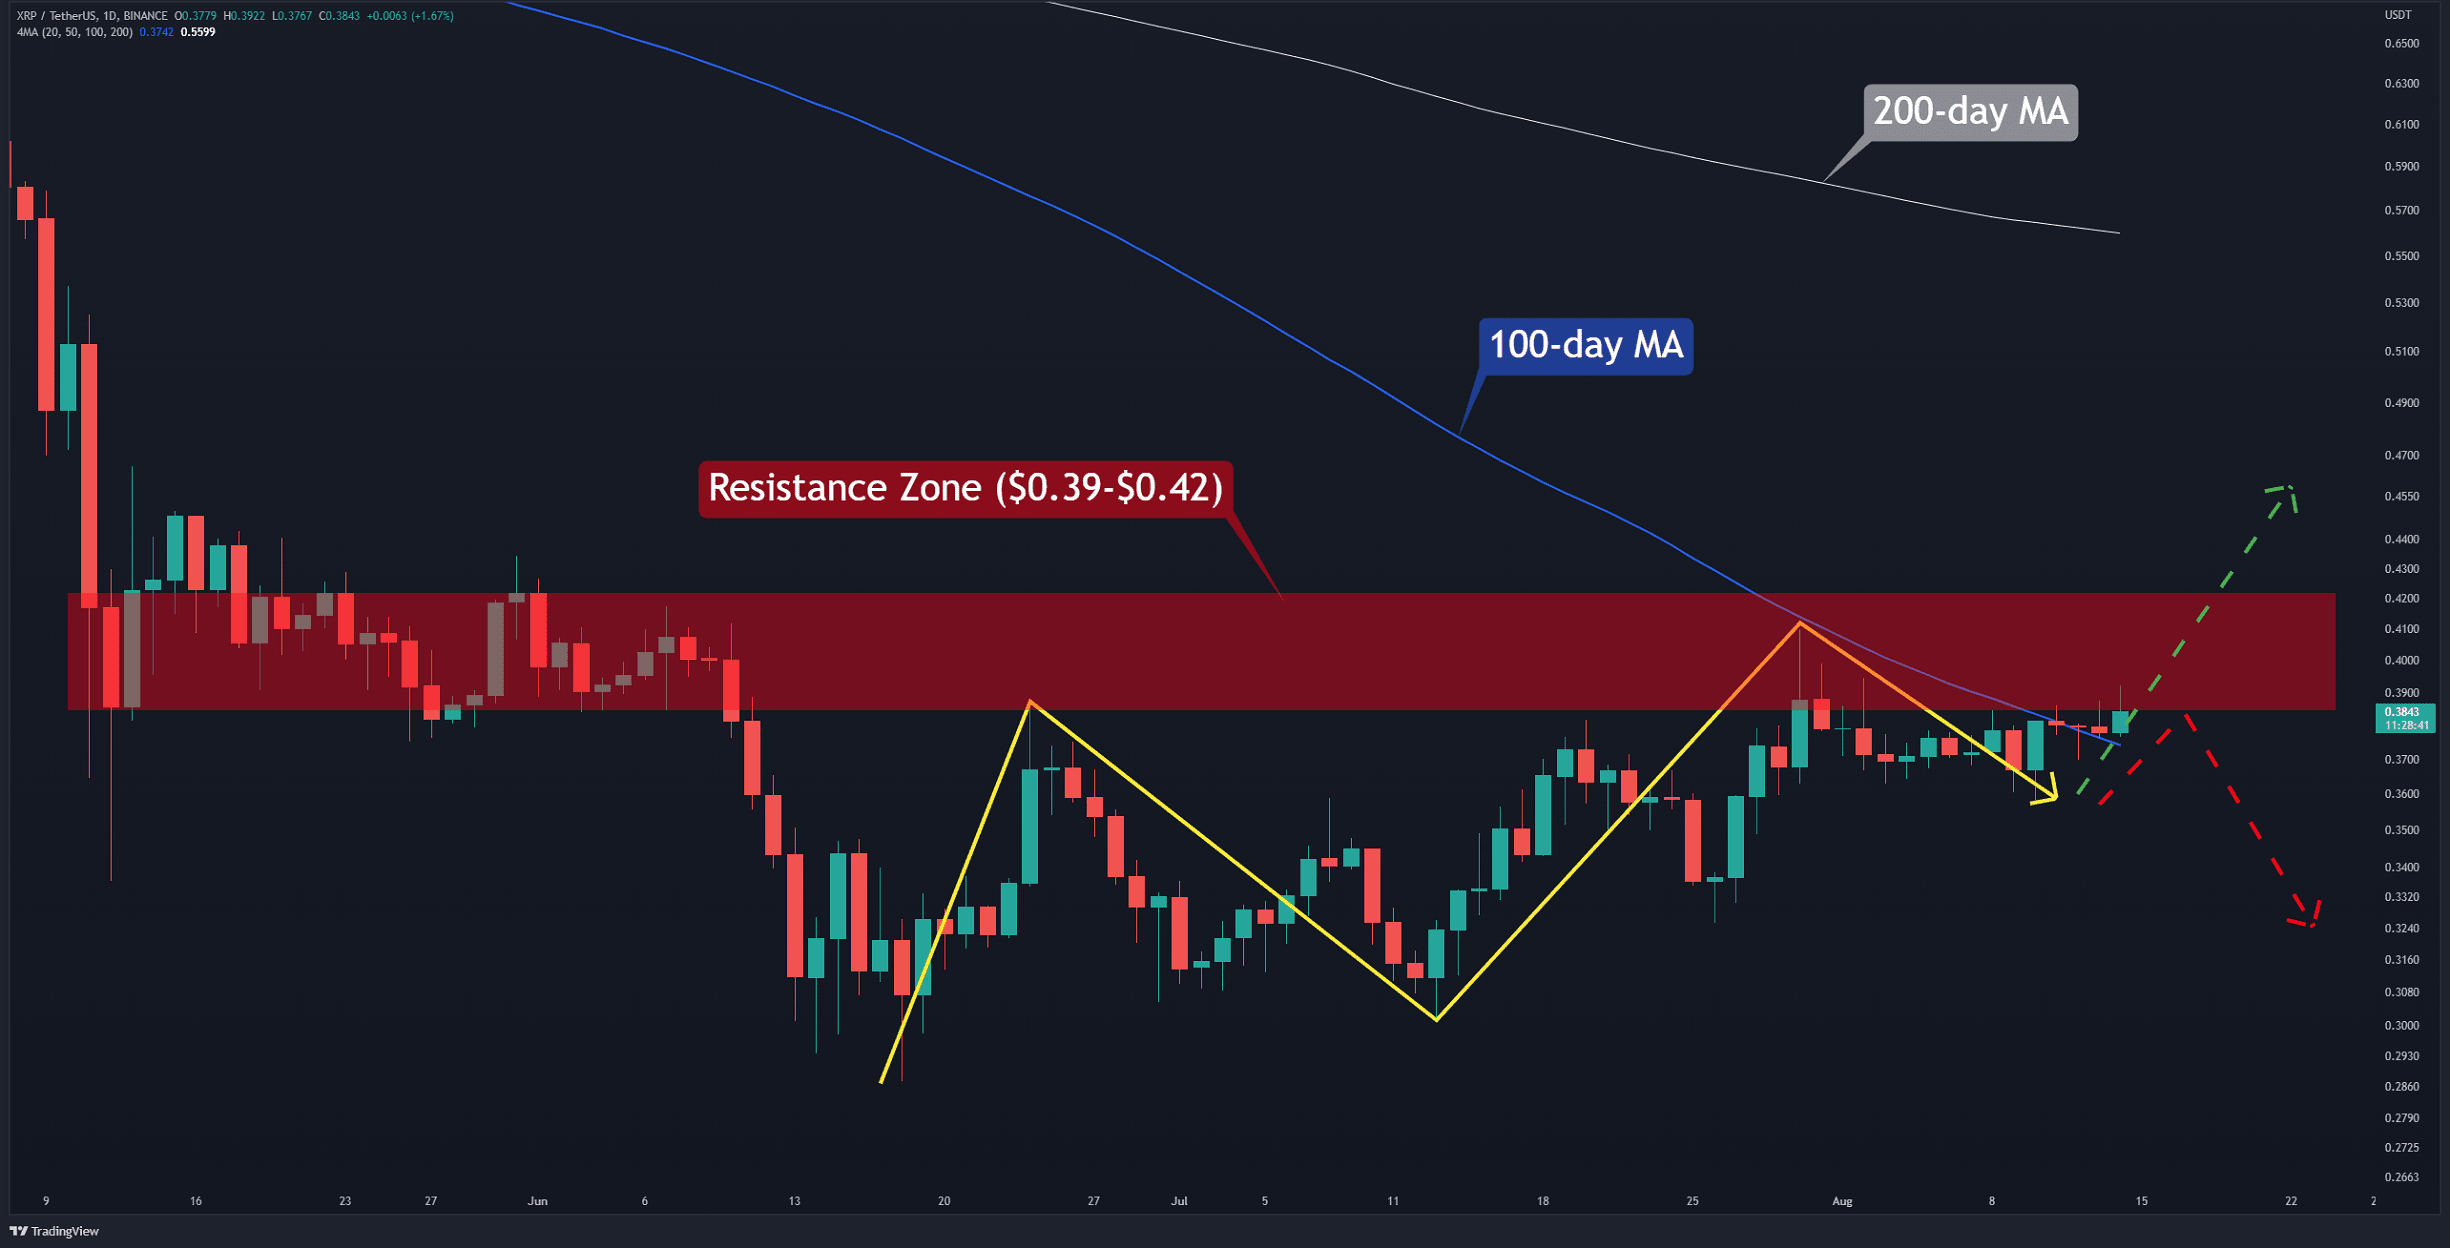
Analyzing the following daily chart reveals that the structure formed in the last two months has been textbook bullish, accompanied by the formation of higher highs and higher lows. However, it seems that these highs do not have the strength required in order to proceed further higher.
XRP managed to flip above the 100-day moving average (in blue) just two days ago. Consequently, the price touched the resistance zone again in the range of $0.39 – $0.42 (in red). For this reason, if the bulls can drive the price above the mentioned zone, it is expected that XRP will target the 200-day moving average (in white).
In a bearish scenario – Ripple will fail to break the key resistance and plunge towards support at $0.33 to retest it. A close below this level invalidates the bullish structure mentioned above.
Key Support Levels: $0.33 & $0.30
Key Resistance Levels: $0.42 & $0.47
Daily Moving Averages:
MA20: $0.37
MA50: $0.35
MA100: $0.37
MA200: $0.56
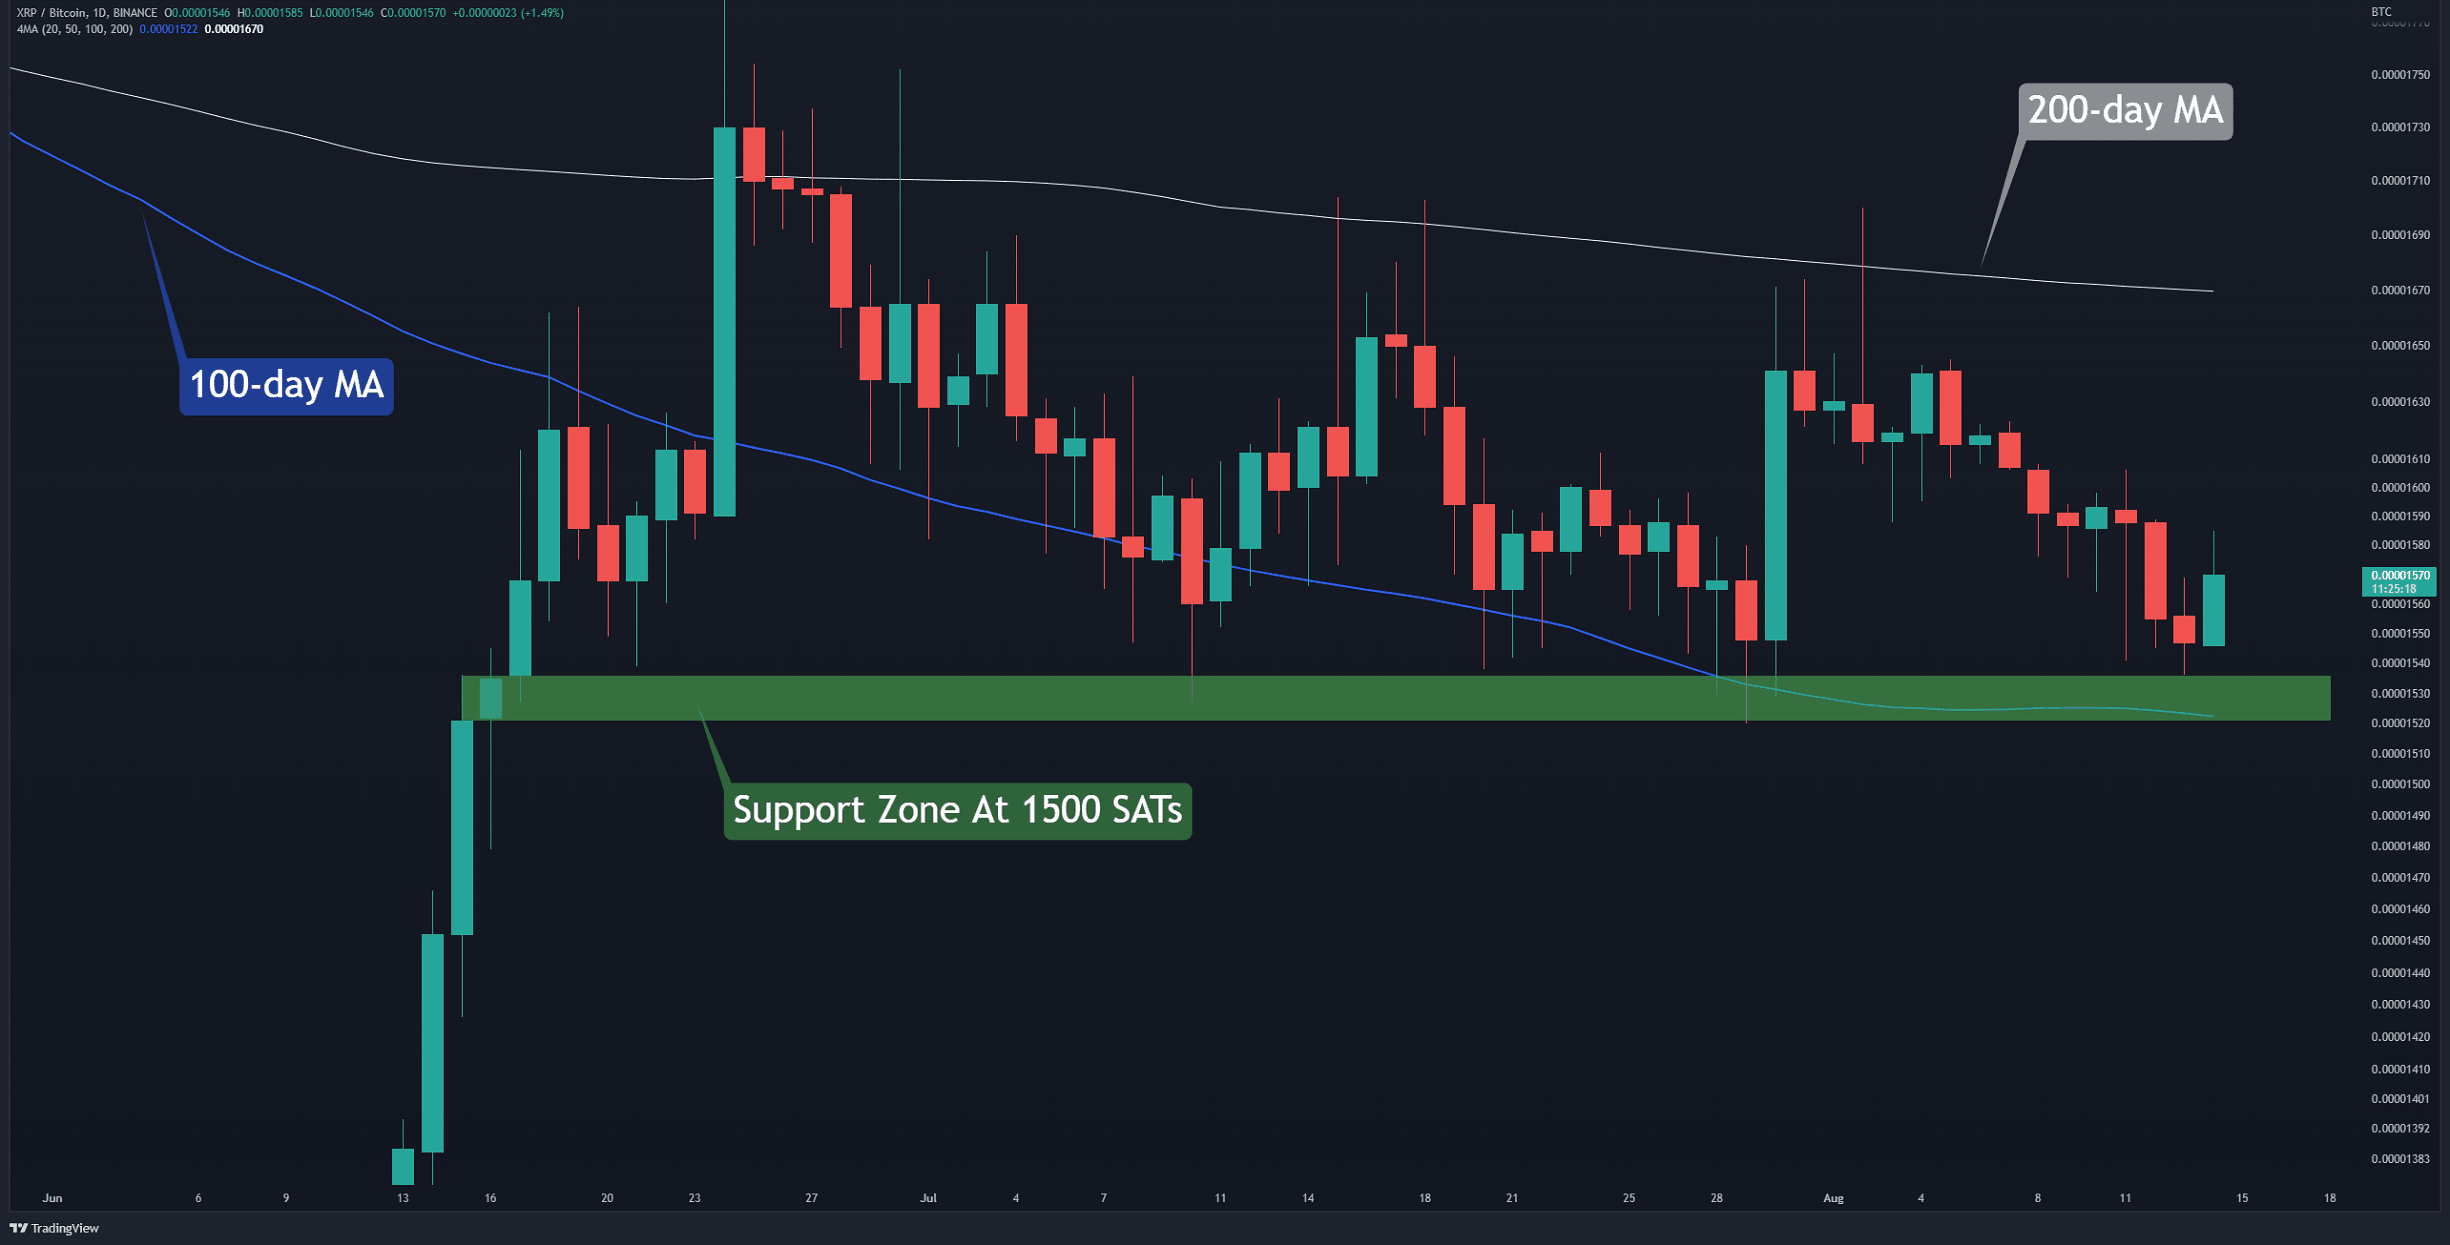
The XRP/BTC Chart
Against Bitcoin, the price fluctuates between the 100-day (in blue) and the 200-day (in white) moving average lines. The bears aggressively defend the horizontal resistance in the 1700 – 1800 SAT range. Similarly, the bulls did not let the price drop below the 1500 SAT zone (in green).
In conclusion, the sideways action is expected to continue as long as there is no break and close above/below one of the mentioned levels.
Key Support Levels: 1500 SATs & 1370 SATs
Key Resistance Levels: 1700 SATs & 2100 SATs