XRP continues to slide downwards, following the overall bearish sentiment in the crypto markets. The price got rejected at the critical line of resistance of %excerpt%.92 and now heading towards low levels where support lies. Technical Analysis Technical Analysis By Grizzly The Daily Chart On the daily timeframe, despite the sudden spikes, it still seems that the sellers have the upper hand now. If we look at the past recent uptrends, we see that previous uptrends have occurred by increasing buying pressure from buyer takers, which led to price increases. These areas are marked with numbers 1, 2, and 3 and white lines on the following chart. We can’t identify the same structure that led to the price rise before, when comparing it to today’s situation. Key Support Levels: %excerpt%.6 &
Topics:
CryptoVizArt considers the following as important: Ripple (XRP) Price, XRP Analysis, xrpbtc, xrpusd
This could be interesting, too:
Jordan Lyanchev writes Ripple’s (XRP) Surge to Triggers Over Million in Short Liquidations
Jordan Lyanchev writes Trump Confirms Work on Strategic Crypto Reserve: XRP, ADA, SOL Included
Dimitar Dzhondzhorov writes Is a Major Ripple v. SEC Lawsuit Development Expected This Week? Here’s Why
Mandy Williams writes Ripple Releases Institutional DeFi Roadmap for XRP Ledger in 2025
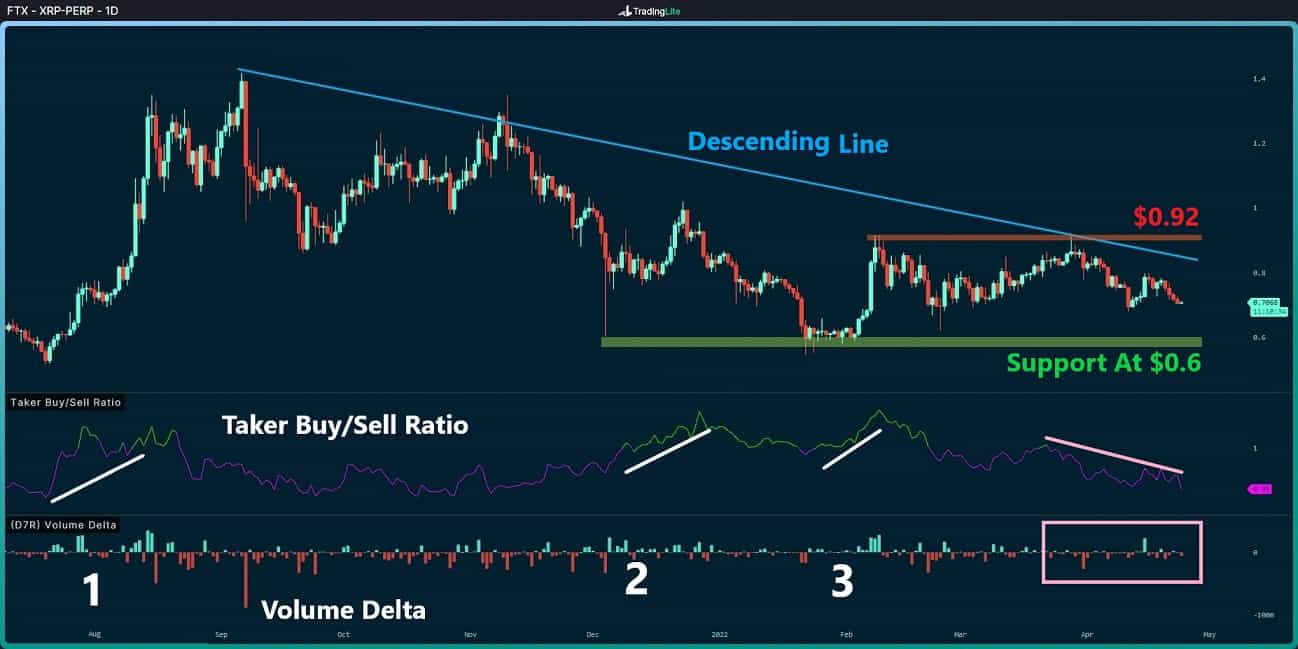
XRP continues to slide downwards, following the overall bearish sentiment in the crypto markets. The price got rejected at the critical line of resistance of $0.92 and now heading towards low levels where support lies.
Technical Analysis
Technical Analysis By Grizzly
The Daily Chart
On the daily timeframe, despite the sudden spikes, it still seems that the sellers have the upper hand now. If we look at the past recent uptrends, we see that previous uptrends have occurred by increasing buying pressure from buyer takers, which led to price increases.
These areas are marked with numbers 1, 2, and 3 and white lines on the following chart. We can’t identify the same structure that led to the price rise before, when comparing it to today’s situation.
Key Support Levels: $0.6 & $0.5
Key Resistance Levels: $0.92 & $1.00
Moving Averages:
MA20: $0.75
MA50: $0.78
MA100: $0.75
MA200: $0.87
The 4-Hour Chart
In the 4-hour timeframe, after XRP corrected 50% of what it had lost in April, it failed to break the resistance barrier at $0.8 (which intersects with the MA100 line as resistance). Since then, it has continued its downtrend, which is expected to retest the support at $0.68.
