Ripple’s recent price action has been particularly rough following a convincing rejection from a key resistance level. The cryptocurrency is currently dropping toward the bulls’ last resort as risk assets stumble. Technical Analysis By: Edris The Daily Chart On the daily chart, the price has failed to move back above the significant %excerpt%.43 resistance level and is currently falling rapidly. The 50-day and 200-day moving average lines, which also provided additional resistance around the %excerpt%.43 level, are now on the verge of a bearish cross, as the former is seemingly bound to drop below the latter soon. All signs are pointing to a potential retest of the %excerpt%.3 support level, which could be the last hope for a bullish turnaround. However, if the above-mentioned support level
Topics:
CryptoVizArt considers the following as important: Ripple (XRP) Price, XRP Analysis, xrpbtc, xrpusd
This could be interesting, too:
Jordan Lyanchev writes Ripple’s (XRP) Surge to Triggers Over Million in Short Liquidations
Jordan Lyanchev writes Trump Confirms Work on Strategic Crypto Reserve: XRP, ADA, SOL Included
Dimitar Dzhondzhorov writes Is a Major Ripple v. SEC Lawsuit Development Expected This Week? Here’s Why
Mandy Williams writes Ripple Releases Institutional DeFi Roadmap for XRP Ledger in 2025
Ripple’s recent price action has been particularly rough following a convincing rejection from a key resistance level. The cryptocurrency is currently dropping toward the bulls’ last resort as risk assets stumble.
Technical Analysis
By: Edris
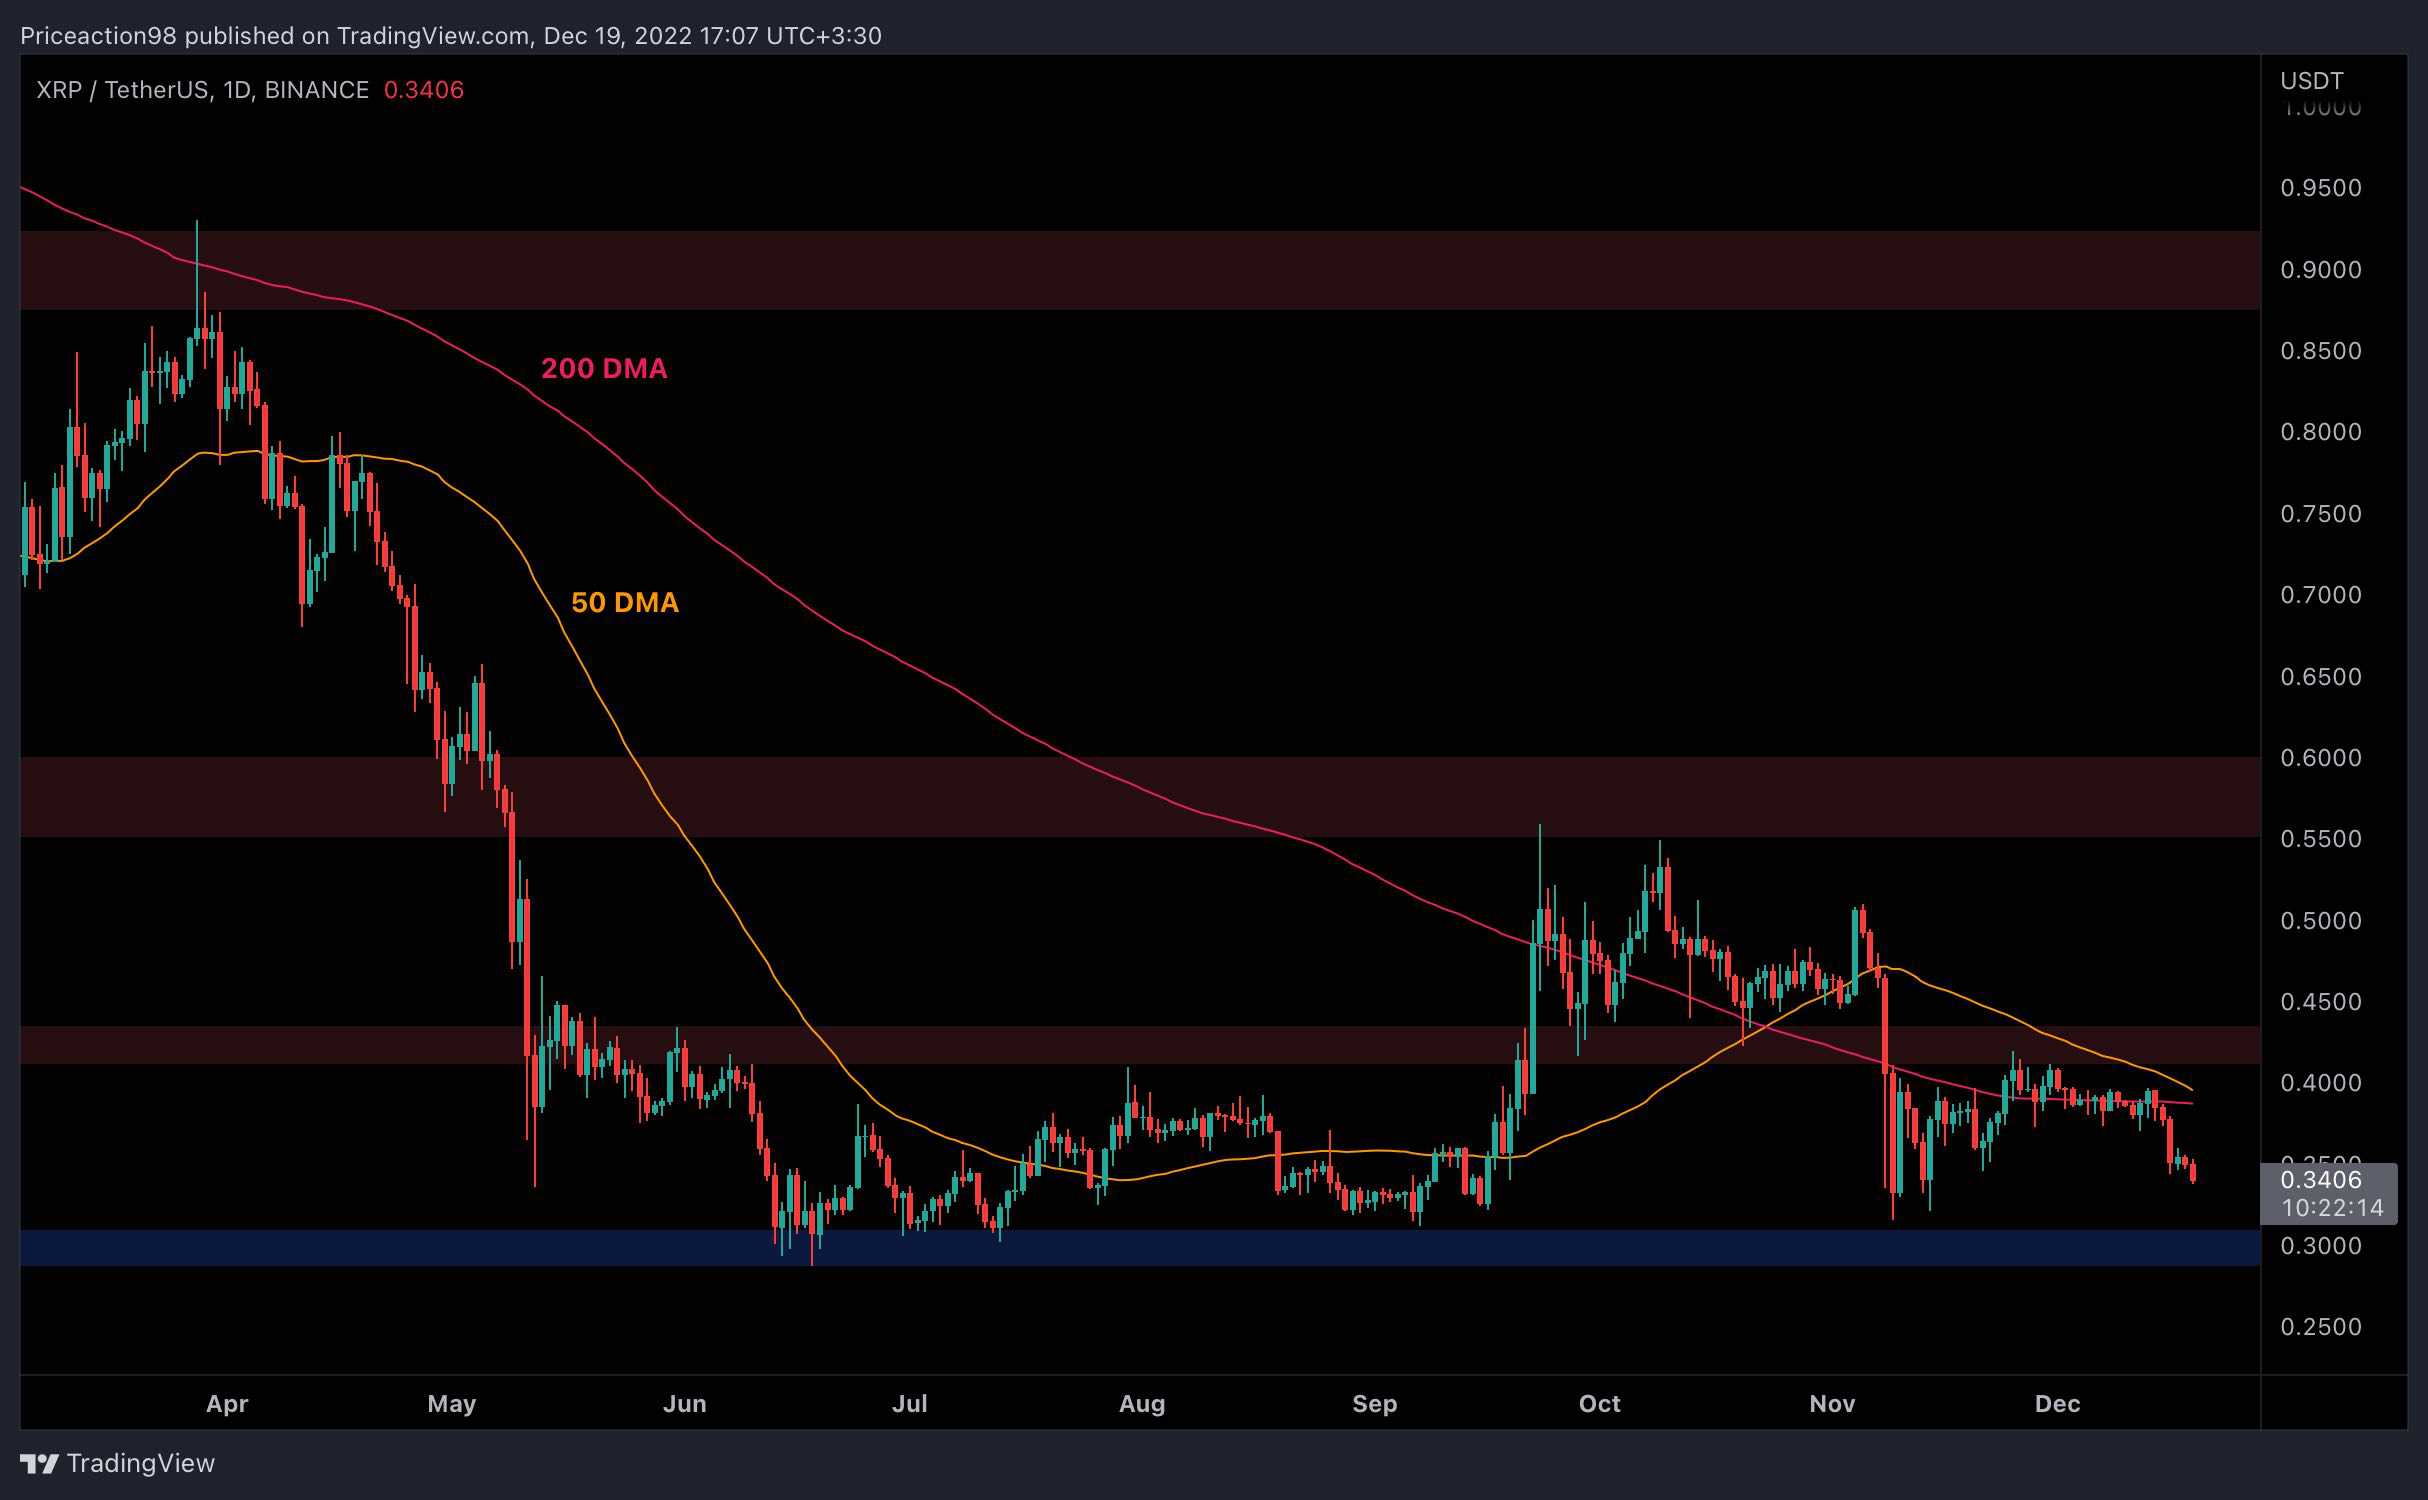
The Daily Chart
On the daily chart, the price has failed to move back above the significant $0.43 resistance level and is currently falling rapidly.
The 50-day and 200-day moving average lines, which also provided additional resistance around the $0.43 level, are now on the verge of a bearish cross, as the former is seemingly bound to drop below the latter soon.
All signs are pointing to a potential retest of the $0.3 support level, which could be the last hope for a bullish turnaround.
However, if the above-mentioned support level also crumbles, a further crash could be expected in the short term.
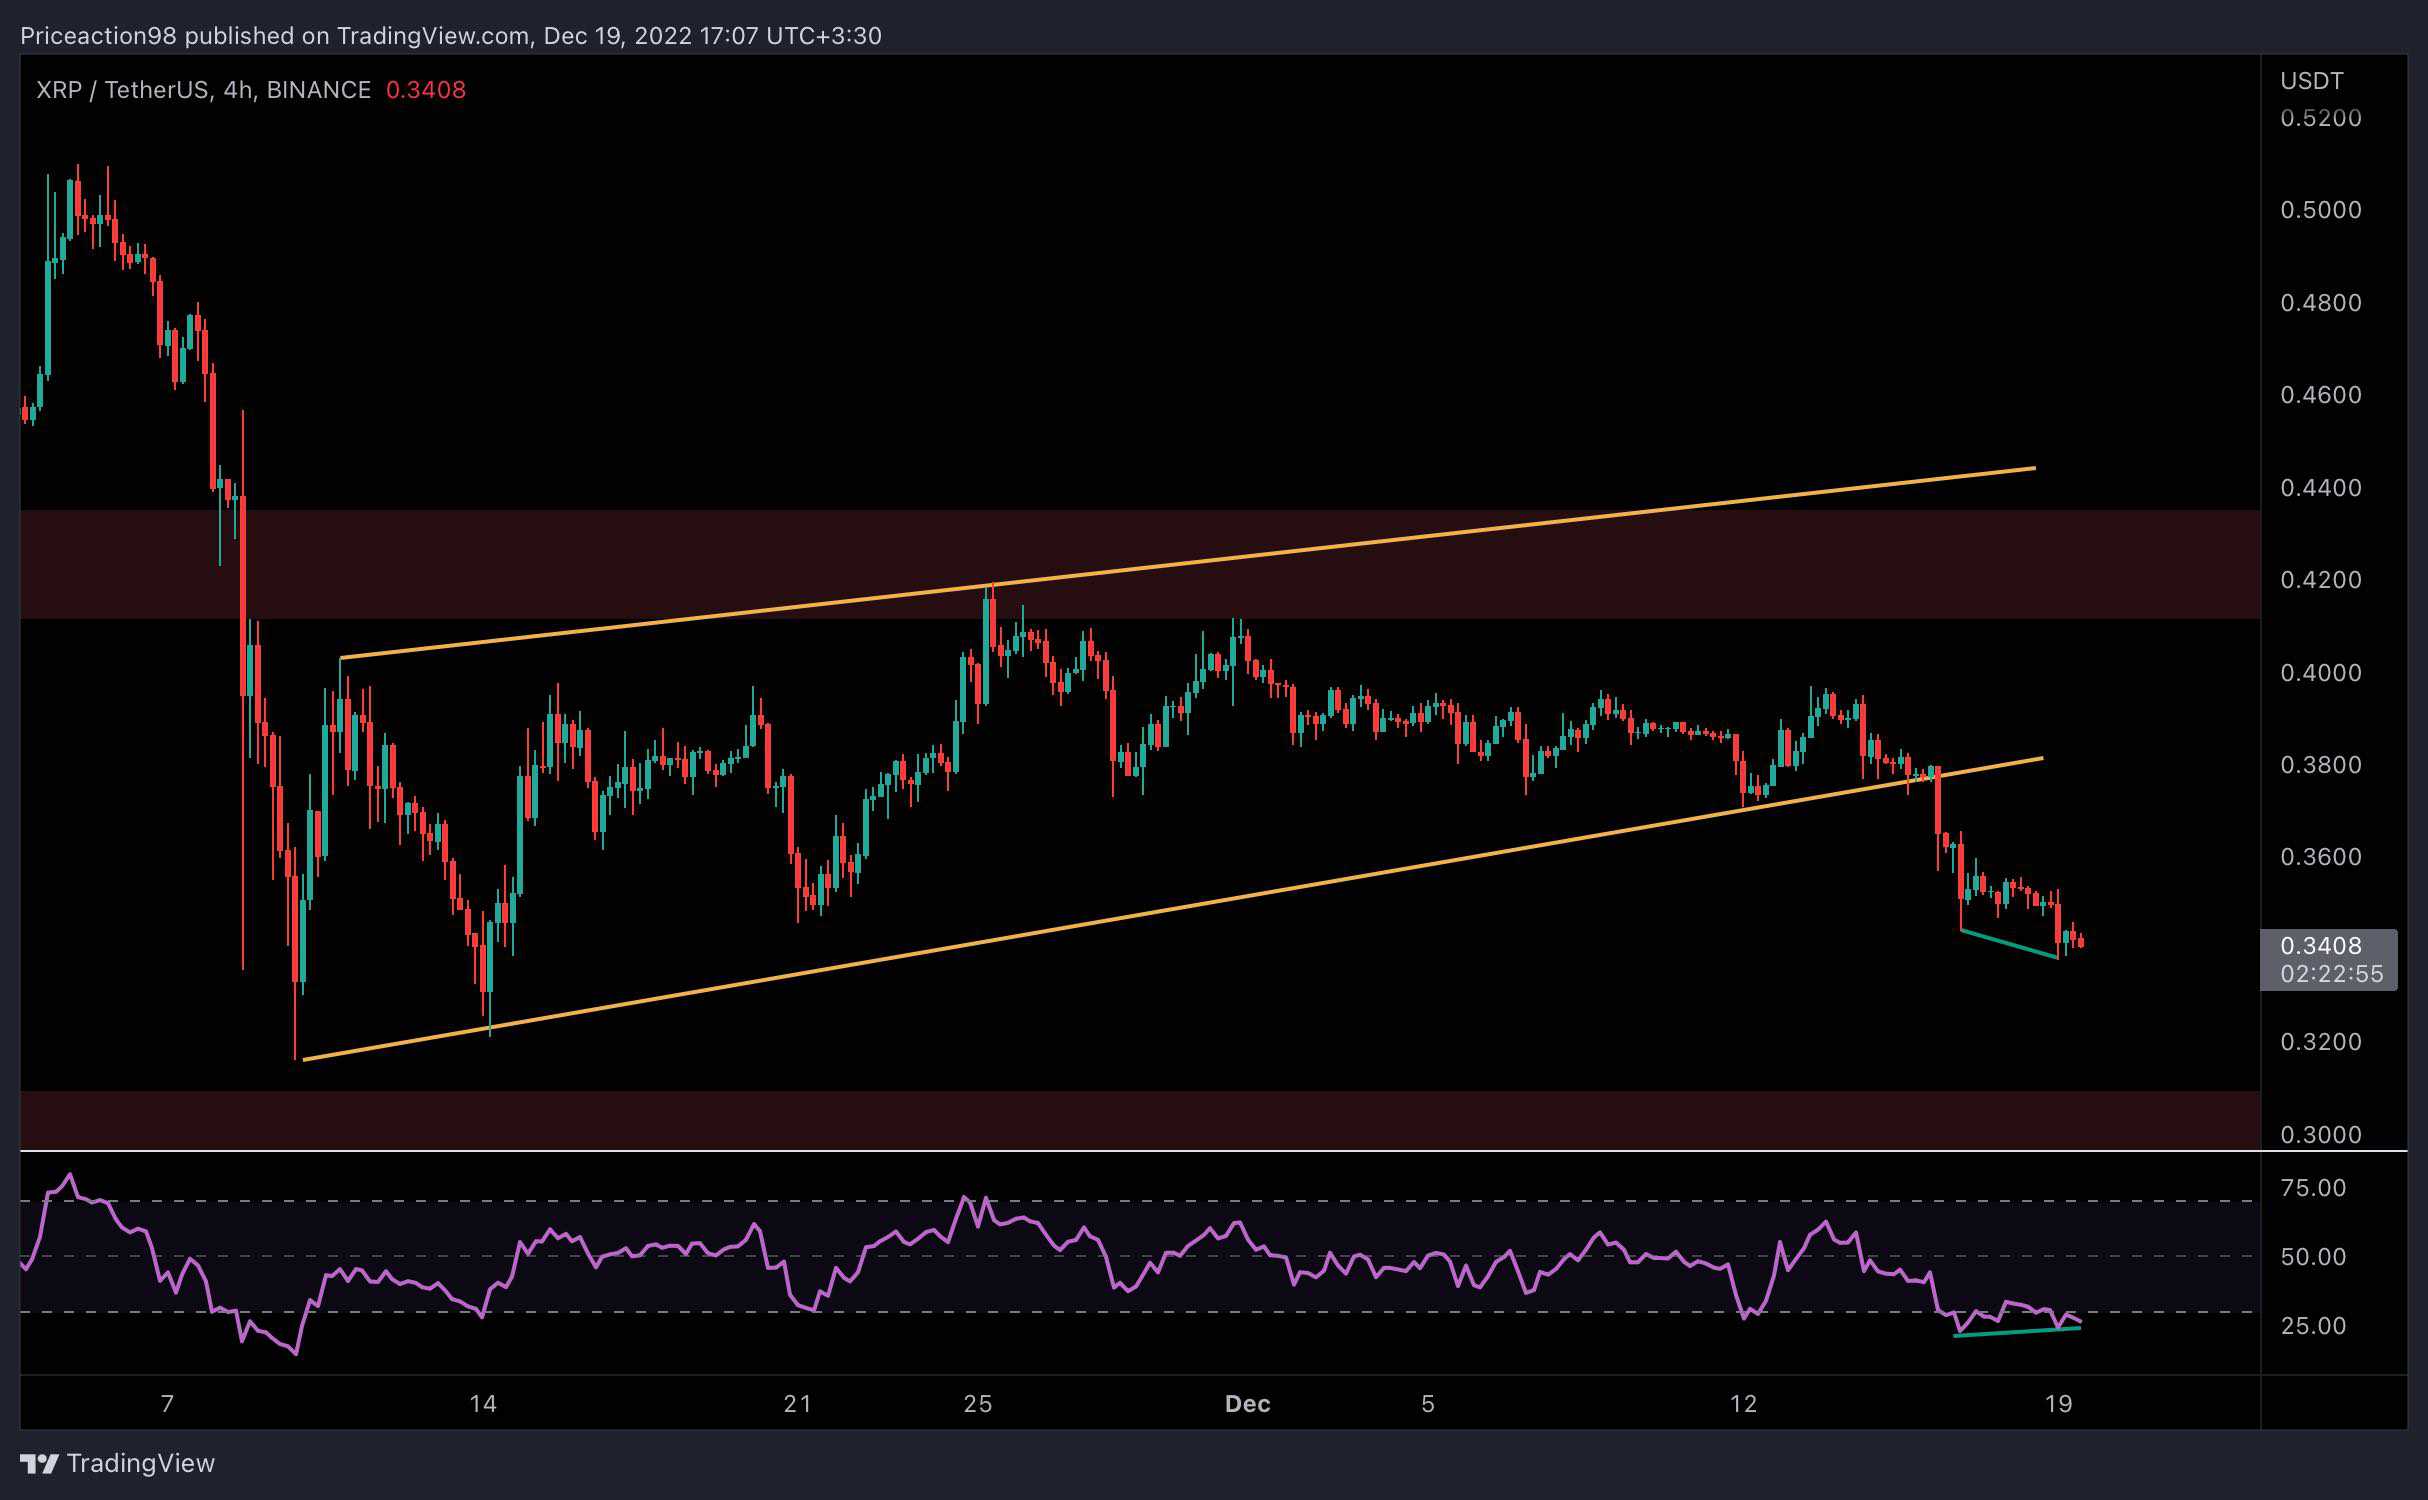
The 4-Hour Chart
The large bearish flag was broken to the downside earlier, and the price has been declining as a result.
From a classical price action standpoint, a retest of the $0.3 support level looks imminent. However, the RSI indicator is currently showcasing a clear bullish divergence in this timeframe. This could hint at a probable pullback toward the lower trendline of the pattern in the short term.
Whether this pullback occurs or not remains to be seen, but the bearish momentum and the overall market structure both increase the likelihood of a drop-down to the $0.3 level in the near future.