Following a ruthless price action in November, Ripple is now attempting to recoup its losses alongside the rest of the cryptocurrency market. Although it was expected that optimism regarding the SEC action would result in positive market movements, this is yet to come to fruition. Technical Analysis By Grizzly The Daily Chart On the daily chart, XRP initiated an uptrend after touching the major horizontal support (in white) at %excerpt%.31, rising 22% from the local low. The 14-day RSI is also attempting to reverse the center line, which represents the boundary between bullish and bearish zones. XRP must now break above %excerpt%.42 in order to retest the descending line resistance (in red), which has followed the price since April 2021. However, the initial effort in late November was
Topics:
CryptoVizArt considers the following as important: Ripple (XRP) Price, XRP Analysis, xrpbtc, xrpusd
This could be interesting, too:
Jordan Lyanchev writes Ripple’s (XRP) Surge to Triggers Over Million in Short Liquidations
Jordan Lyanchev writes Trump Confirms Work on Strategic Crypto Reserve: XRP, ADA, SOL Included
Dimitar Dzhondzhorov writes Is a Major Ripple v. SEC Lawsuit Development Expected This Week? Here’s Why
Mandy Williams writes Ripple Releases Institutional DeFi Roadmap for XRP Ledger in 2025
Following a ruthless price action in November, Ripple is now attempting to recoup its losses alongside the rest of the cryptocurrency market. Although it was expected that optimism regarding the SEC action would result in positive market movements, this is yet to come to fruition.
Technical Analysis
By Grizzly
The Daily Chart
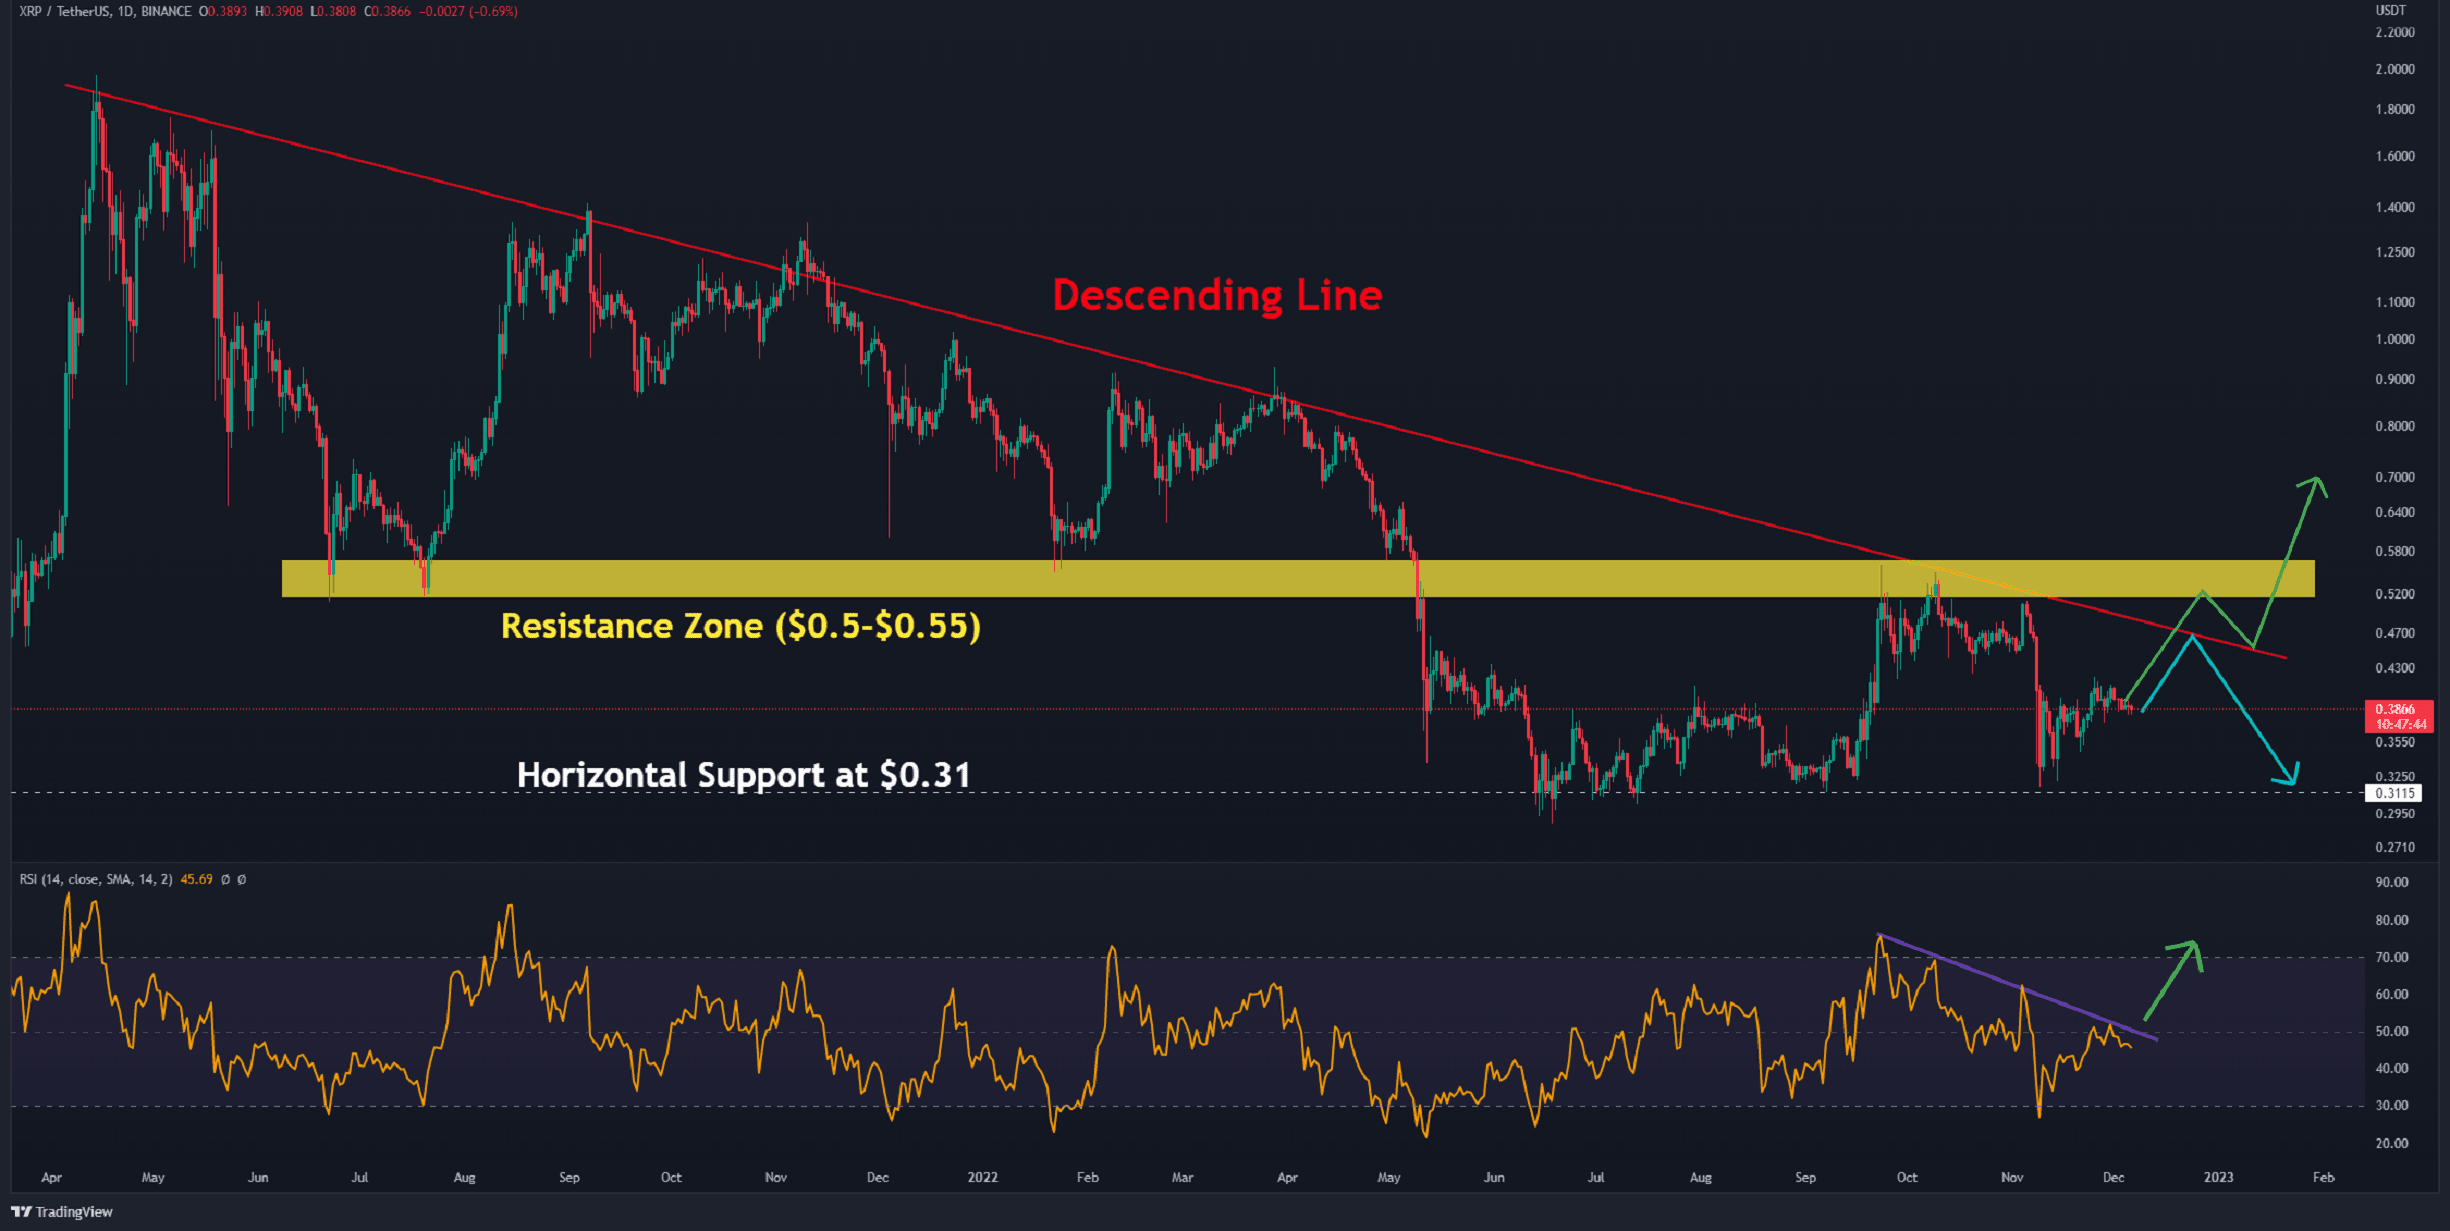
On the daily chart, XRP initiated an uptrend after touching the major horizontal support (in white) at $0.31, rising 22% from the local low. The 14-day RSI is also attempting to reverse the center line, which represents the boundary between bullish and bearish zones.
XRP must now break above $0.42 in order to retest the descending line resistance (in red), which has followed the price since April 2021. However, the initial effort in late November was unsuccessful.
Assuming XRP closes over $0.42, it has two options: break it and extend towards the resistance zone in the area of $0.5 to $0.55 (in yellow). The second option would be that buying volume dries up, and the pair descends back to $0.31.
As long as the cryptocurrency trades between $0.3 and $0.55, the accumulating period will continue with no discernible shift.
Moving Averages:
MA20: $0.38
MA50: $0.42
MA100: $0.42
MA200: $0.39
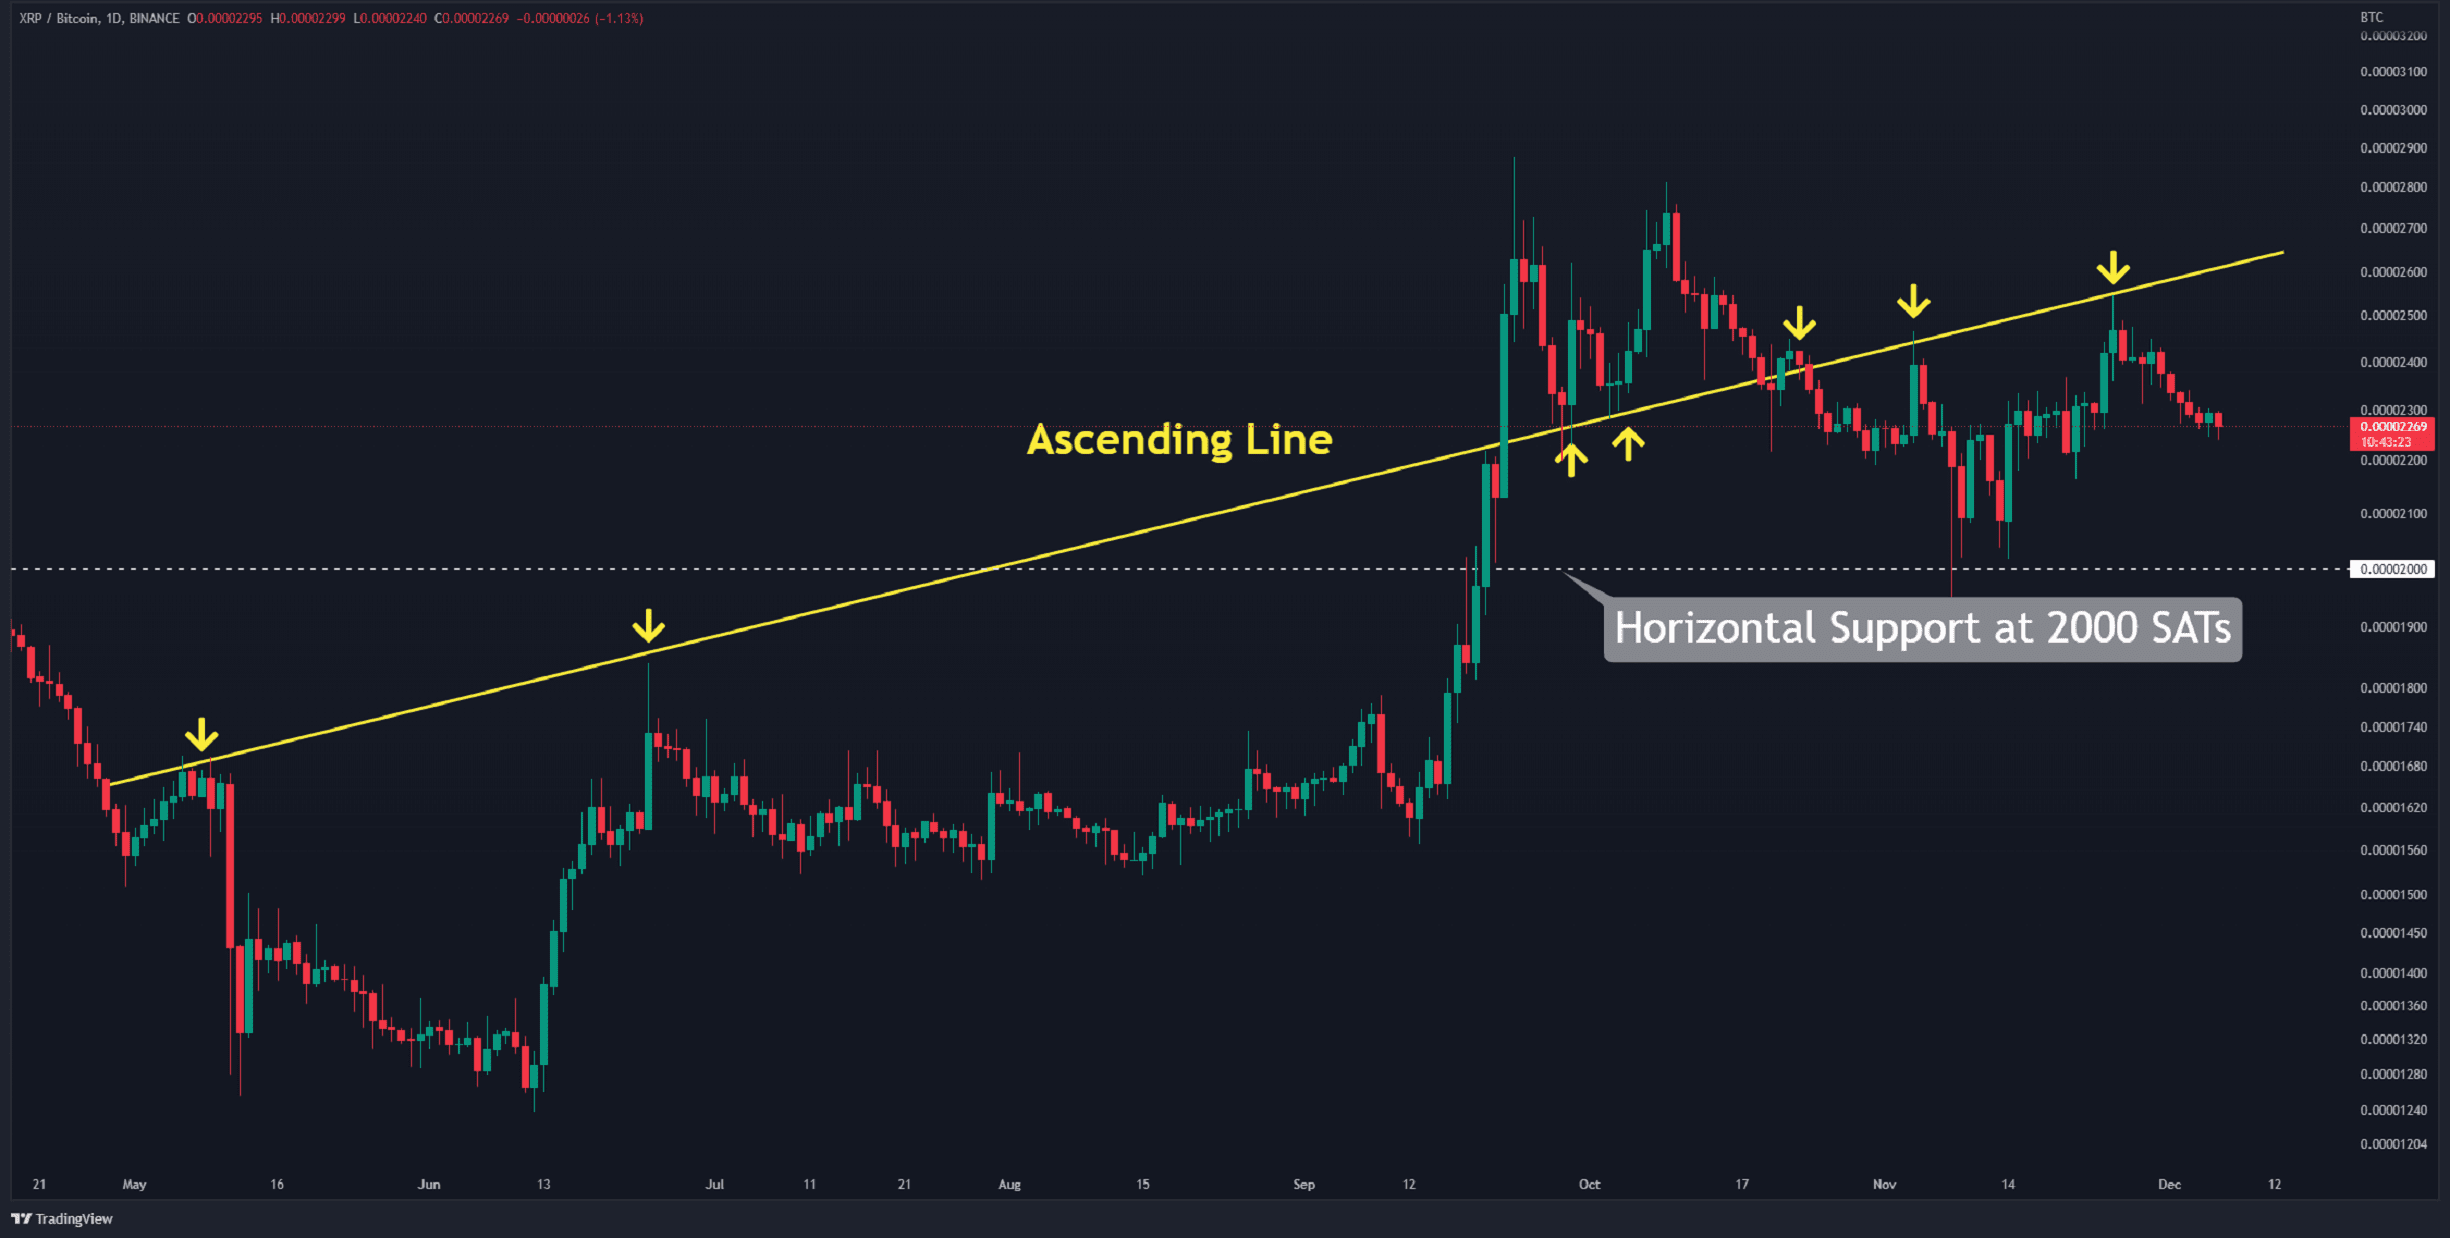
The XRP/BTC Chart:
In late November, the cryptocurrency witnessed an uptrend that lasted until the resistance of the ascending line (in yellow). Their failure to surpass it resulted in the formation of a double top.
In this chart, the most crucial support is the 2000 SATs (in white). The positive trend remains for as long as the asset trades above this level. The short-term resistance at 2500 SATs, on the other hand, is regarded as the primary barrier.
If XRP gains momentum over that level, the next target will be found at 2900 SATs.
Key Support Levels: 2000 SATS, 1800 SATs
Key Resistance Levels: 2500 SATs, 2900 SATs