Things are not looking good for XRP as its price has failed to reclaim a significant resistance level and seems likely to drop lower. The market is currently struggling to remain in a range, and it could initiate the next bearish leg down. Technical Analysis By: Edris The Daily Chart: On the daily timeframe, the price has failed to reach the %excerpt%.43 area again, as the bullish rebound is seemingly coming to an end. The 50-day moving average is currently acting as a critical resistance level around the %excerpt%.37 mark, preventing the price from rising further. The mentioned moving average has also recently crossed the 200-day one to the downside, often interpreted as a bearish signal. The market structure is hinting at a drop to the %excerpt%.3 level in the short term, which could be the
Topics:
CryptoVizArt considers the following as important: Ripple (XRP) Price, XRP Analysis, xrpbtc, xrpusd
This could be interesting, too:
Jordan Lyanchev writes Ripple’s (XRP) Surge to Triggers Over Million in Short Liquidations
Jordan Lyanchev writes Trump Confirms Work on Strategic Crypto Reserve: XRP, ADA, SOL Included
Dimitar Dzhondzhorov writes Is a Major Ripple v. SEC Lawsuit Development Expected This Week? Here’s Why
Mandy Williams writes Ripple Releases Institutional DeFi Roadmap for XRP Ledger in 2025
Things are not looking good for XRP as its price has failed to reclaim a significant resistance level and seems likely to drop lower. The market is currently struggling to remain in a range, and it could initiate the next bearish leg down.
Technical Analysis
By: Edris
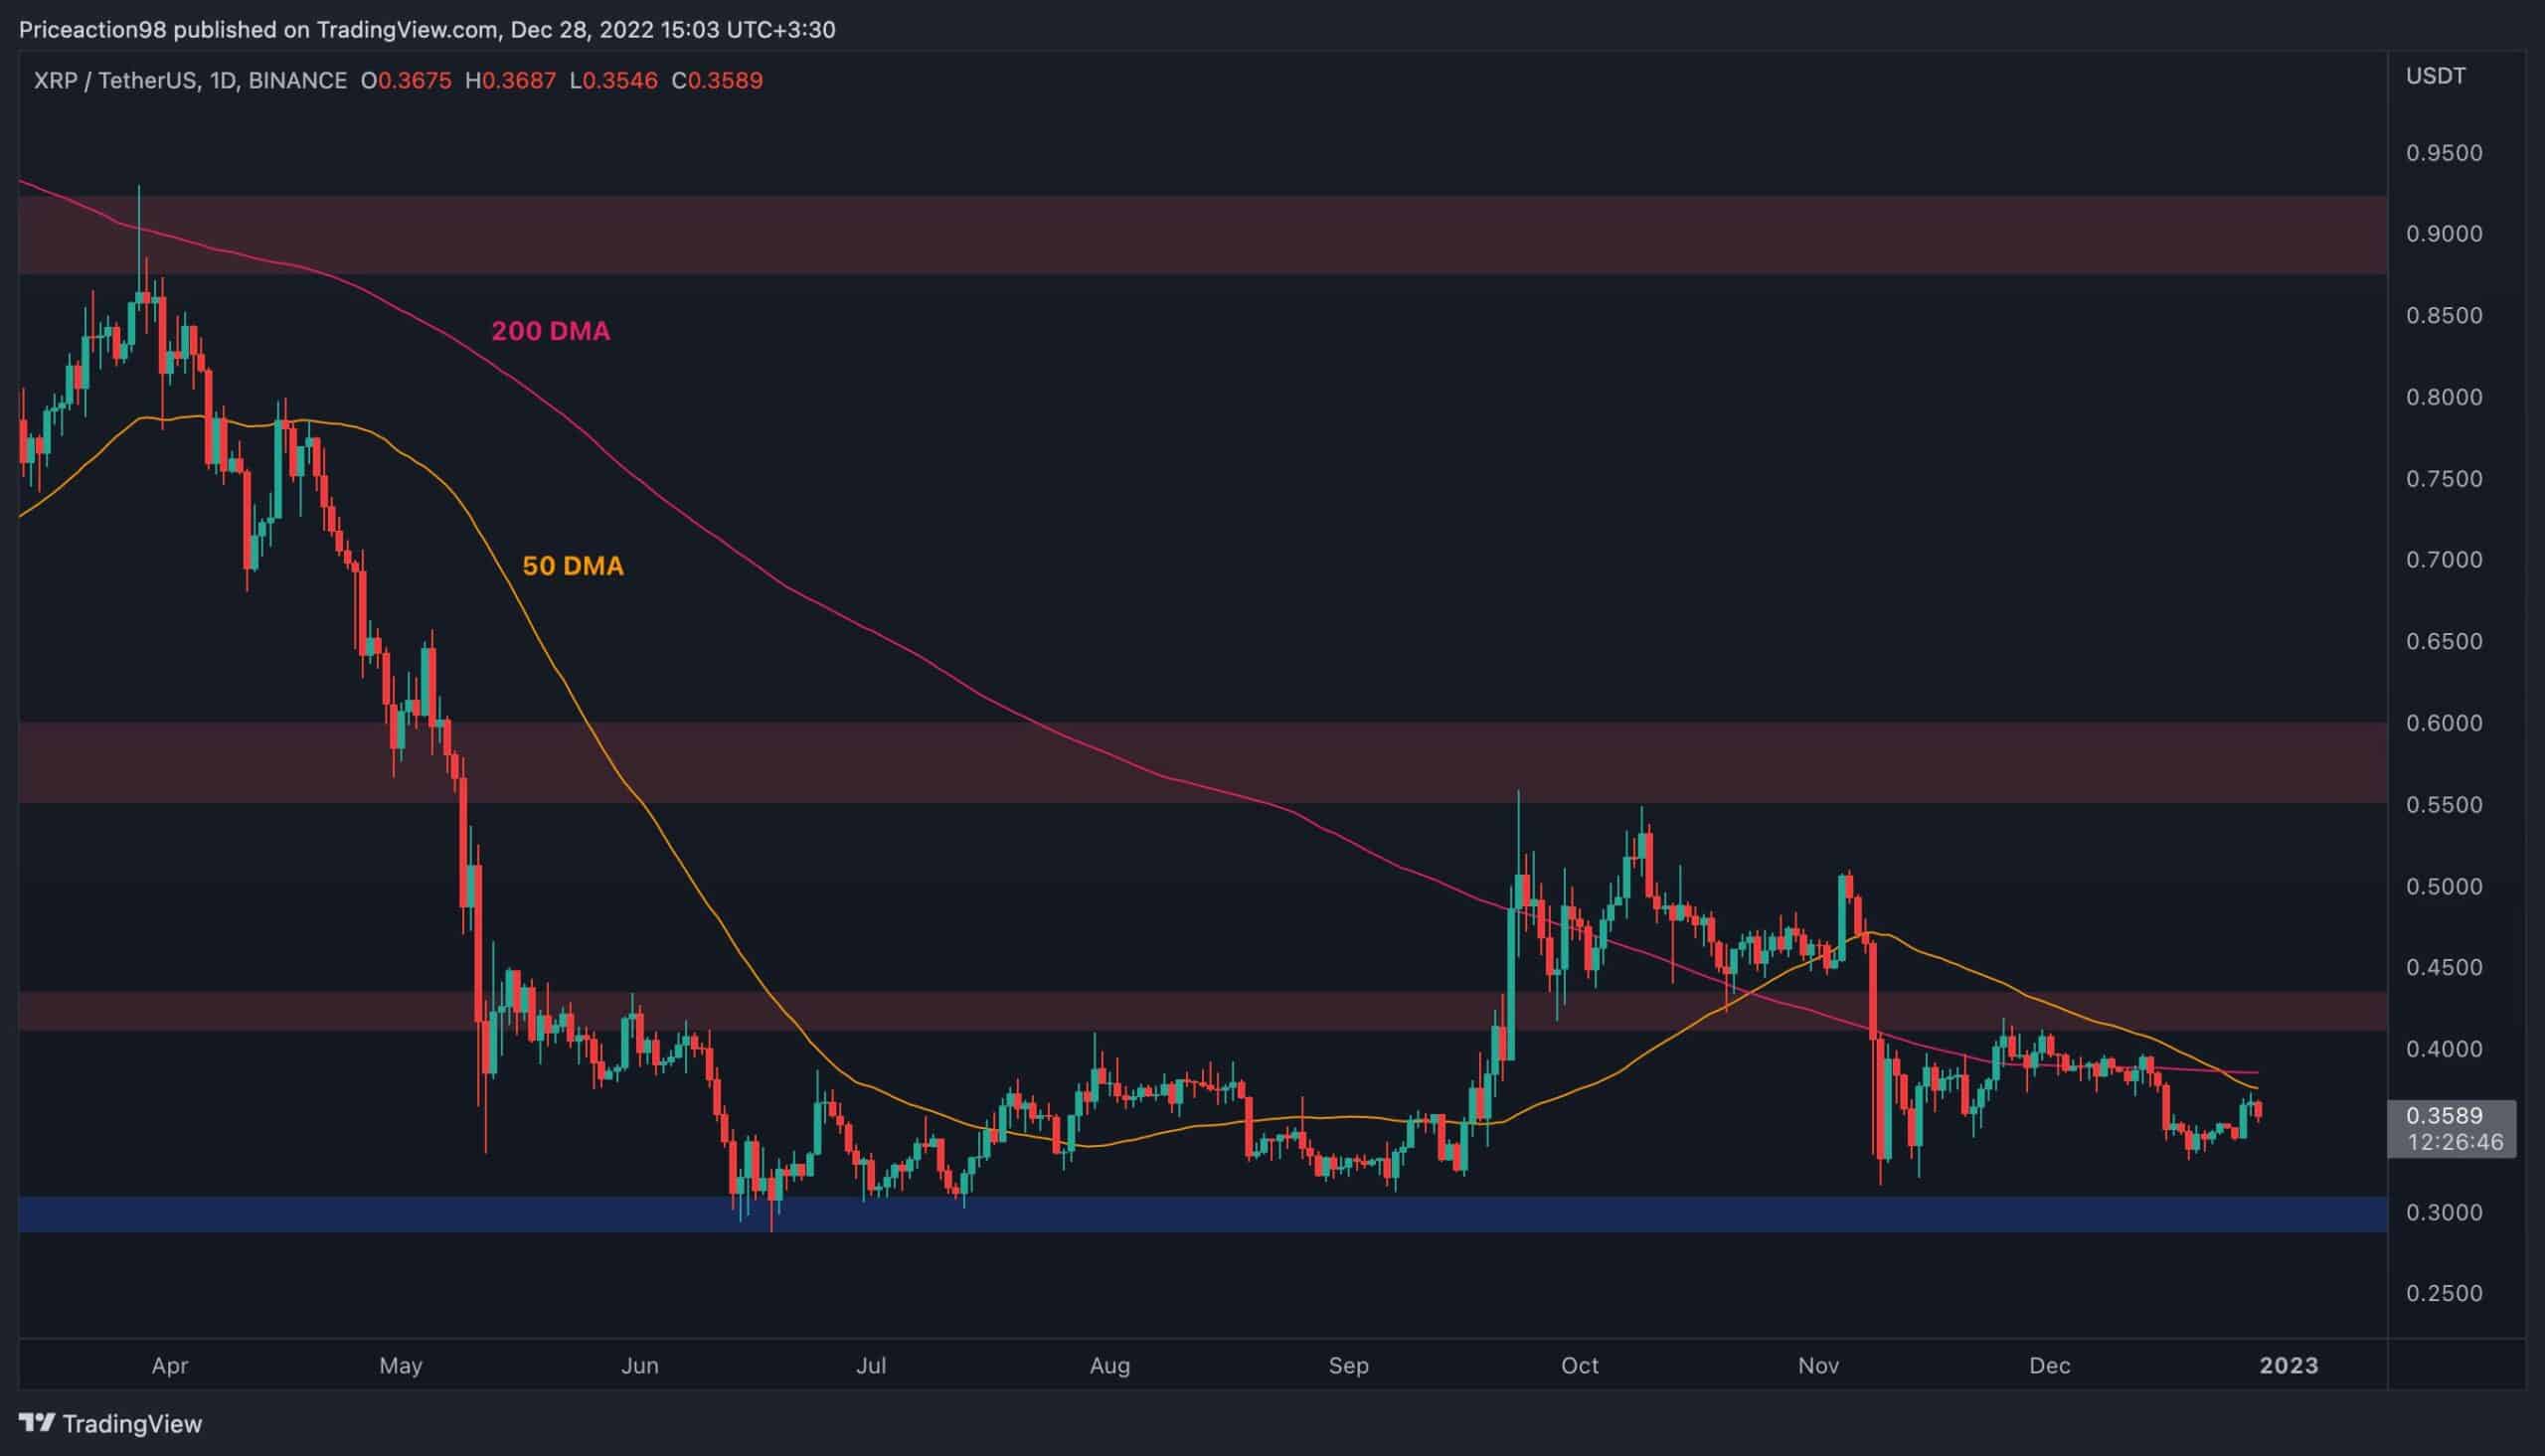
The Daily Chart:
On the daily timeframe, the price has failed to reach the $0.43 area again, as the bullish rebound is seemingly coming to an end.
The 50-day moving average is currently acting as a critical resistance level around the $0.37 mark, preventing the price from rising further.
The mentioned moving average has also recently crossed the 200-day one to the downside, often interpreted as a bearish signal. The market structure is hinting at a drop to the $0.3 level in the short term, which could be the bulls’ last resort to stop the cryptocurrency from dropping to a new lower low.
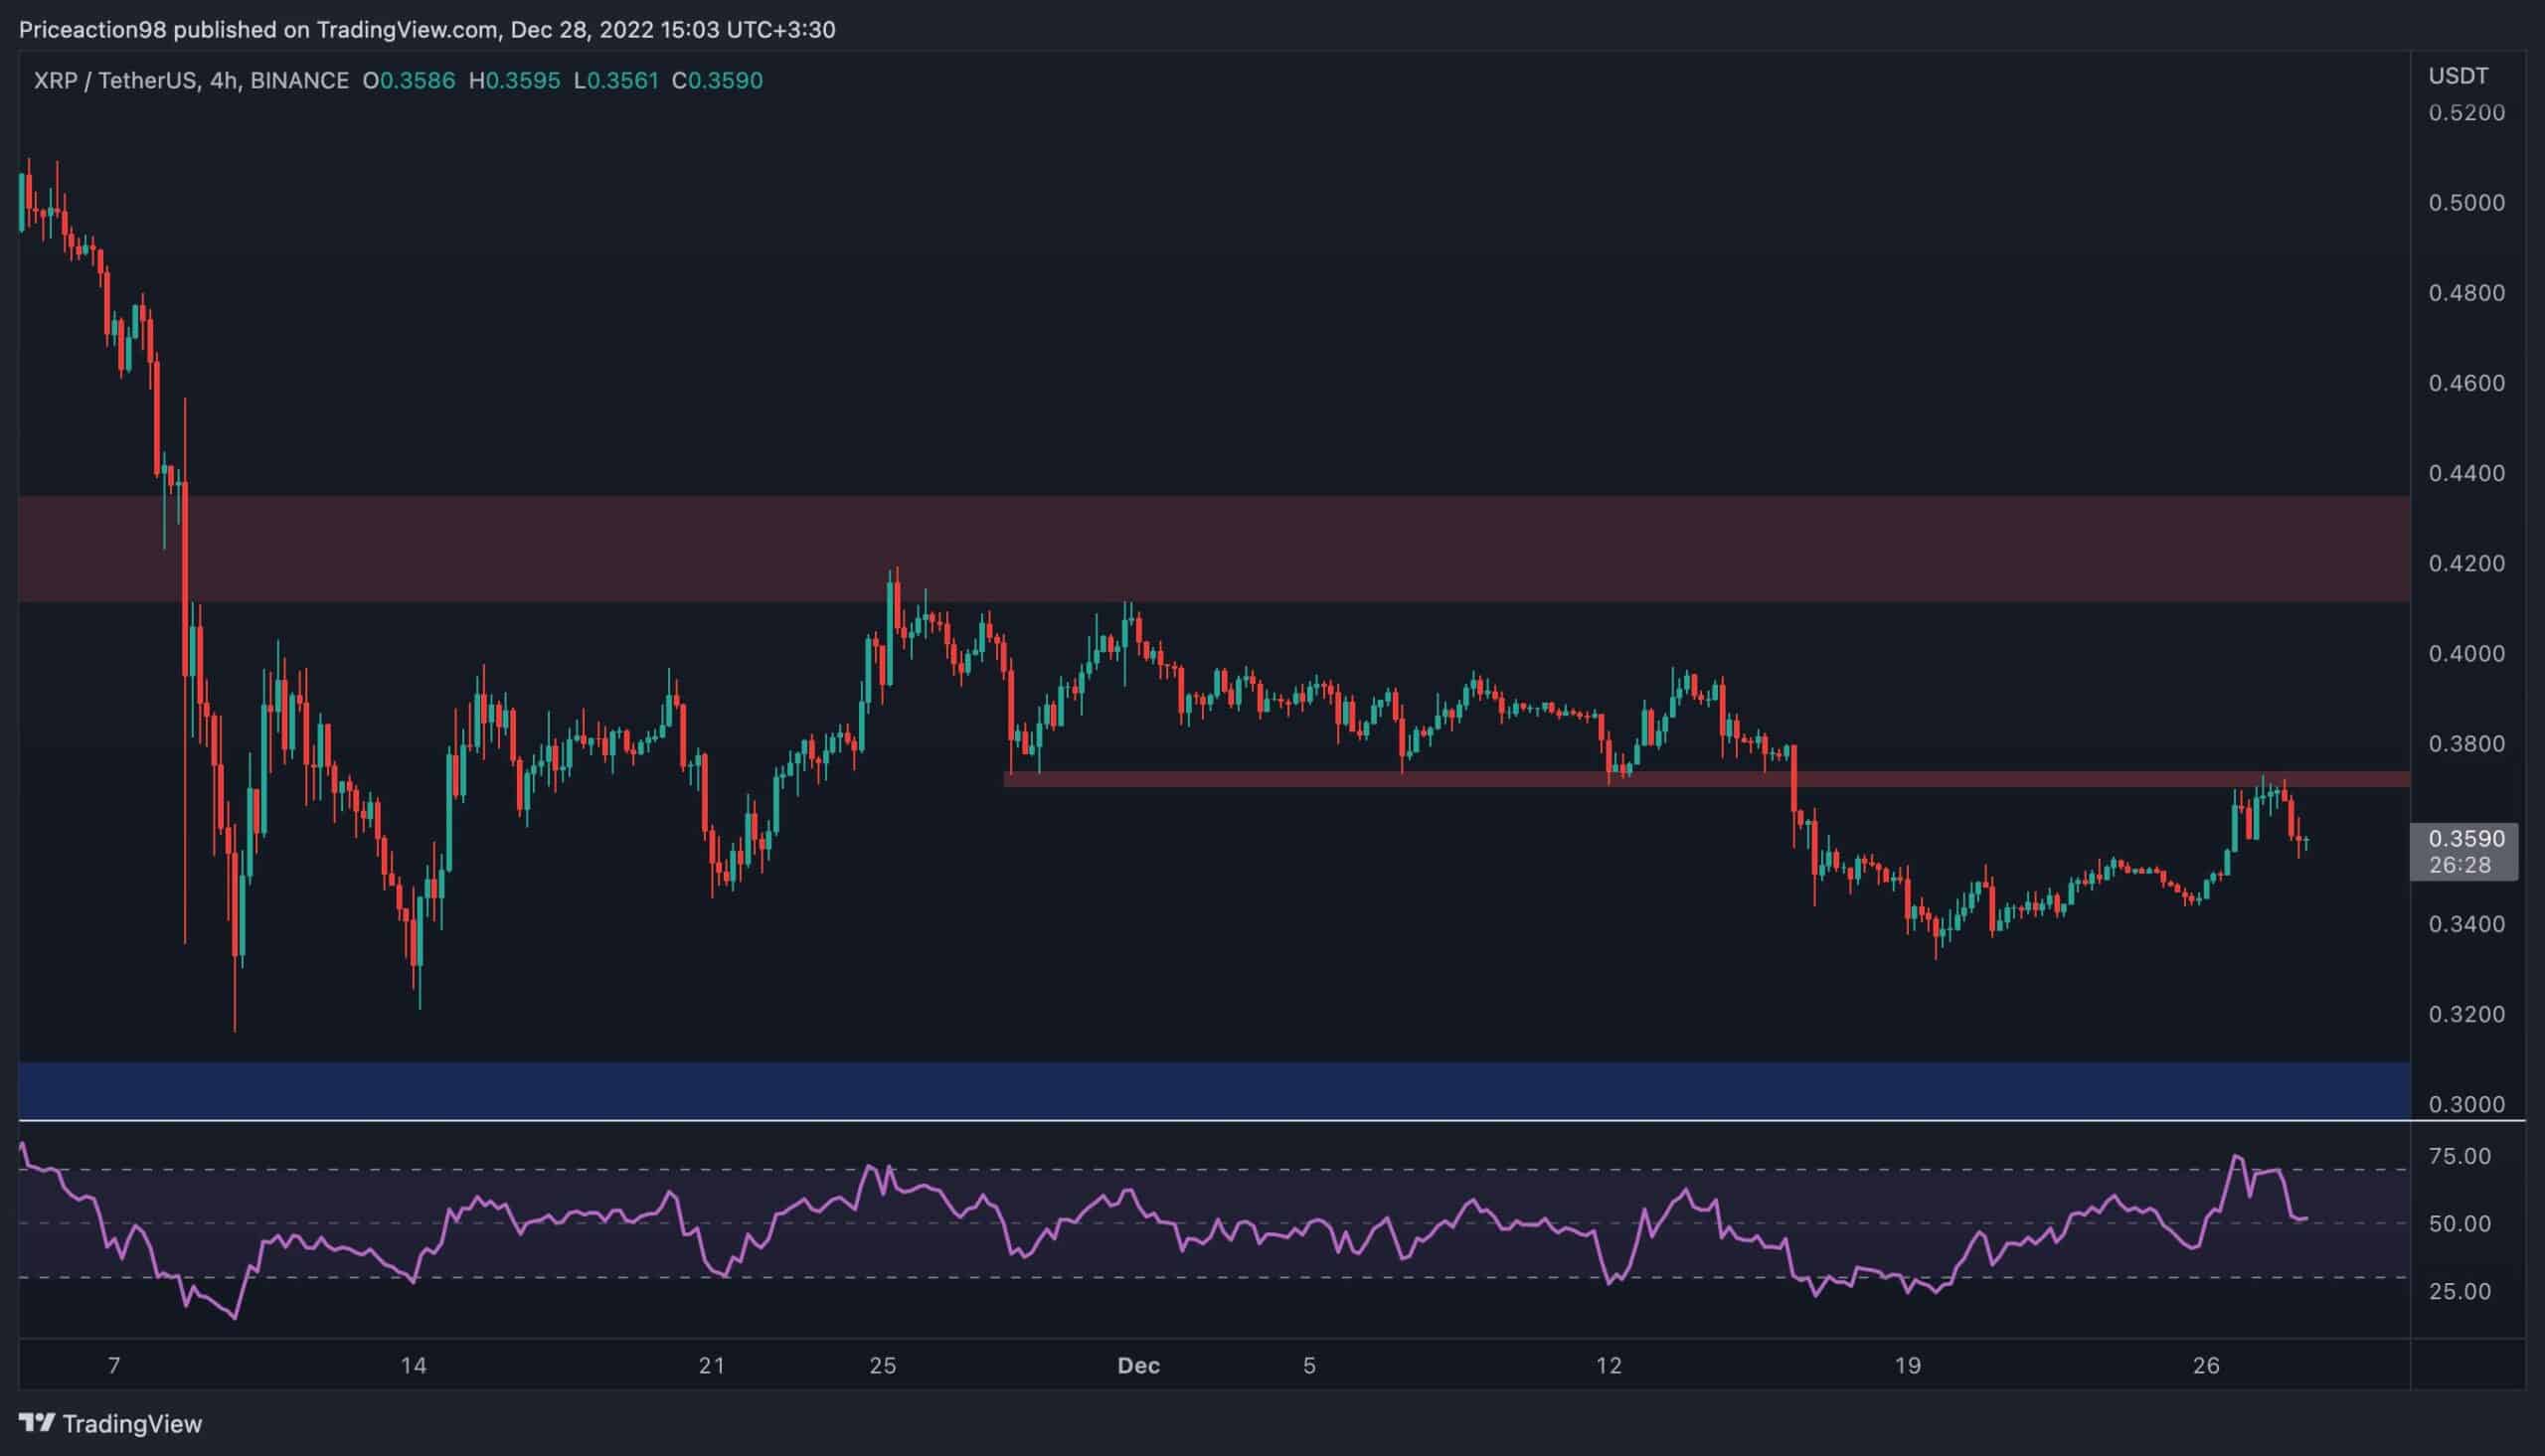
The 4-Hour Chart:
Looking at the 4-hour chart, a classic break and retest are forming, as the price has broken the $0.37 level to the downside and has retested it.
The mentioned level is rejecting the price to the downside convincingly. The RSI indicator, which suggested a likely rejection with an overbought and bearish divergence signal while the price was testing $0.37, is currently trending around the 50 mark.
A break below it would likely signal the beginning of another decline which could lead to a drop toward the $0.3 support level in the short term.