Despite several attempts to push the price above %excerpt%.50, XRP has been unsuccessful in stabilizing around this level. Technical Analysis By Grizzly The Daily Chart The cryptocurrency continues to challenge the %excerpt%.50 resistance, but, unfortunately, to no avail. It’s failed to overcome this level three times in just as many weeks. Breaking above it would position the asset to retest the descending line (in red). If it manages to clear this barrier, the price will have better chances of going towards the next resistance level in the area between %excerpt%.66 and %excerpt%.69. is projected to extend to the next resistance level in the %excerpt%.66 to %excerpt%.69 range (in yellow). However, in the opposite case – the price will likely retest the support level at %excerpt%.42 (in green). If that happens and XRP
Topics:
CryptoVizArt considers the following as important: Ripple (XRP) Price, XRP Analysis, xrpbtc, xrpusd
This could be interesting, too:
Jordan Lyanchev writes Ripple’s (XRP) Surge to Triggers Over Million in Short Liquidations
Jordan Lyanchev writes Trump Confirms Work on Strategic Crypto Reserve: XRP, ADA, SOL Included
Dimitar Dzhondzhorov writes Is a Major Ripple v. SEC Lawsuit Development Expected This Week? Here’s Why
Mandy Williams writes Ripple Releases Institutional DeFi Roadmap for XRP Ledger in 2025
Despite several attempts to push the price above $0.50, XRP has been unsuccessful in stabilizing around this level.
Technical Analysis
By Grizzly
The Daily Chart
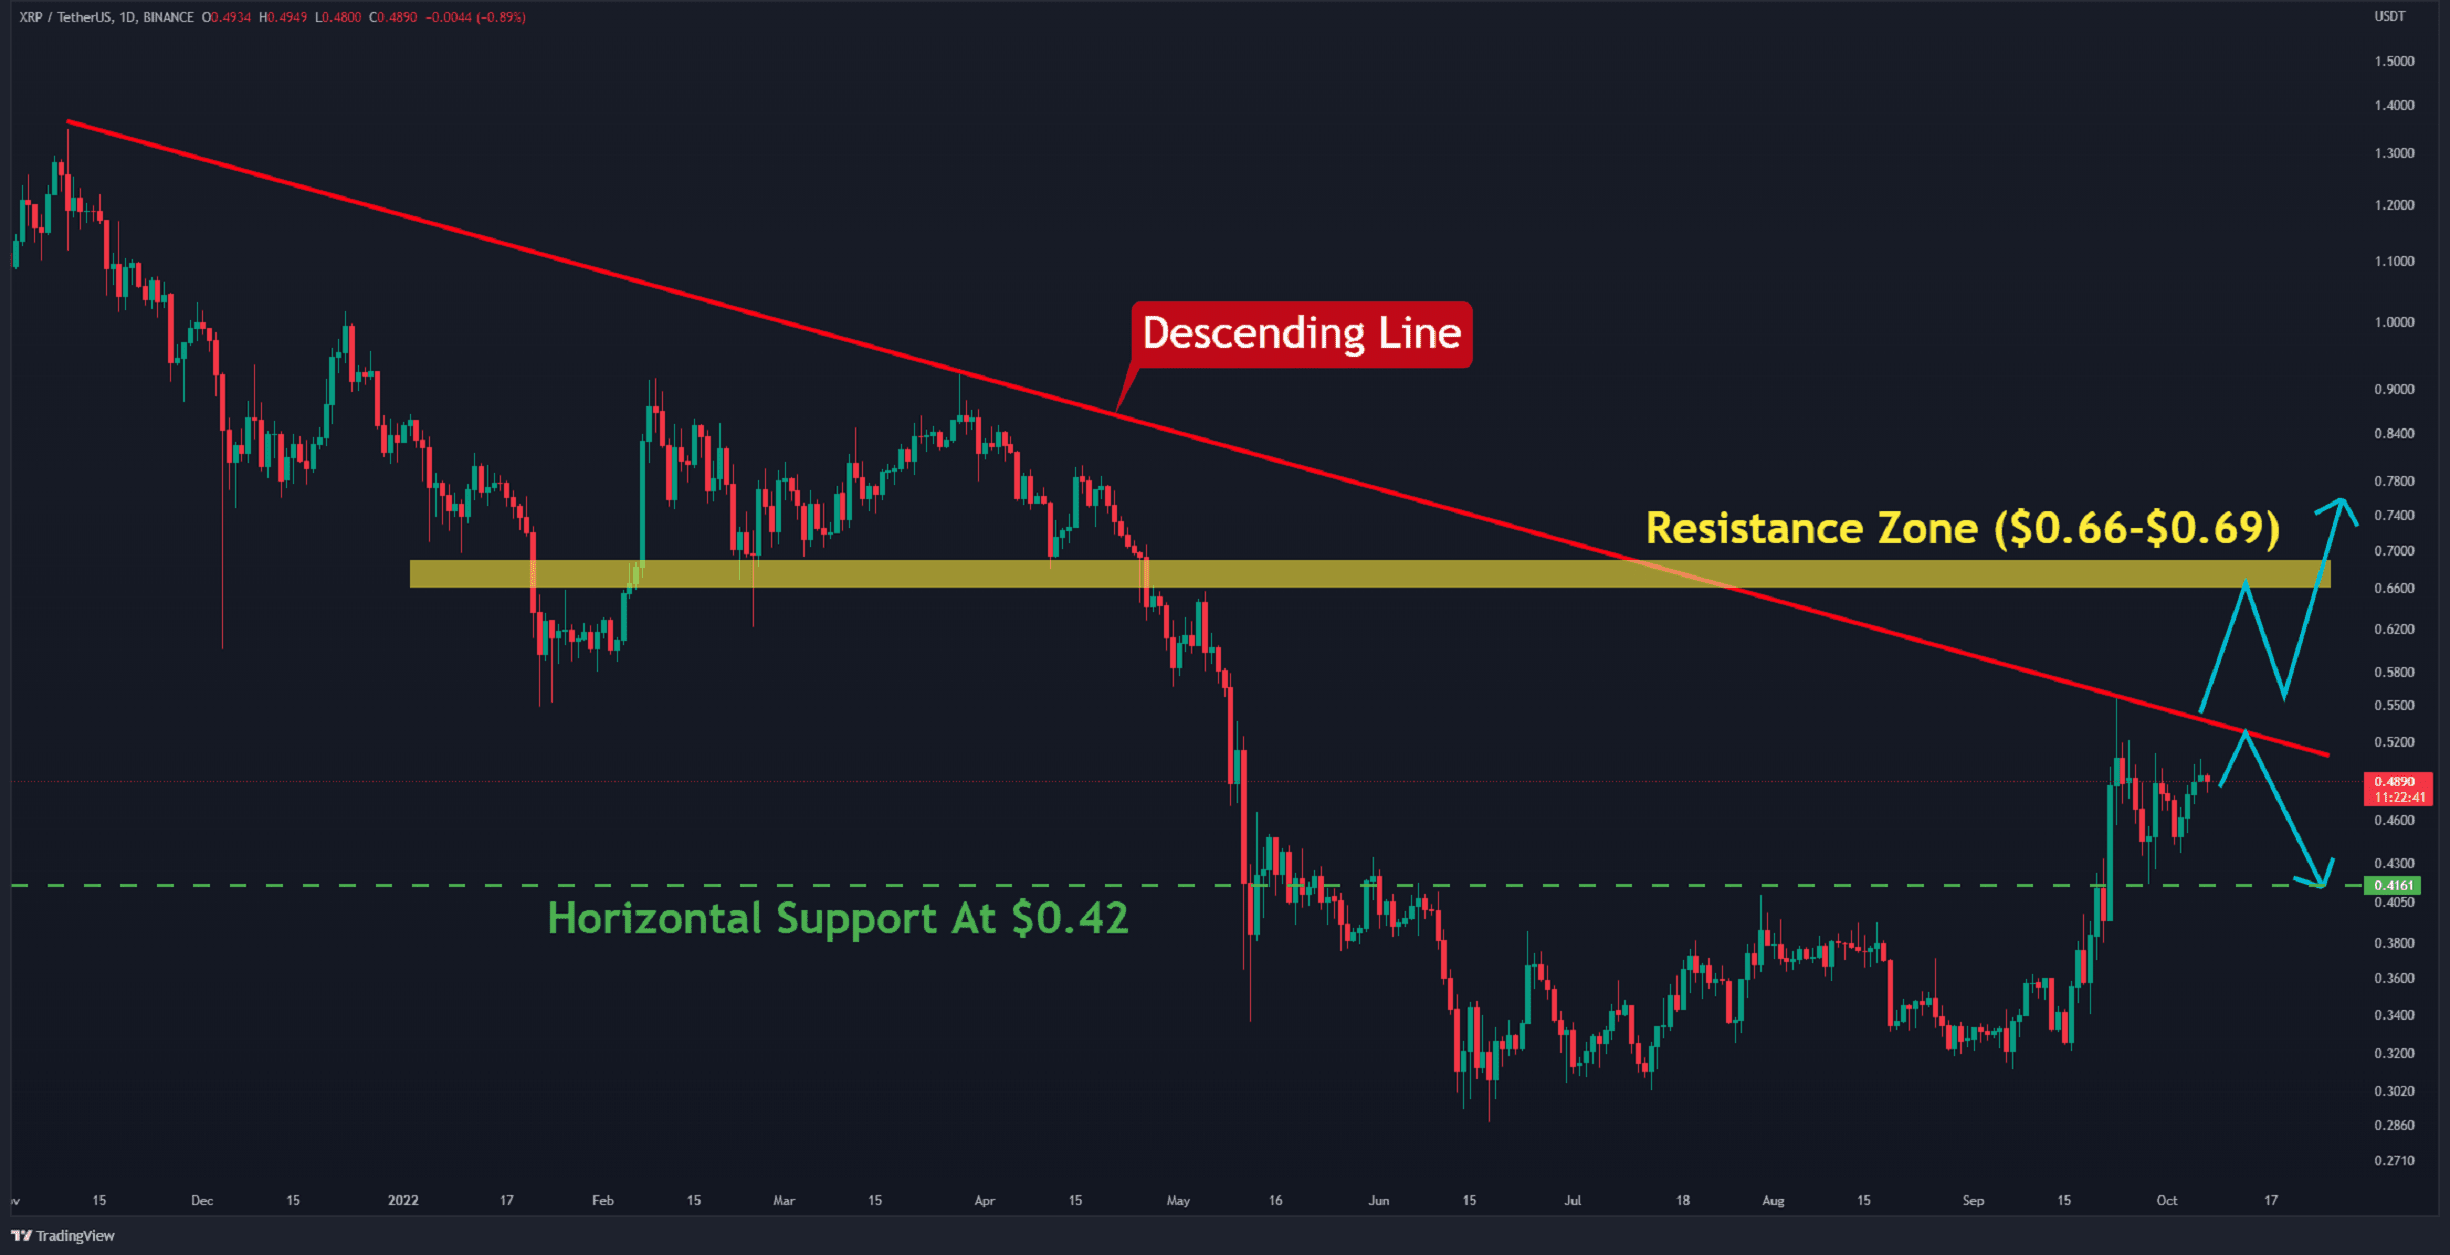
The cryptocurrency continues to challenge the $0.50 resistance, but, unfortunately, to no avail. It’s failed to overcome this level three times in just as many weeks.
Breaking above it would position the asset to retest the descending line (in red). If it manages to clear this barrier, the price will have better chances of going towards the next resistance level in the area between $0.66 and $0.69. is projected to extend to the next resistance level in the $0.66 to $0.69 range (in yellow).
However, in the opposite case – the price will likely retest the support level at $0.42 (in green). If that happens and XRP closes below it, this would amplify the bearish momentum, completely shifting the relatively positive trend as of recent.
Key Support Levels: $0.42 & $0.33
Key Resistance Levels: $0.50 & $0.66
Daily Moving Averages:
MA20: $0.45
MA50: $0.38
MA100: $0.37
MA200: $0.46
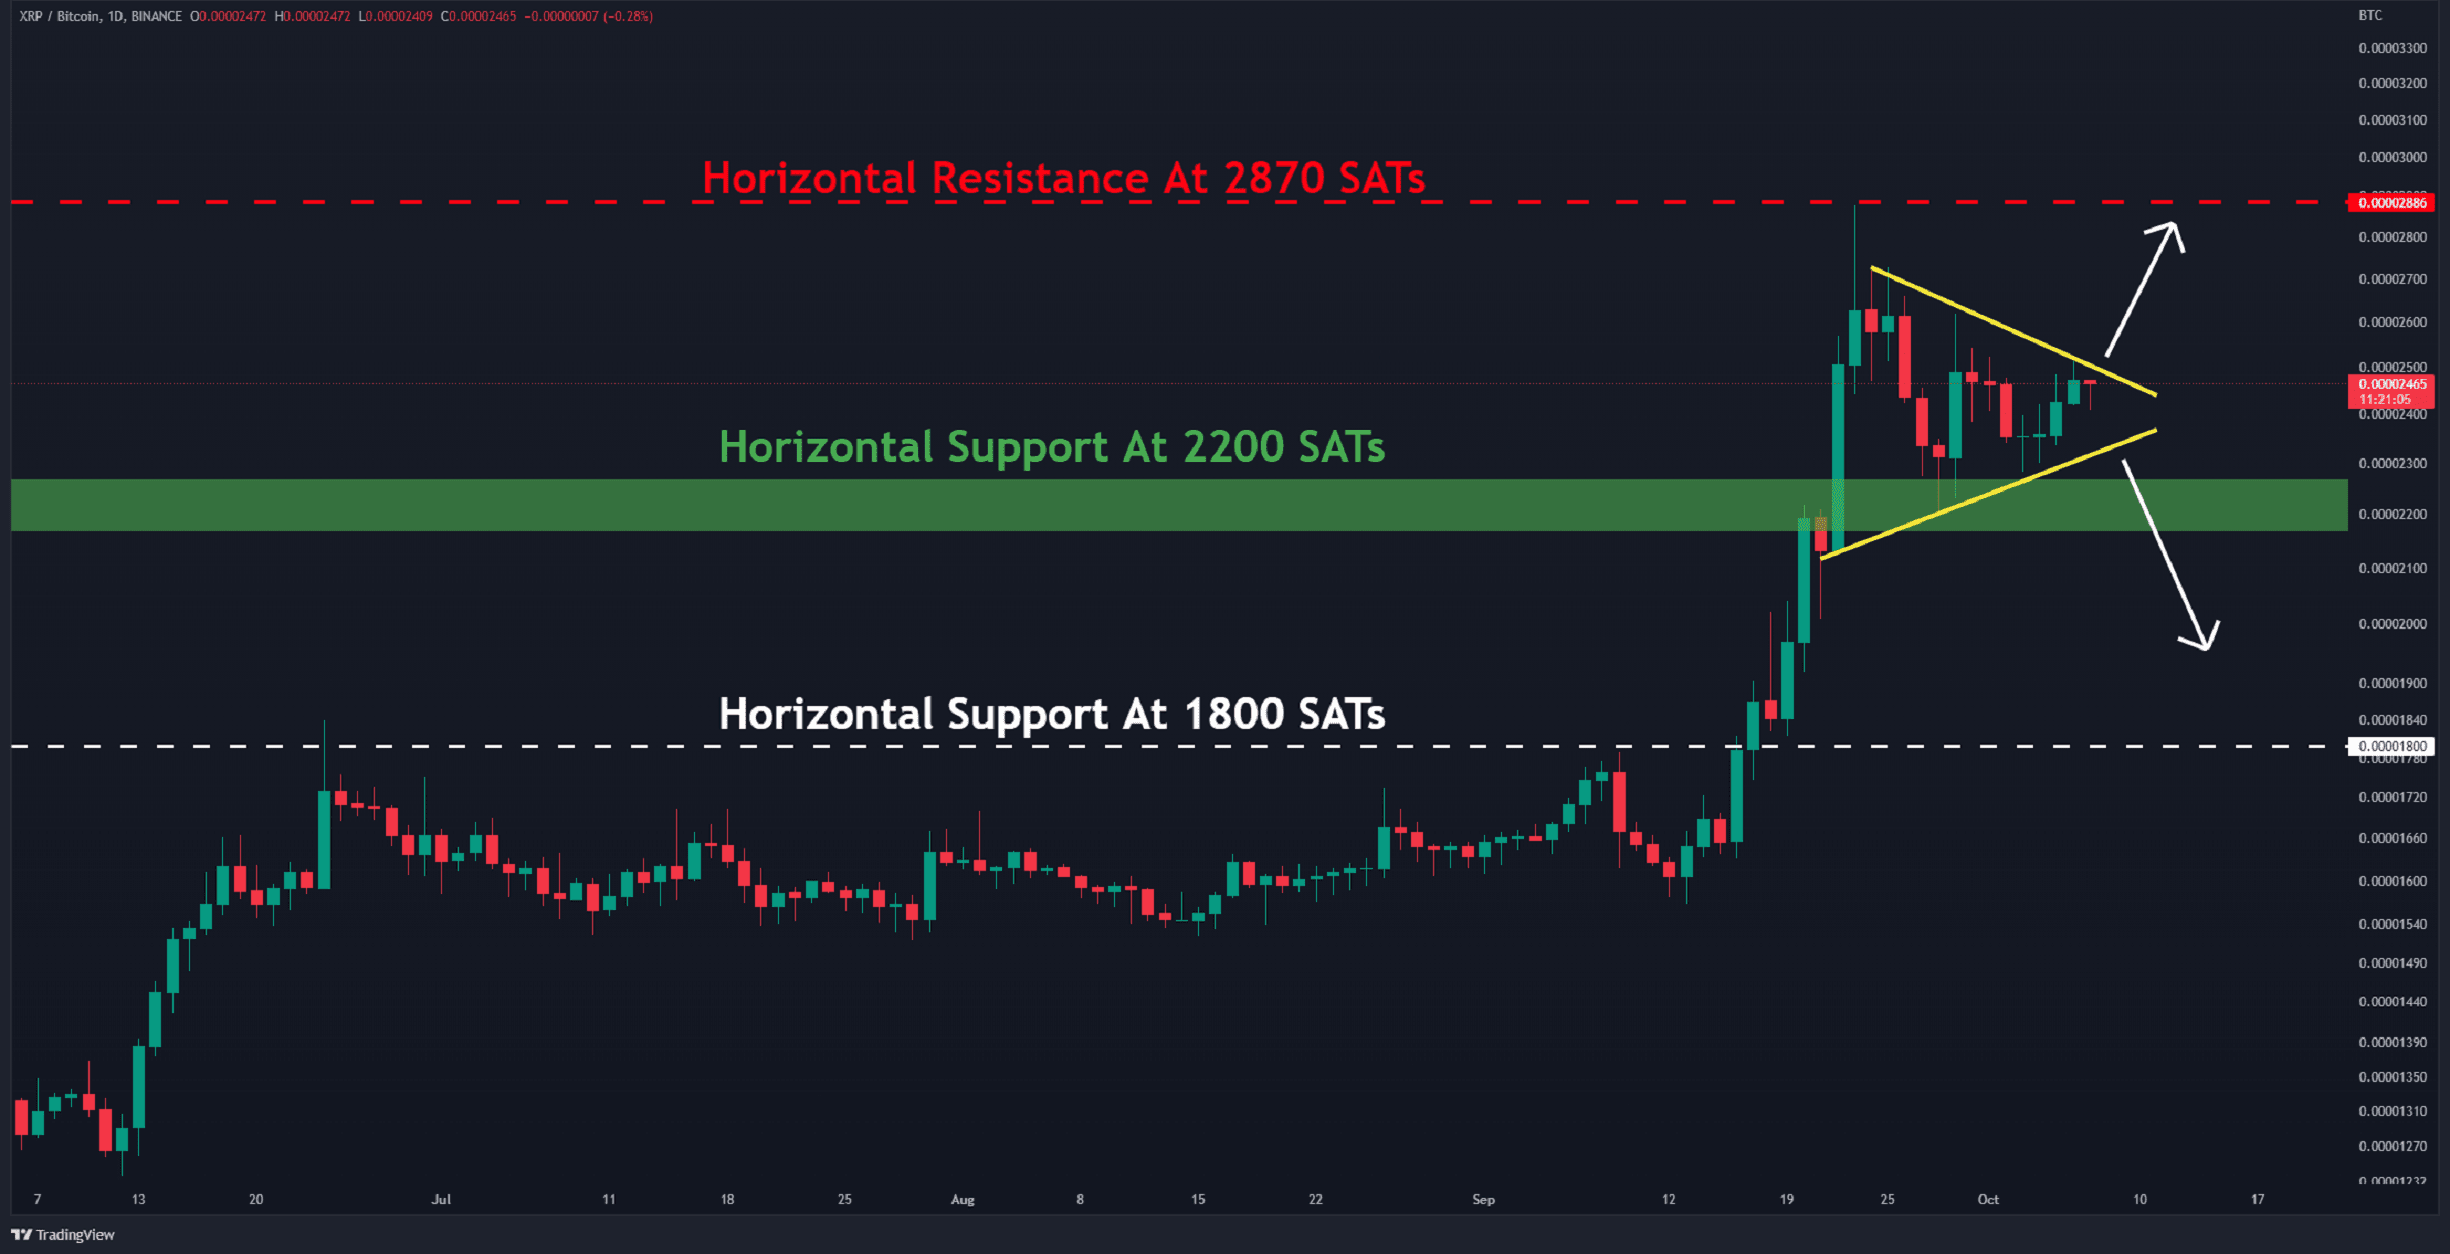
The XRP/BTC Chart
After the most recent increase towards the resistance at around 2870 SATs (in red), the cryptocurrency is now fluctuating within a symmetrical triangle (in yellow).
The next direction will likely be determined based on which side the triangle gets broken to. A break above it would position XRP for another retest of the 2870 SATs resistance leve. On the other hand, the first support lies at 2200 SATs (in green).
Key Support Levels: 2200 SATs & 1800 SATs
Key Resistance Levels: 2870 SATs & 3900 SATs