Ripple has spent the week in a tight trading range, but there is no question that the bear market rages on. The price action seems relatively quiet following the large drop XRP experienced last week. Technical Analysis By Grizzly The Daily Chart On the daily chart, the price is close to the November low. The range of %excerpt%.3 to %excerpt%.32 (in white) is currently regarded as the level of block orders, providing solid support. The 50% and 61.8% Fib levels in the %excerpt%.42 to %excerpt%.45 resistance region, which were challenged in late November, are on the upswing once more. Given that the overall structure is negative, the asset must climb over %excerpt%.45 to initiate a sustained rally. If it happens, the bearish momentum will weaken in the short term, and the cryptocurrency will be ready to test
Topics:
CryptoVizArt considers the following as important: Ripple (XRP) Price, XRP Analysis, xrpbtc, xrpusd
This could be interesting, too:
Dimitar Dzhondzhorov writes Is a Major Ripple v. SEC Lawsuit Development Expected This Week? Here’s Why
Mandy Williams writes Ripple Releases Institutional DeFi Roadmap for XRP Ledger in 2025
Dimitar Dzhondzhorov writes Ripple Whales Go on a Selling Spree: Is XRP Headed for a Further Correction?
Jordan Lyanchev writes ChatGPT and DeepSeek Analyze Ripple’s (XRP) Price Potential for 2025
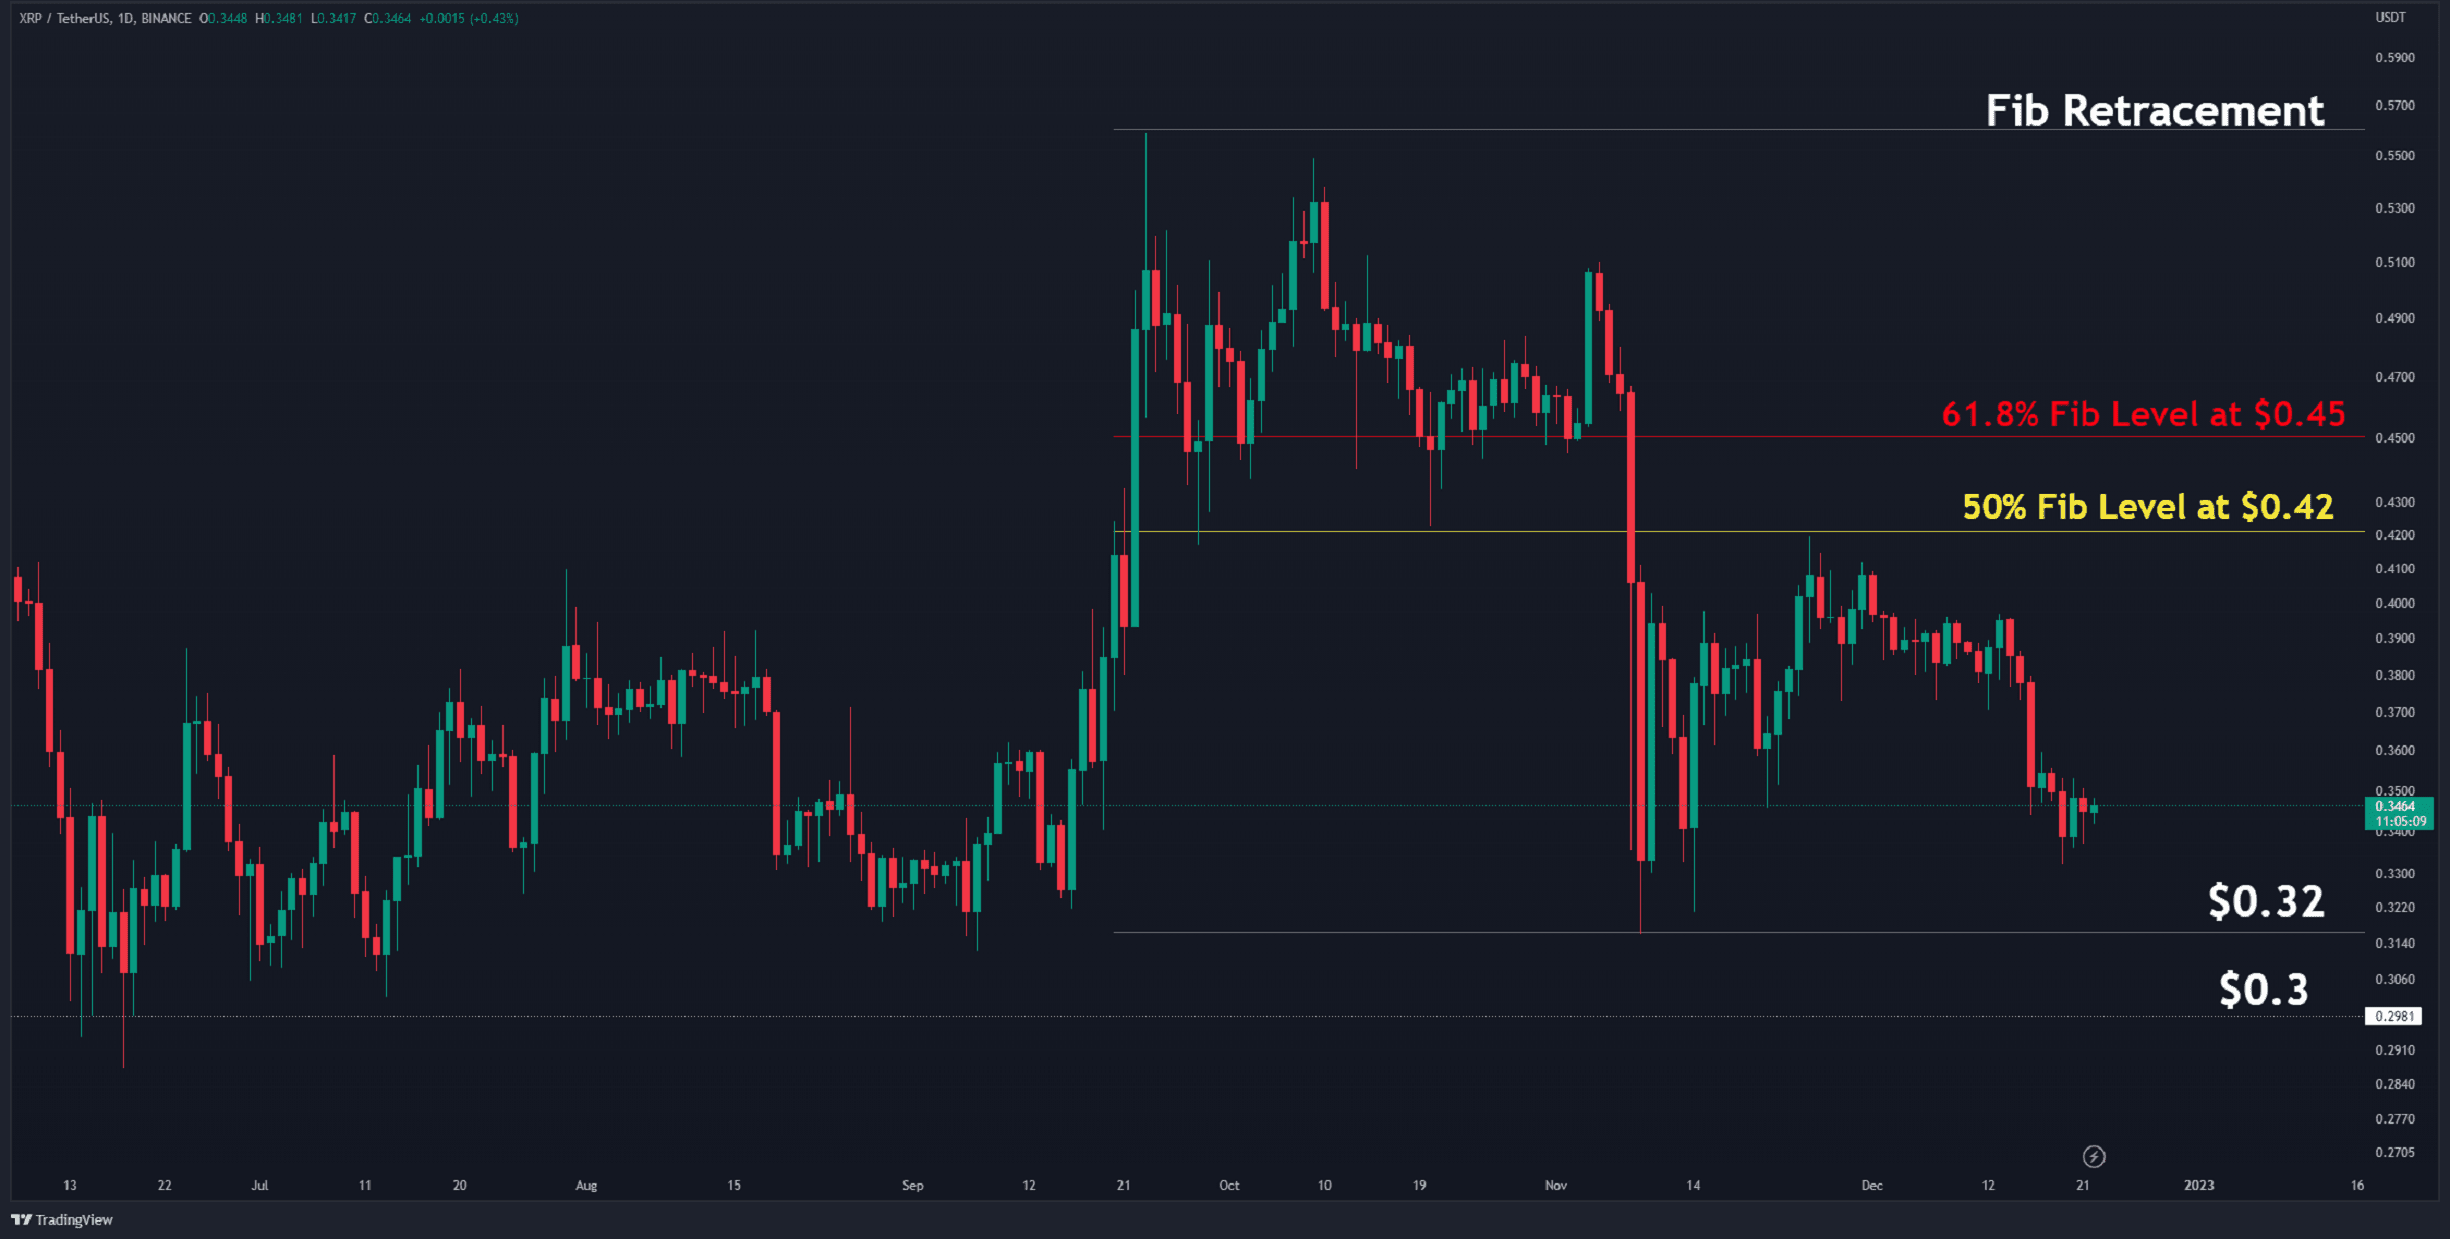
Ripple has spent the week in a tight trading range, but there is no question that the bear market rages on. The price action seems relatively quiet following the large drop XRP experienced last week.
Technical Analysis
By Grizzly
The Daily Chart
On the daily chart, the price is close to the November low. The range of $0.3 to $0.32 (in white) is currently regarded as the level of block orders, providing solid support.
The 50% and 61.8% Fib levels in the $0.42 to $0.45 resistance region, which were challenged in late November, are on the upswing once more.
Given that the overall structure is negative, the asset must climb over $0.45 to initiate a sustained rally. If it happens, the bearish momentum will weaken in the short term, and the cryptocurrency will be ready to test the long-term resistance at $0.55.
Alternatively, if the price slips below $0.3, it would become much more likely for the steep bear market to continue.
Moving Averages:
MA20: $0.37
MA50: $0.39
MA100: $0.42
MA200: $0.38
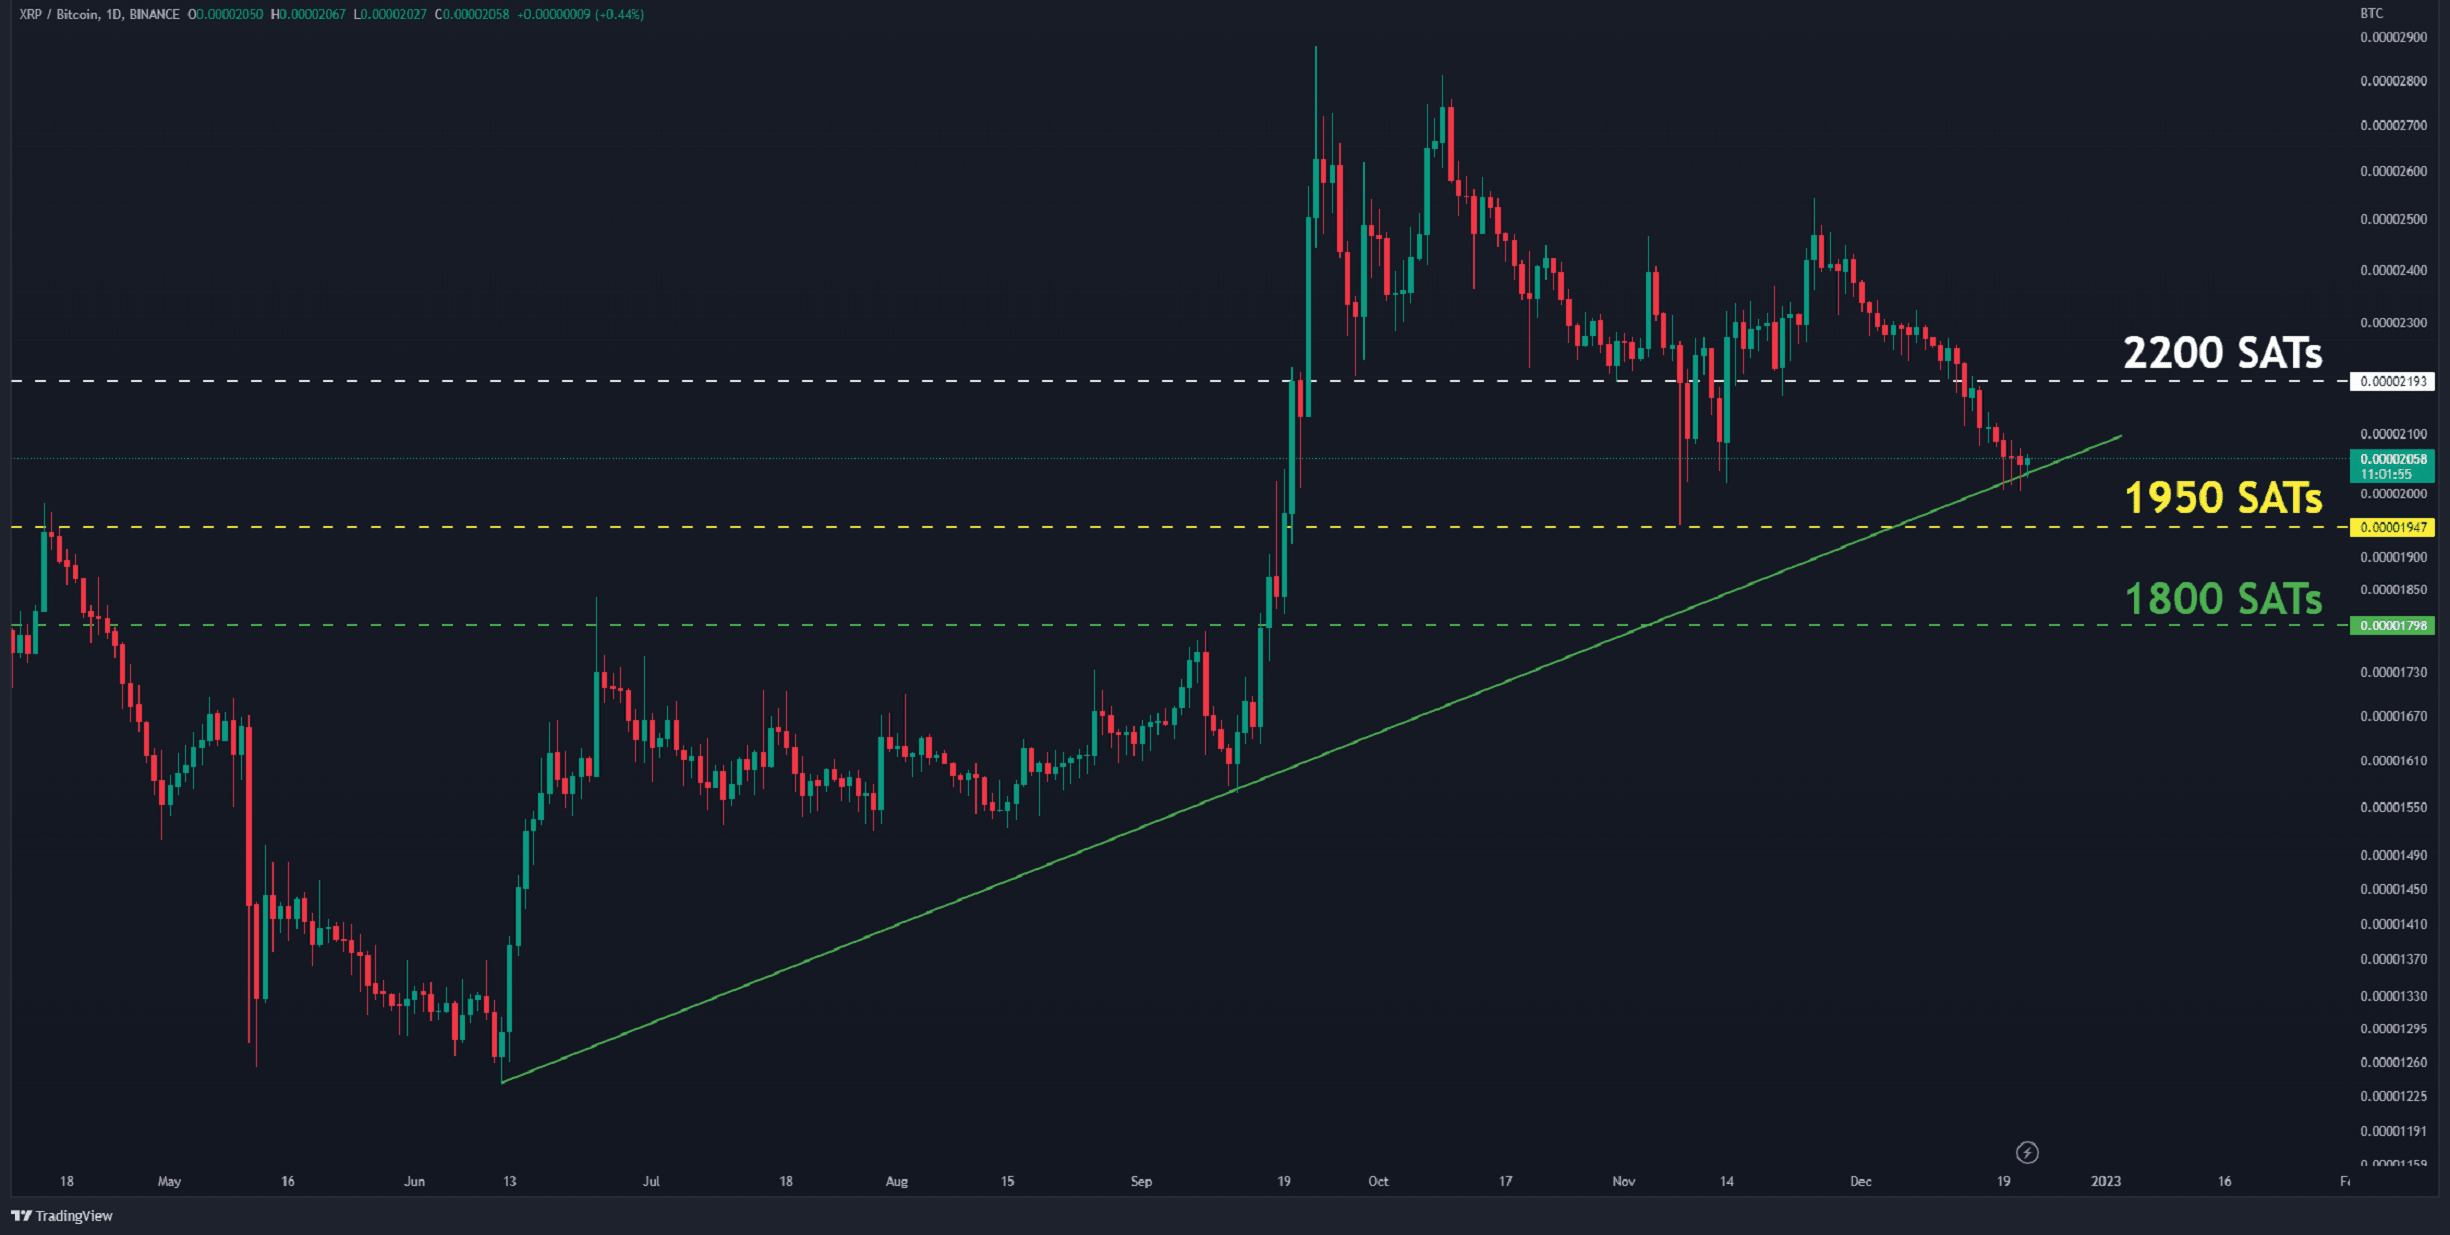
The XRP/BTC Chart
Against Bitcoin, the pair is attempting to maintain its position above the ascending line of support (in green). It is now critical not to create a lower low as the price goes below 2200 SATs (in white).
If the pair closes below 1950 SATs (in yellow), the bullish trend will reverse. The horizontal support at 1800 SATs will likely be tested in this situation.
Key Support Levels: 1950 SATS, 1800 SATs
Key Resistance Levels: 2200 SATs, 2500 SATs