Last week, Ripple closed a red candle of a whopping 42%. The bulls managed to fight back, pushing the price up at the end of the week. Will this be the end of the bearish sentiment in the short term, though? Technical Analysis By Grizzly The Daily Chart On the daily chart, XRP is moving downward in a descending channel (in yellow). Currently, the support zone (in green) at %excerpt%.33 has prevented any further price declines. To dominate the market, bulls must be able to keep the price above this area. If they succeed, XRP will be more likely to move higher towards the static resistance (in blue) at %excerpt%.55 and then %excerpt%.68. Many indicators have entered the oversold zone, and there could be a possibility of a short-term upward trend. To confirm the reversal of the momentum, the
Topics:
CryptoVizArt considers the following as important: Ripple (XRP) Price, XRP Analysis, xrpbtc, xrpusd
This could be interesting, too:
Jordan Lyanchev writes Ripple’s (XRP) Surge to Triggers Over Million in Short Liquidations
Jordan Lyanchev writes Trump Confirms Work on Strategic Crypto Reserve: XRP, ADA, SOL Included
Dimitar Dzhondzhorov writes Is a Major Ripple v. SEC Lawsuit Development Expected This Week? Here’s Why
Mandy Williams writes Ripple Releases Institutional DeFi Roadmap for XRP Ledger in 2025
Last week, Ripple closed a red candle of a whopping 42%. The bulls managed to fight back, pushing the price up at the end of the week. Will this be the end of the bearish sentiment in the short term, though?
Technical Analysis
By Grizzly
The Daily Chart
On the daily chart, XRP is moving downward in a descending channel (in yellow). Currently, the support zone (in green) at $0.33 has prevented any further price declines. To dominate the market, bulls must be able to keep the price above this area. If they succeed, XRP will be more likely to move higher towards the static resistance (in blue) at $0.55 and then $0.68.
Many indicators have entered the oversold zone, and there could be a possibility of a short-term upward trend. To confirm the reversal of the momentum, the price must form a higher high and a higher low. The bulls need to take the price up to $0.65 to confirm a bullish structure.
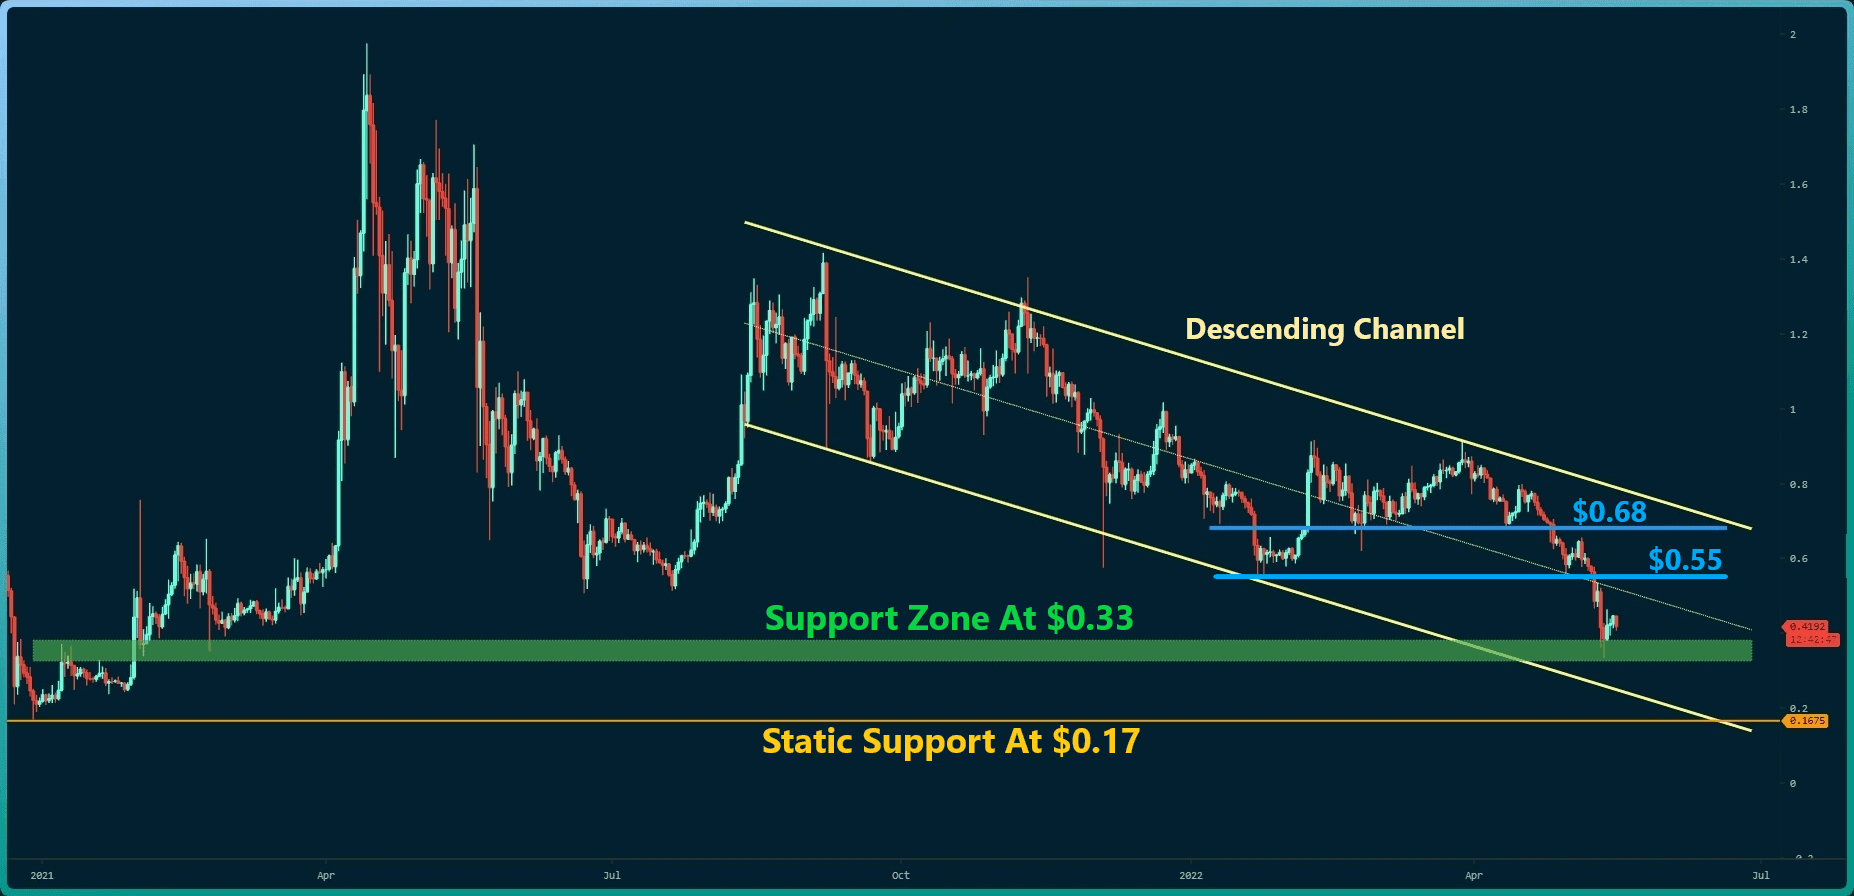
Key Support Levels: $0.33 & $0.17
Key Resistance Levels: $0.55 & $0.68
Moving Averages:
MA20: $0.54
MA50: $0.67
MA100: $0.73
MA200: $0.80
The 4-Hour Chart
The structure taking shape in the 4-hour timeframe can be considered bullish if Ripple can form a higher high above the resistance zone outlined in red. The last ascending wave, however, appears weak, which could mean that retesting $0.33 might not be out of the question yet.
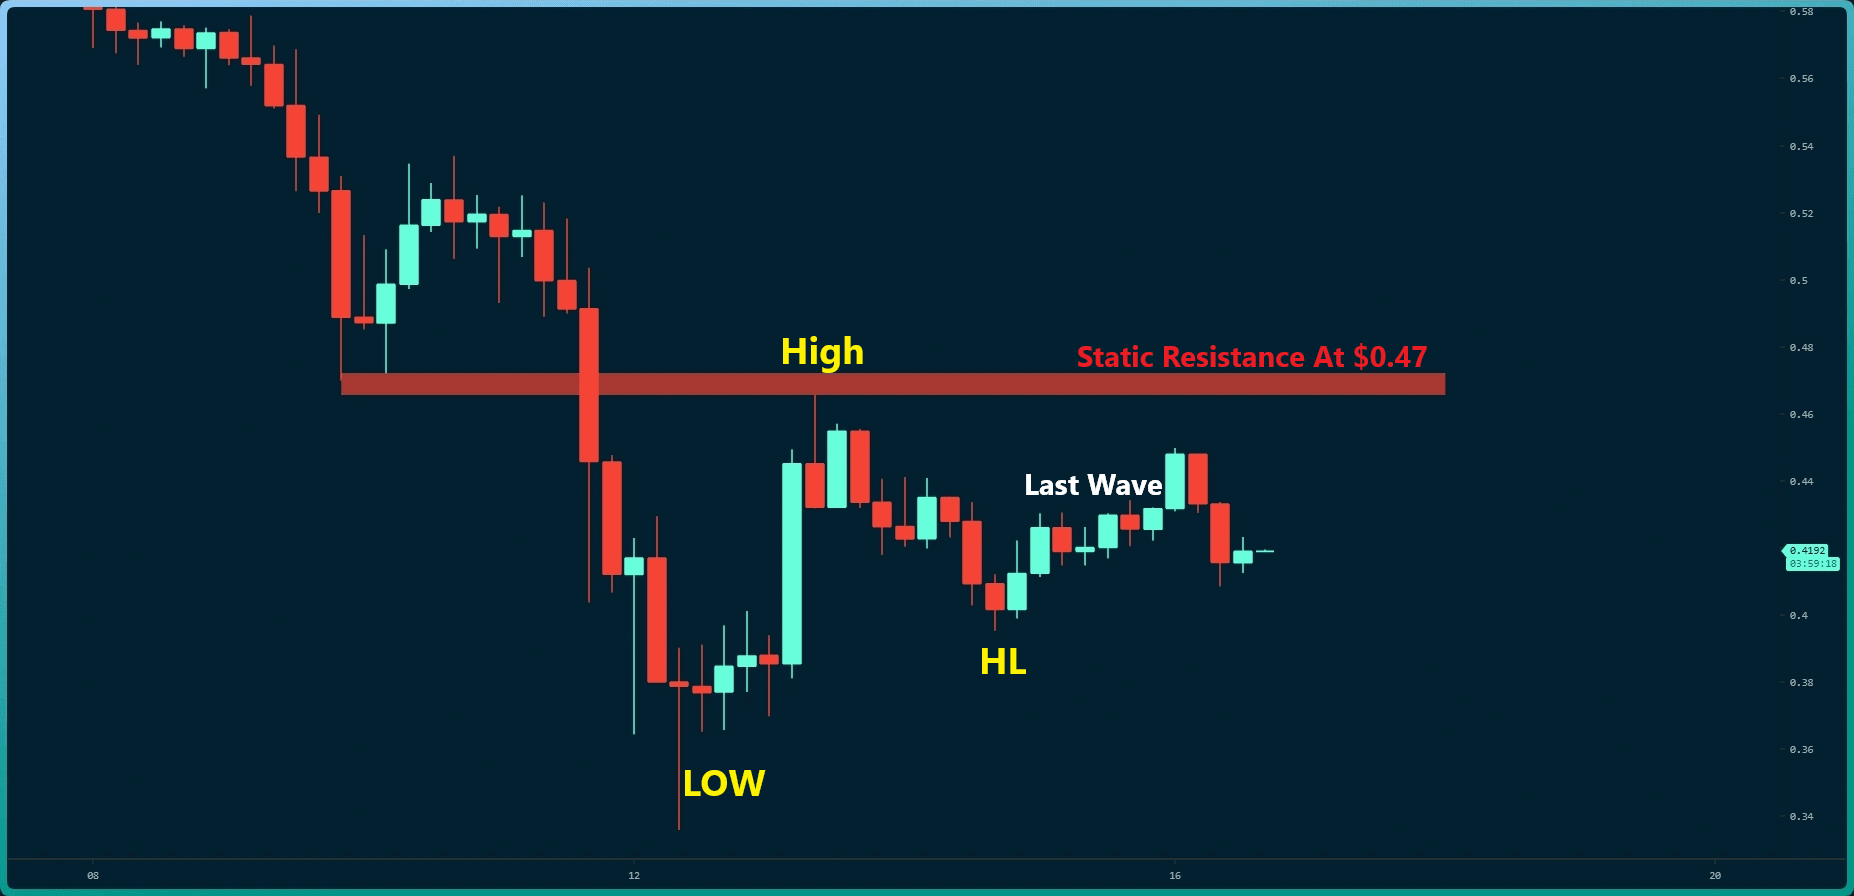
In addition, it should be noted that the red resistance zone intersects with a thick Ichimoku cloud, which makes it difficult for bulls to break through.