Ripple’s price is facing some technical challenges on the way up. It did not live up to expectations, and the recent positive news failed to help much in pushing the price up. The volume is still low, and it seems that investors’ confidence has not been attracted yet. Technical Analysis The Daily Chart: Technical Analysis By Grizzly There are two main trend lines on the daily chart that have accompanied the price since the Covid Crash. The yellow trend line has now become resistance, and the blue one is playing as the dynamic support. But the main challenge right now is the resistance at , which is the confluence of different supply zones and indicators. Breaking this resistance seems to be difficult, and Ripple needs a stronger catalyst than the news to overcome this
Topics:
CryptoVizArt considers the following as important: Ripple (XRP) Price, XRP Analysis, xrpbtc, xrpusd
This could be interesting, too:
Jordan Lyanchev writes Ripple’s (XRP) Surge to Triggers Over Million in Short Liquidations
Jordan Lyanchev writes Trump Confirms Work on Strategic Crypto Reserve: XRP, ADA, SOL Included
Dimitar Dzhondzhorov writes Is a Major Ripple v. SEC Lawsuit Development Expected This Week? Here’s Why
Mandy Williams writes Ripple Releases Institutional DeFi Roadmap for XRP Ledger in 2025
Ripple’s price is facing some technical challenges on the way up. It did not live up to expectations, and the recent positive news failed to help much in pushing the price up. The volume is still low, and it seems that investors’ confidence has not been attracted yet.
Technical Analysis
The Daily Chart:
Technical Analysis By Grizzly
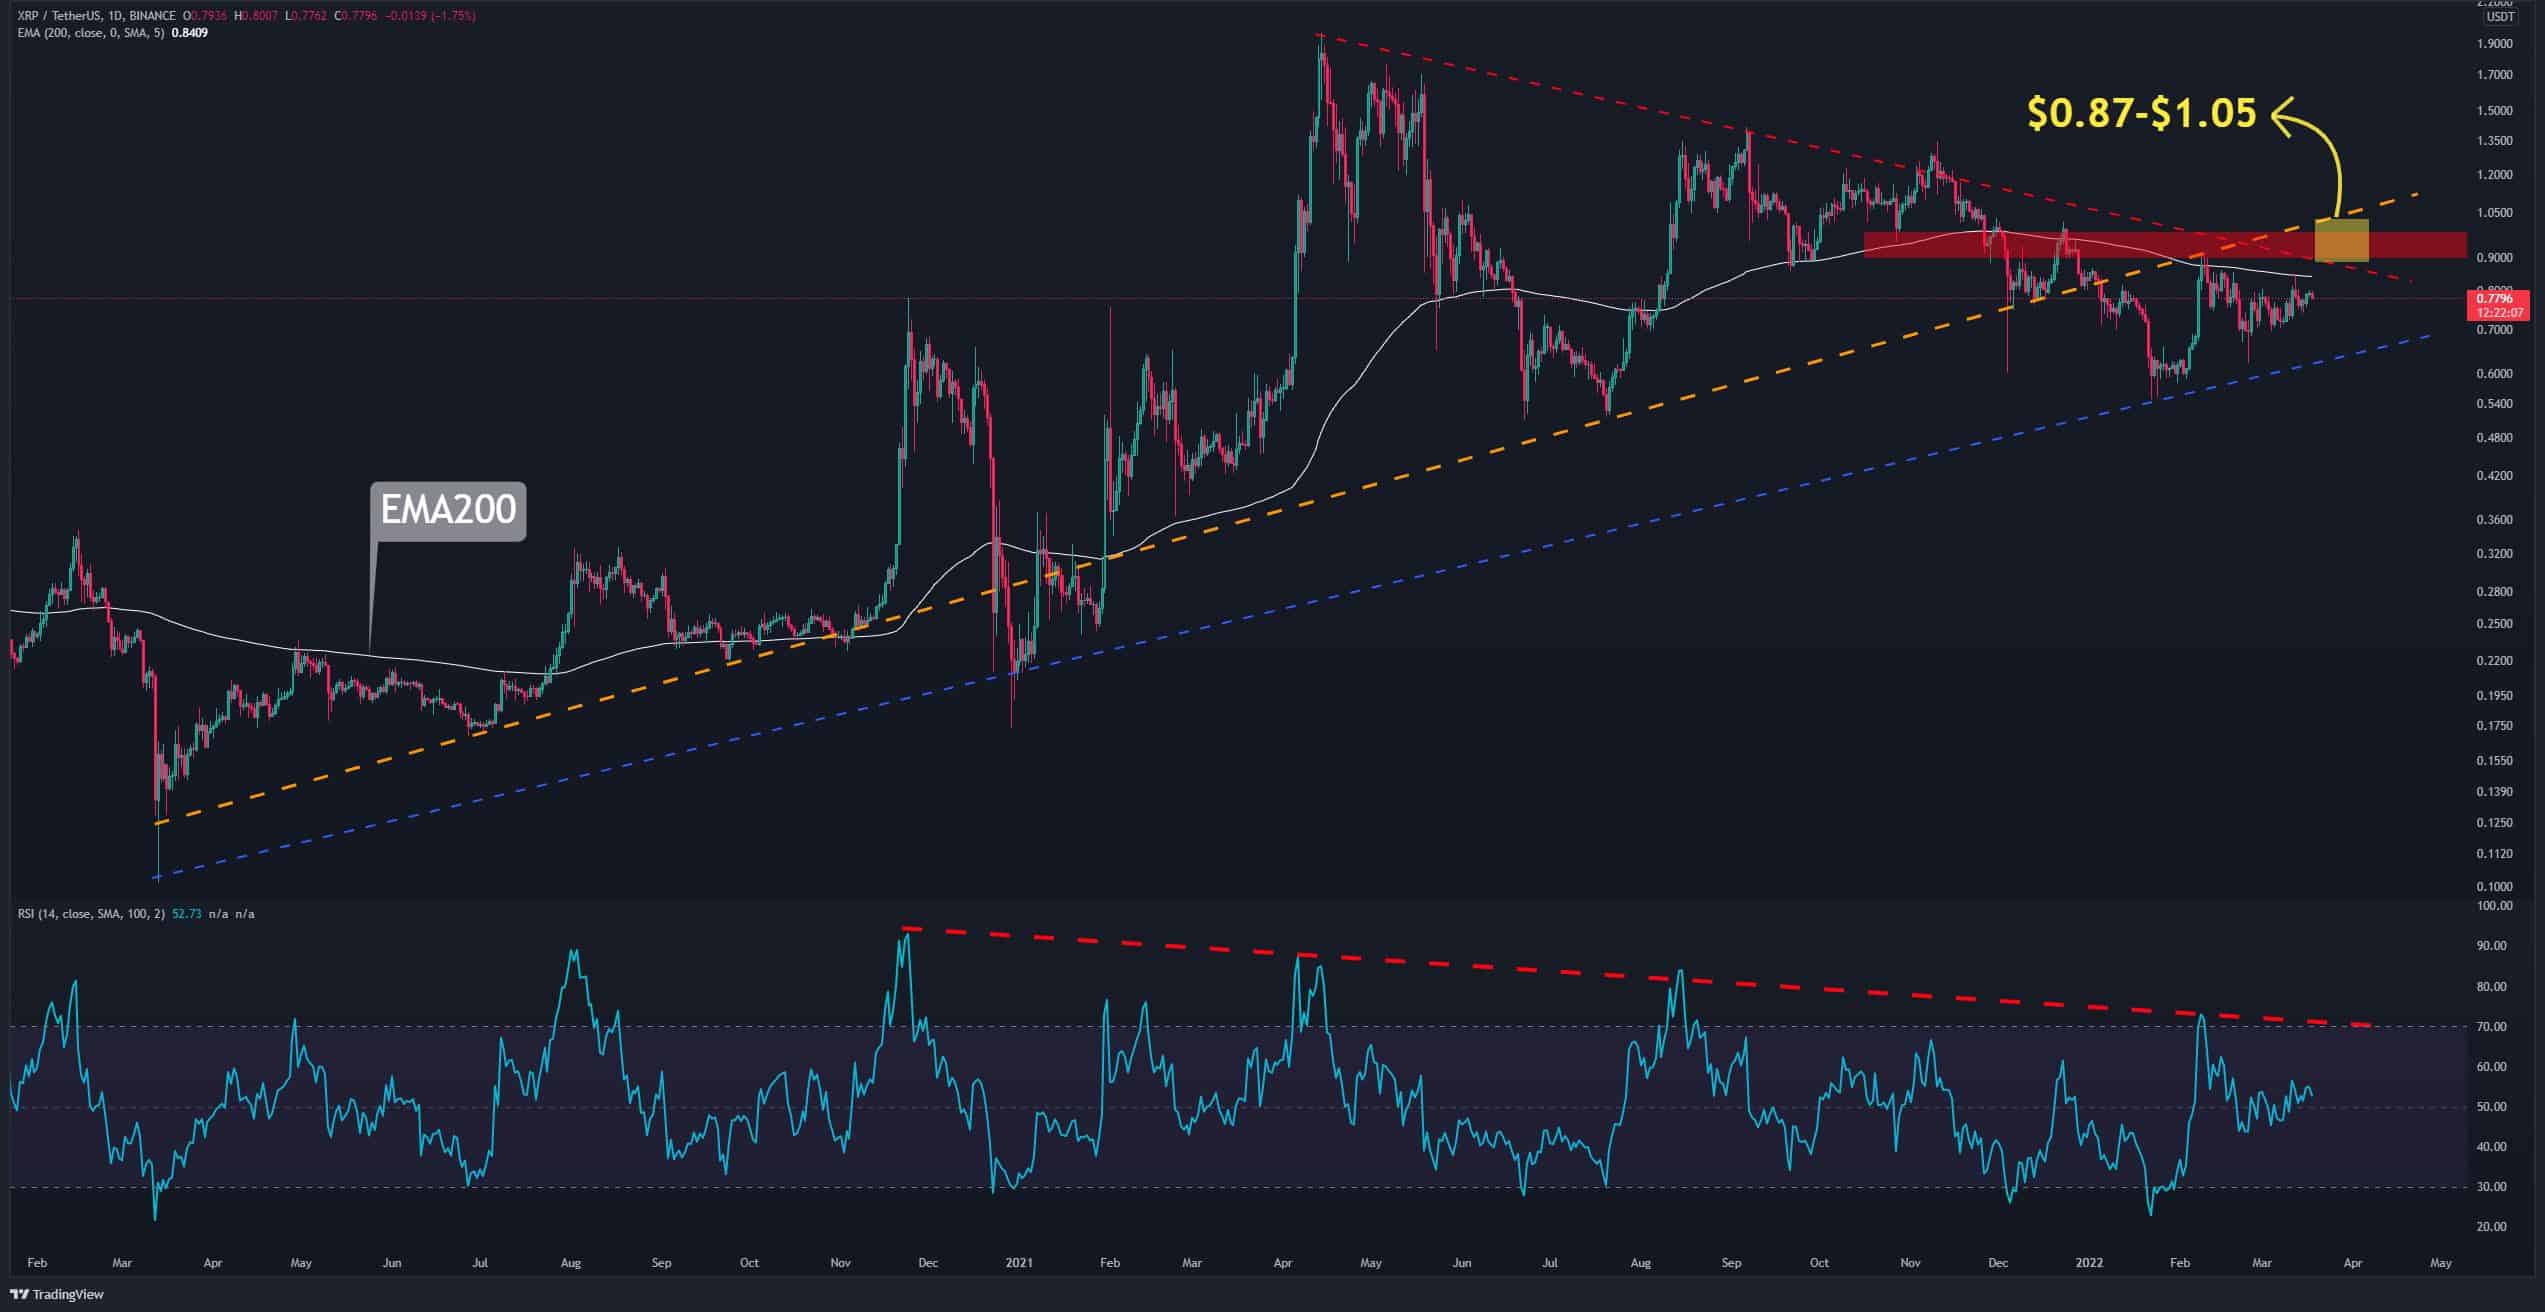
There are two main trend lines on the daily chart that have accompanied the price since the Covid Crash. The yellow trend line has now become resistance, and the blue one is playing as the dynamic support. But the main challenge right now is the resistance at $1, which is the confluence of different supply zones and indicators.
Breaking this resistance seems to be difficult, and Ripple needs a stronger catalyst than the news to overcome this challenge. If the price can cross above this area with strength, the road ahead will be smoother, and one can even expect the formation of a higher high with respect to the 2021’s top.
Indicators:
RSI-14: Bullish and above baseline (bulls control the market)
MACD: Sideways but in the bullish area
The 4-Hour Chart:
On the 4-hour timeframe, XRP is trading on the RSI support (marked by green), and the power of bulls is evident, but it has failed to break its static resistance (marked by yellow).
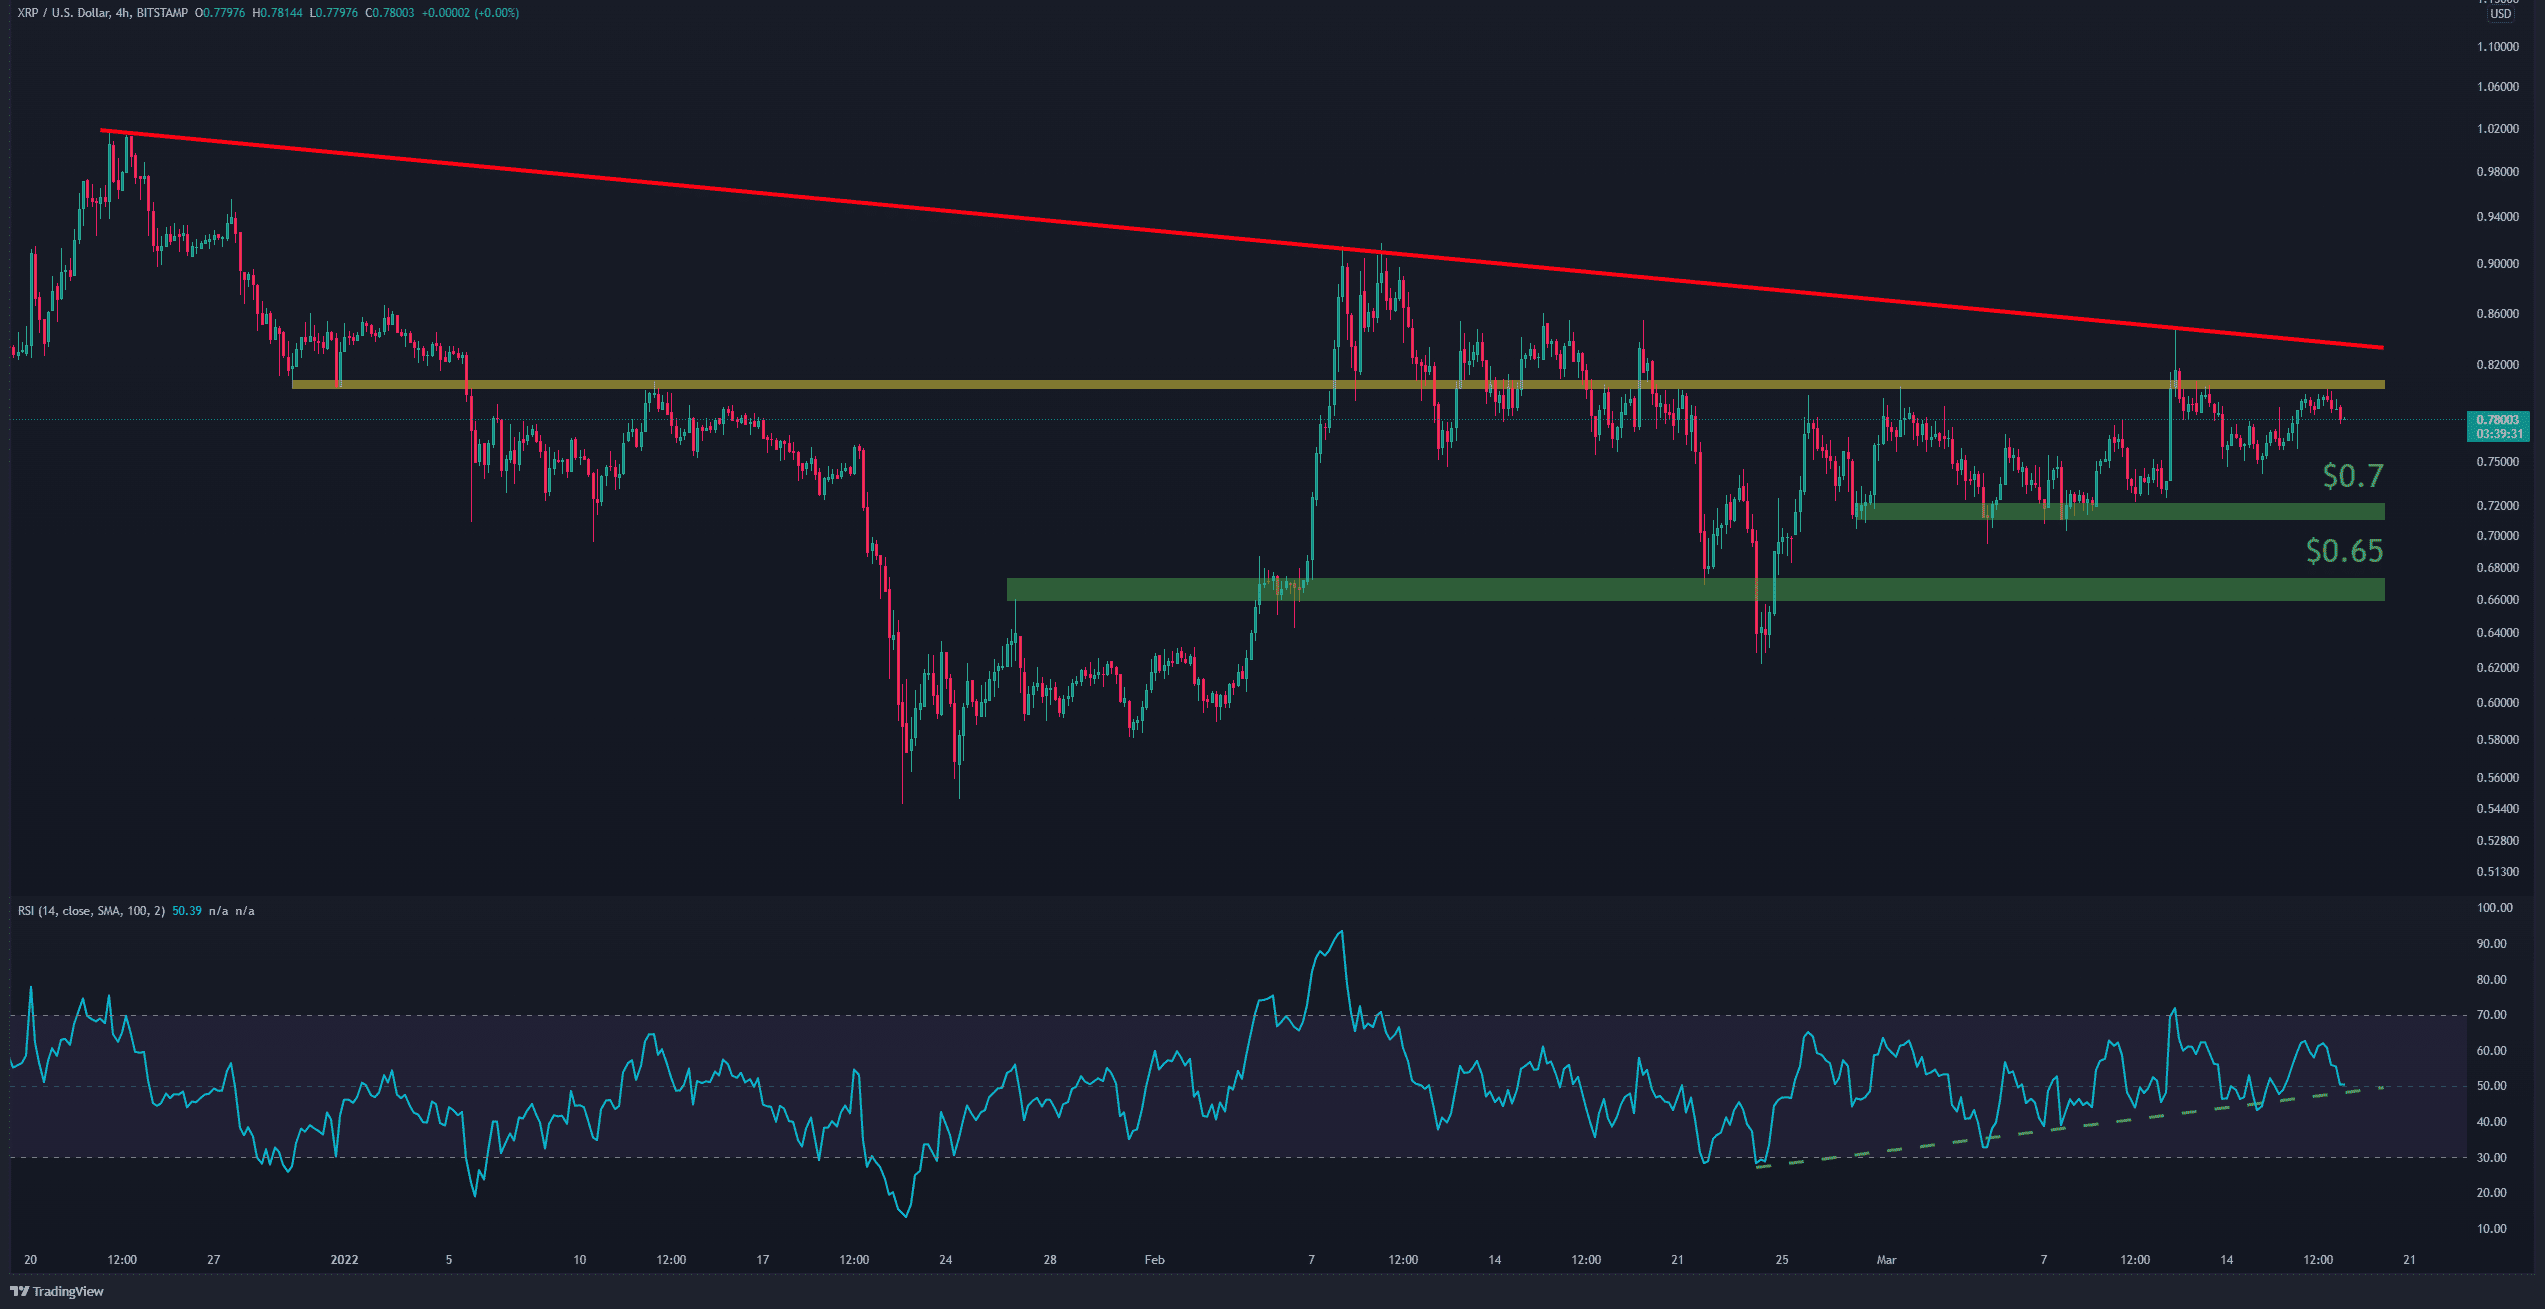
Crossing this area and the dynamic resistance (marked by red) will lead the cryptocurrency to the resistance at $1, which was examined on the daily timeframe to be the main challenge on the price road. Adversely, if the current bear/bull balance fails and the price heads south, the immediate support levels in short term are $0.65 and $0.7.