Ethereum’s price is encountering significant resistance around the pivotal .4K region, highlighting an ongoing struggle between buyers and sellers. Despite efforts, the price has been unable to surpass its previous swing high of 03, leading to a slight pullback and the potential formation of a double-top pattern. By Shayan The Daily Chart After a period of sideways consolidation near the crucial .3K mark, the price surged with the aim of reclaiming its previous daily swing high at 03. This upward movement is underscored by the occurrence of a golden cross on the daily chart, indicating an overall bullish sentiment for Ethereum’s price action. However, the price faced resistance upon reaching a critical zone formed by the upper boundary of a multi-month wedge,
Topics:
CryptoVizArt considers the following as important: ETH Analysis, ETHBTC, Ethereum (ETH) Price, ethusd
This could be interesting, too:
Mandy Williams writes Ethereum Derivatives Metrics Signal Modest Downside Tail Risk Ahead: Nansen
Jordan Lyanchev writes Weekly Bitcoin, Ethereum ETF Recap: Light at the End of the Tunnel for BTC
CryptoVizArt writes Will Weak Momentum Drive ETH to .5K? (Ethereum Price Analysis)
Jordan Lyanchev writes Bybit Hack Fallout: Arthur Hayes, Samson Mow Push for Ethereum Rollback
Ethereum’s price is encountering significant resistance around the pivotal $2.4K region, highlighting an ongoing struggle between buyers and sellers.
Despite efforts, the price has been unable to surpass its previous swing high of $2403, leading to a slight pullback and the potential formation of a double-top pattern.
By Shayan
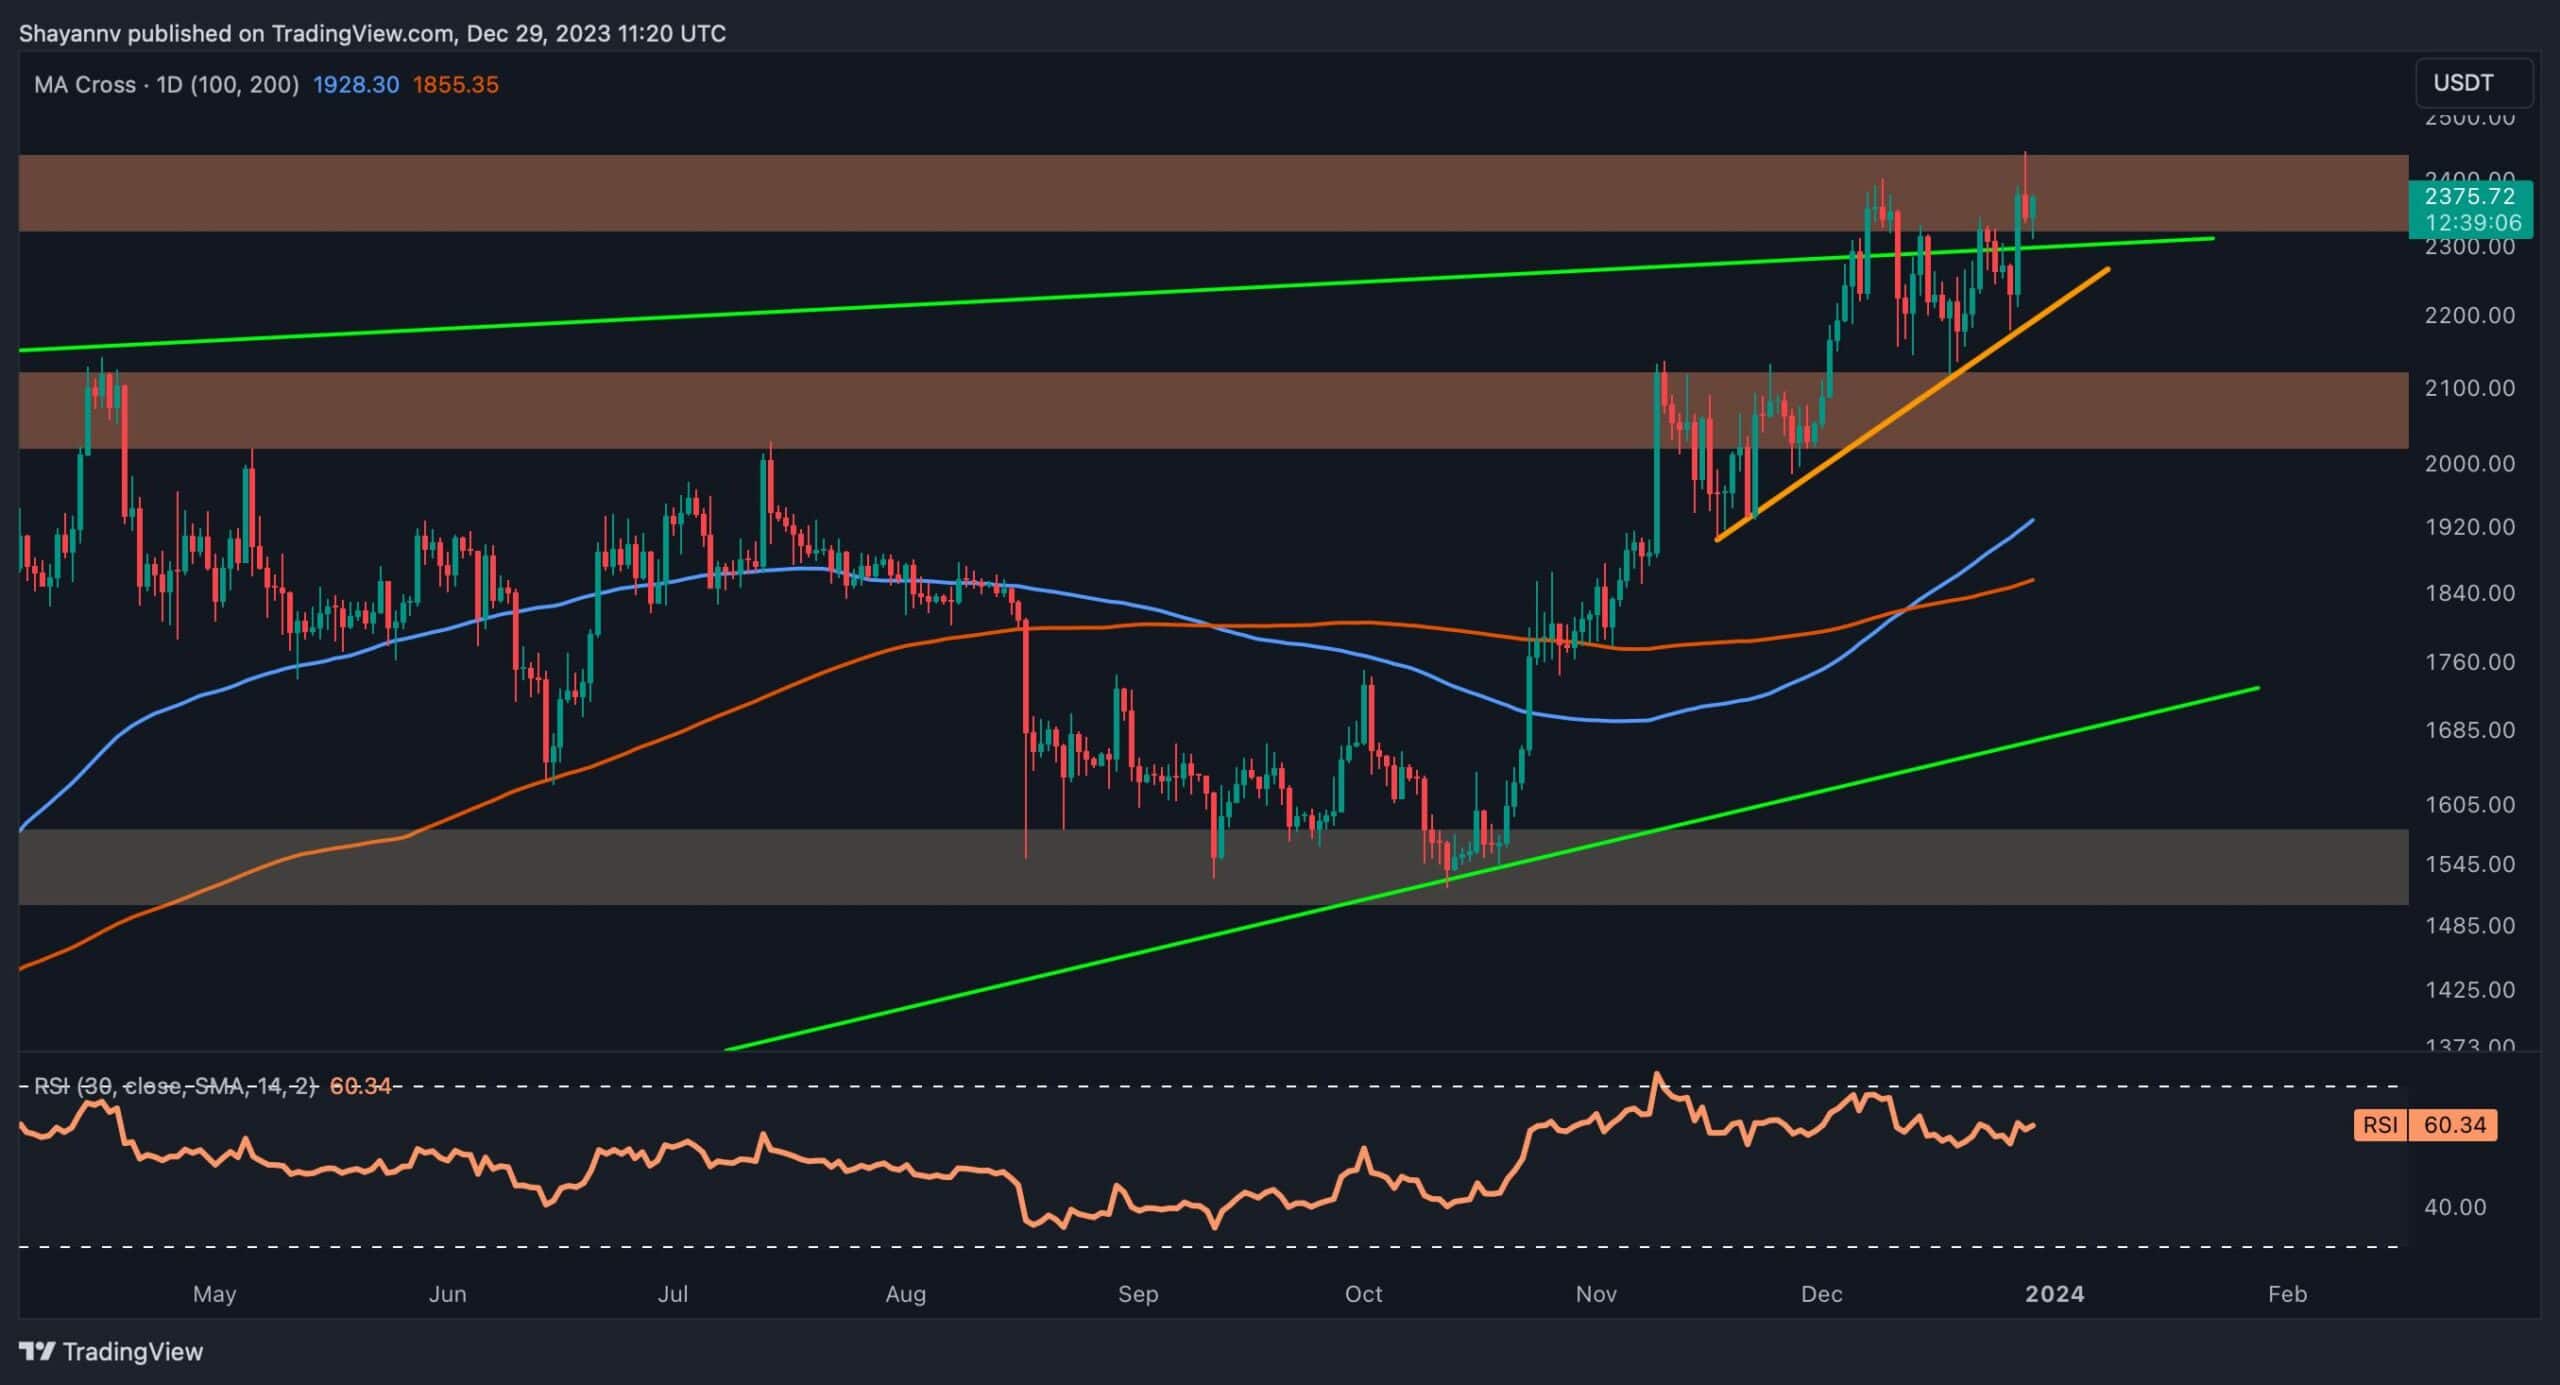
The Daily Chart
After a period of sideways consolidation near the crucial $2.3K mark, the price surged with the aim of reclaiming its previous daily swing high at $2403. This upward movement is underscored by the occurrence of a golden cross on the daily chart, indicating an overall bullish sentiment for Ethereum’s price action.
However, the price faced resistance upon reaching a critical zone formed by the upper boundary of a multi-month wedge, coinciding with the previous daily swing at $2403, thereby forming a potential double-top pattern.
Despite these challenges, the emergence of a potential head and shoulders pattern, a widely recognized bearish reversal formation, is notable. If the price breaks below the neckline of both the head and shoulders pattern and the double-top pattern, it could signal a short-term downward movement. This retracement might lead the price back to the substantial support range at $2K.
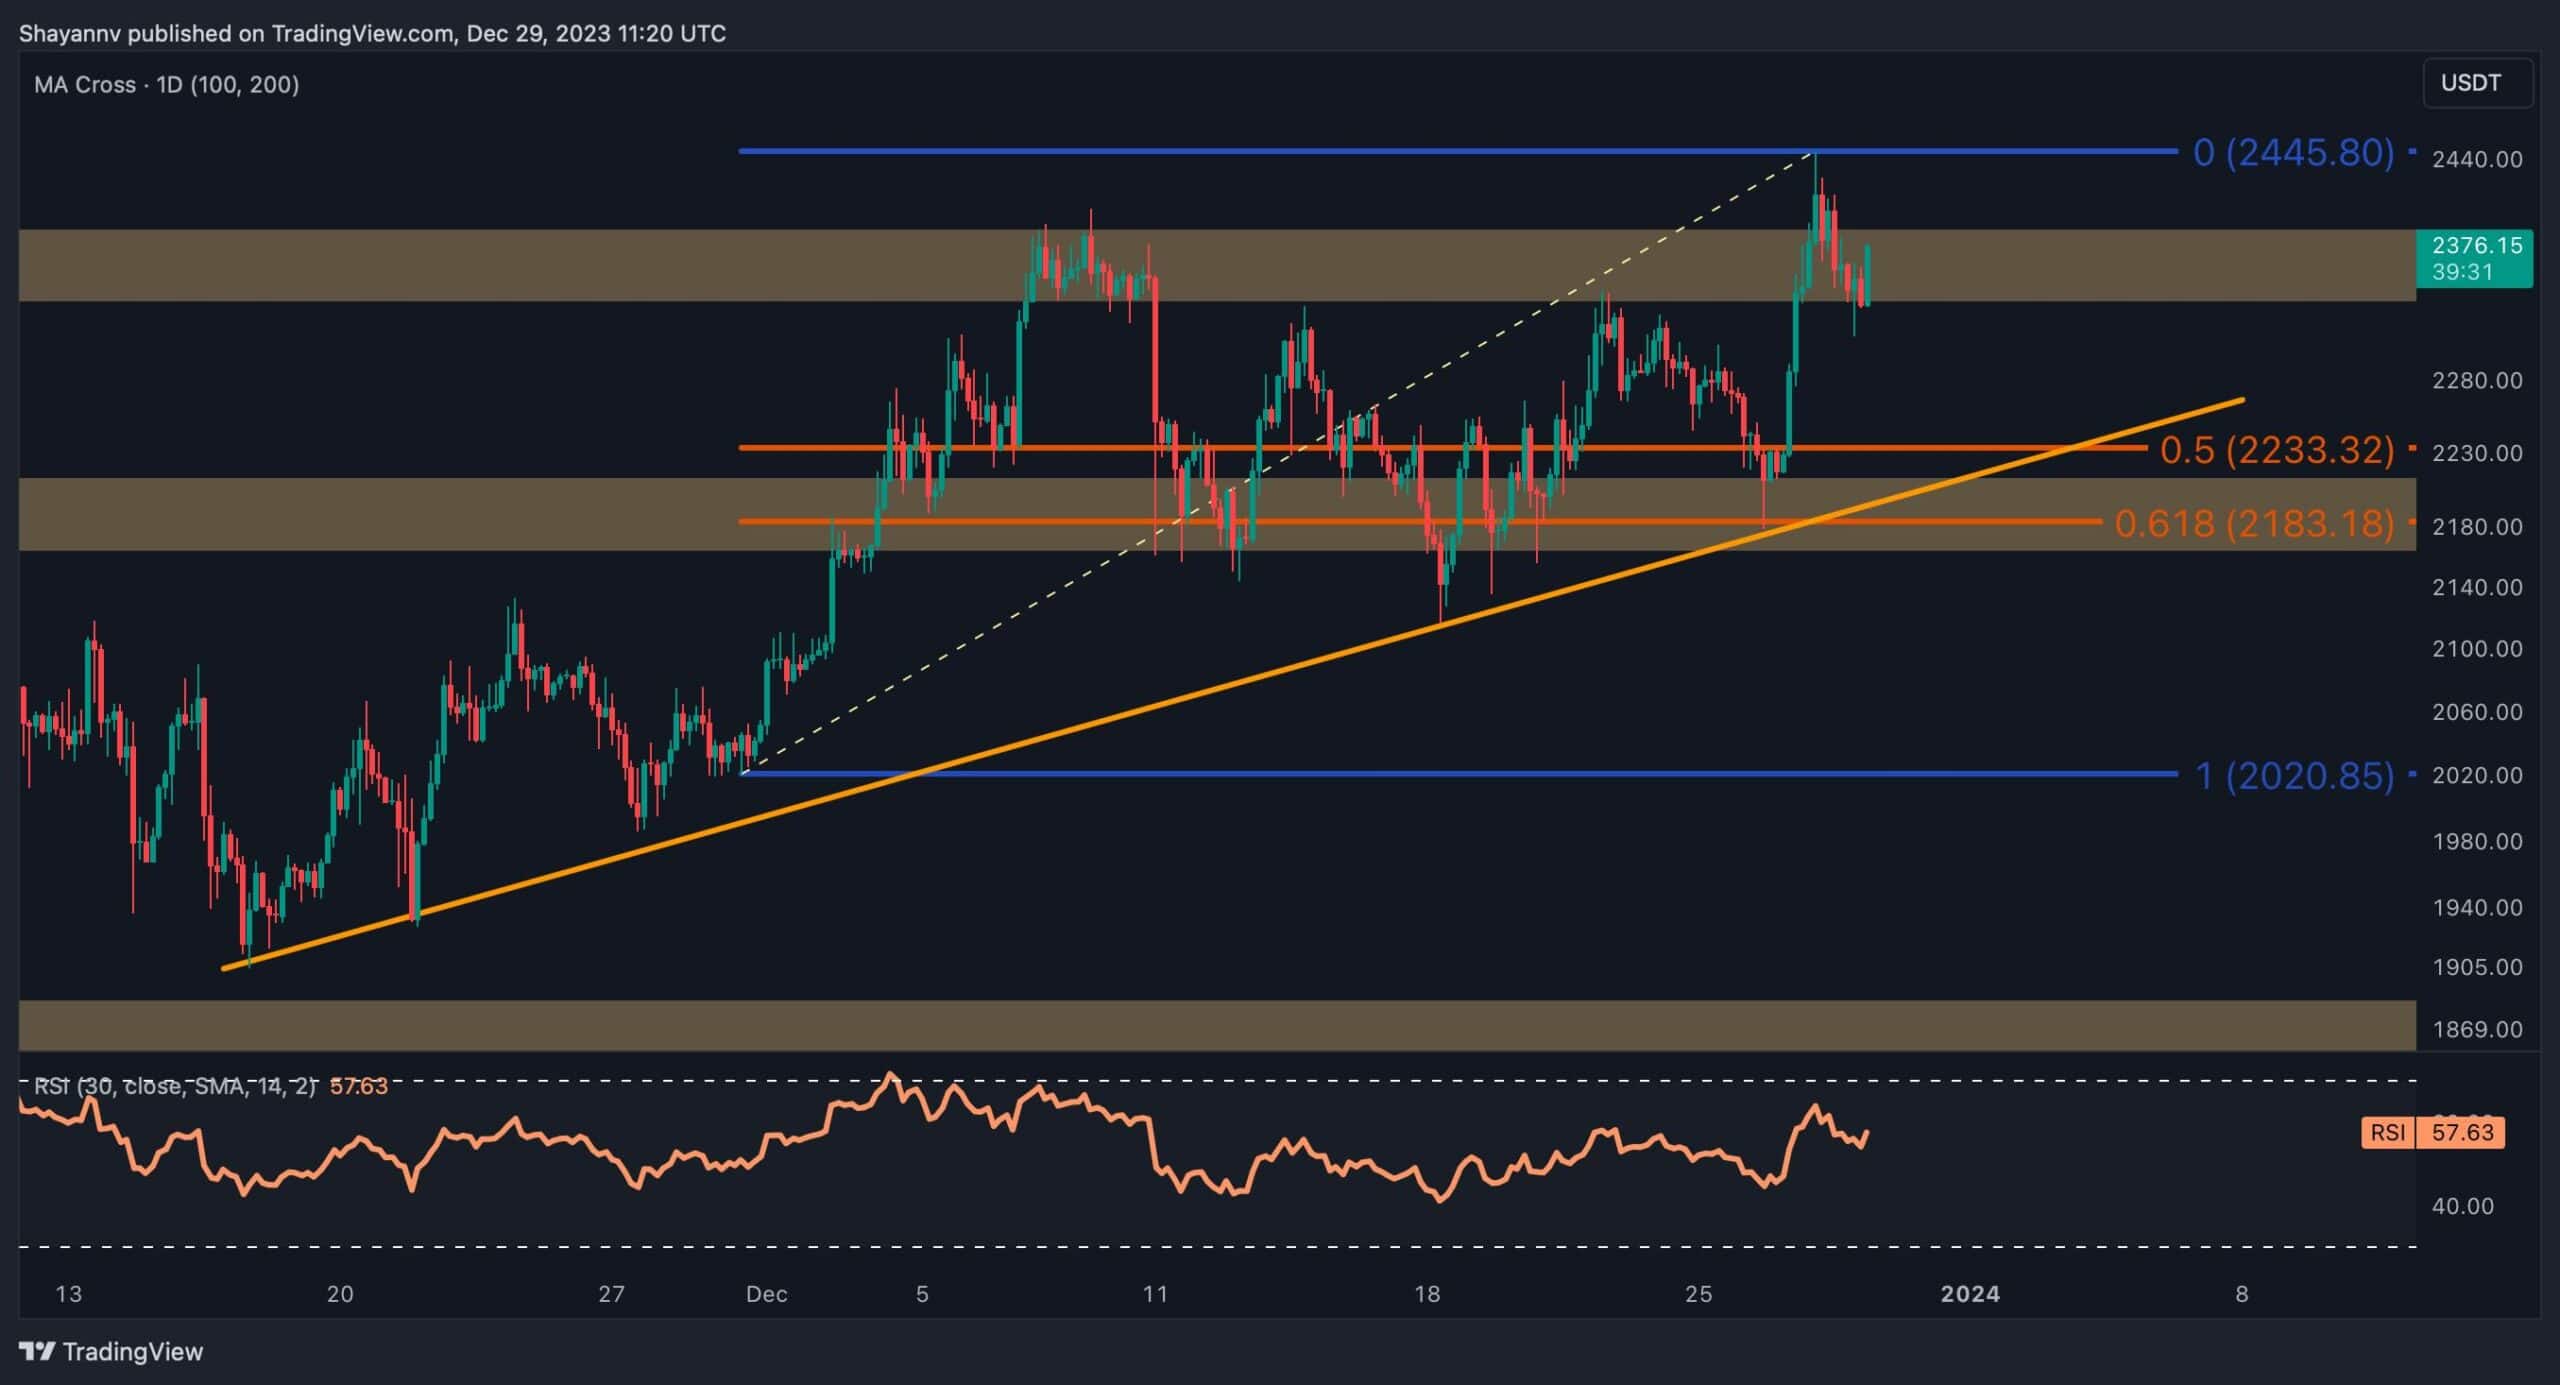
The 4-Hour Chart
A more detailed analysis of the 4-hour chart reveals increased demand within the critical range between the 0.5 ($2,211) and 0.618 ($2,166) levels of the Fibonacci retracement indicator. This demand led to an impulsive price spike attempting to breach the $2.4K daily swing high.
However, Ethereum faced a slight rejection, resulting in a retracement toward the static support level at $2.3K. Despite this retracement, Ethereum’s price appears to be confined within a crucial range, encompassing the significant $2.4K resistance region and the substantial static support range characterized by the 0.5 ($2,211) and 0.618 ($2,166) Fibonacci retracement levels, along with the dynamic support provided by the multi-week ascending trendline.
A breakout in either direction from this range could signal the initiation of a new impulsive trend.
By Shayan
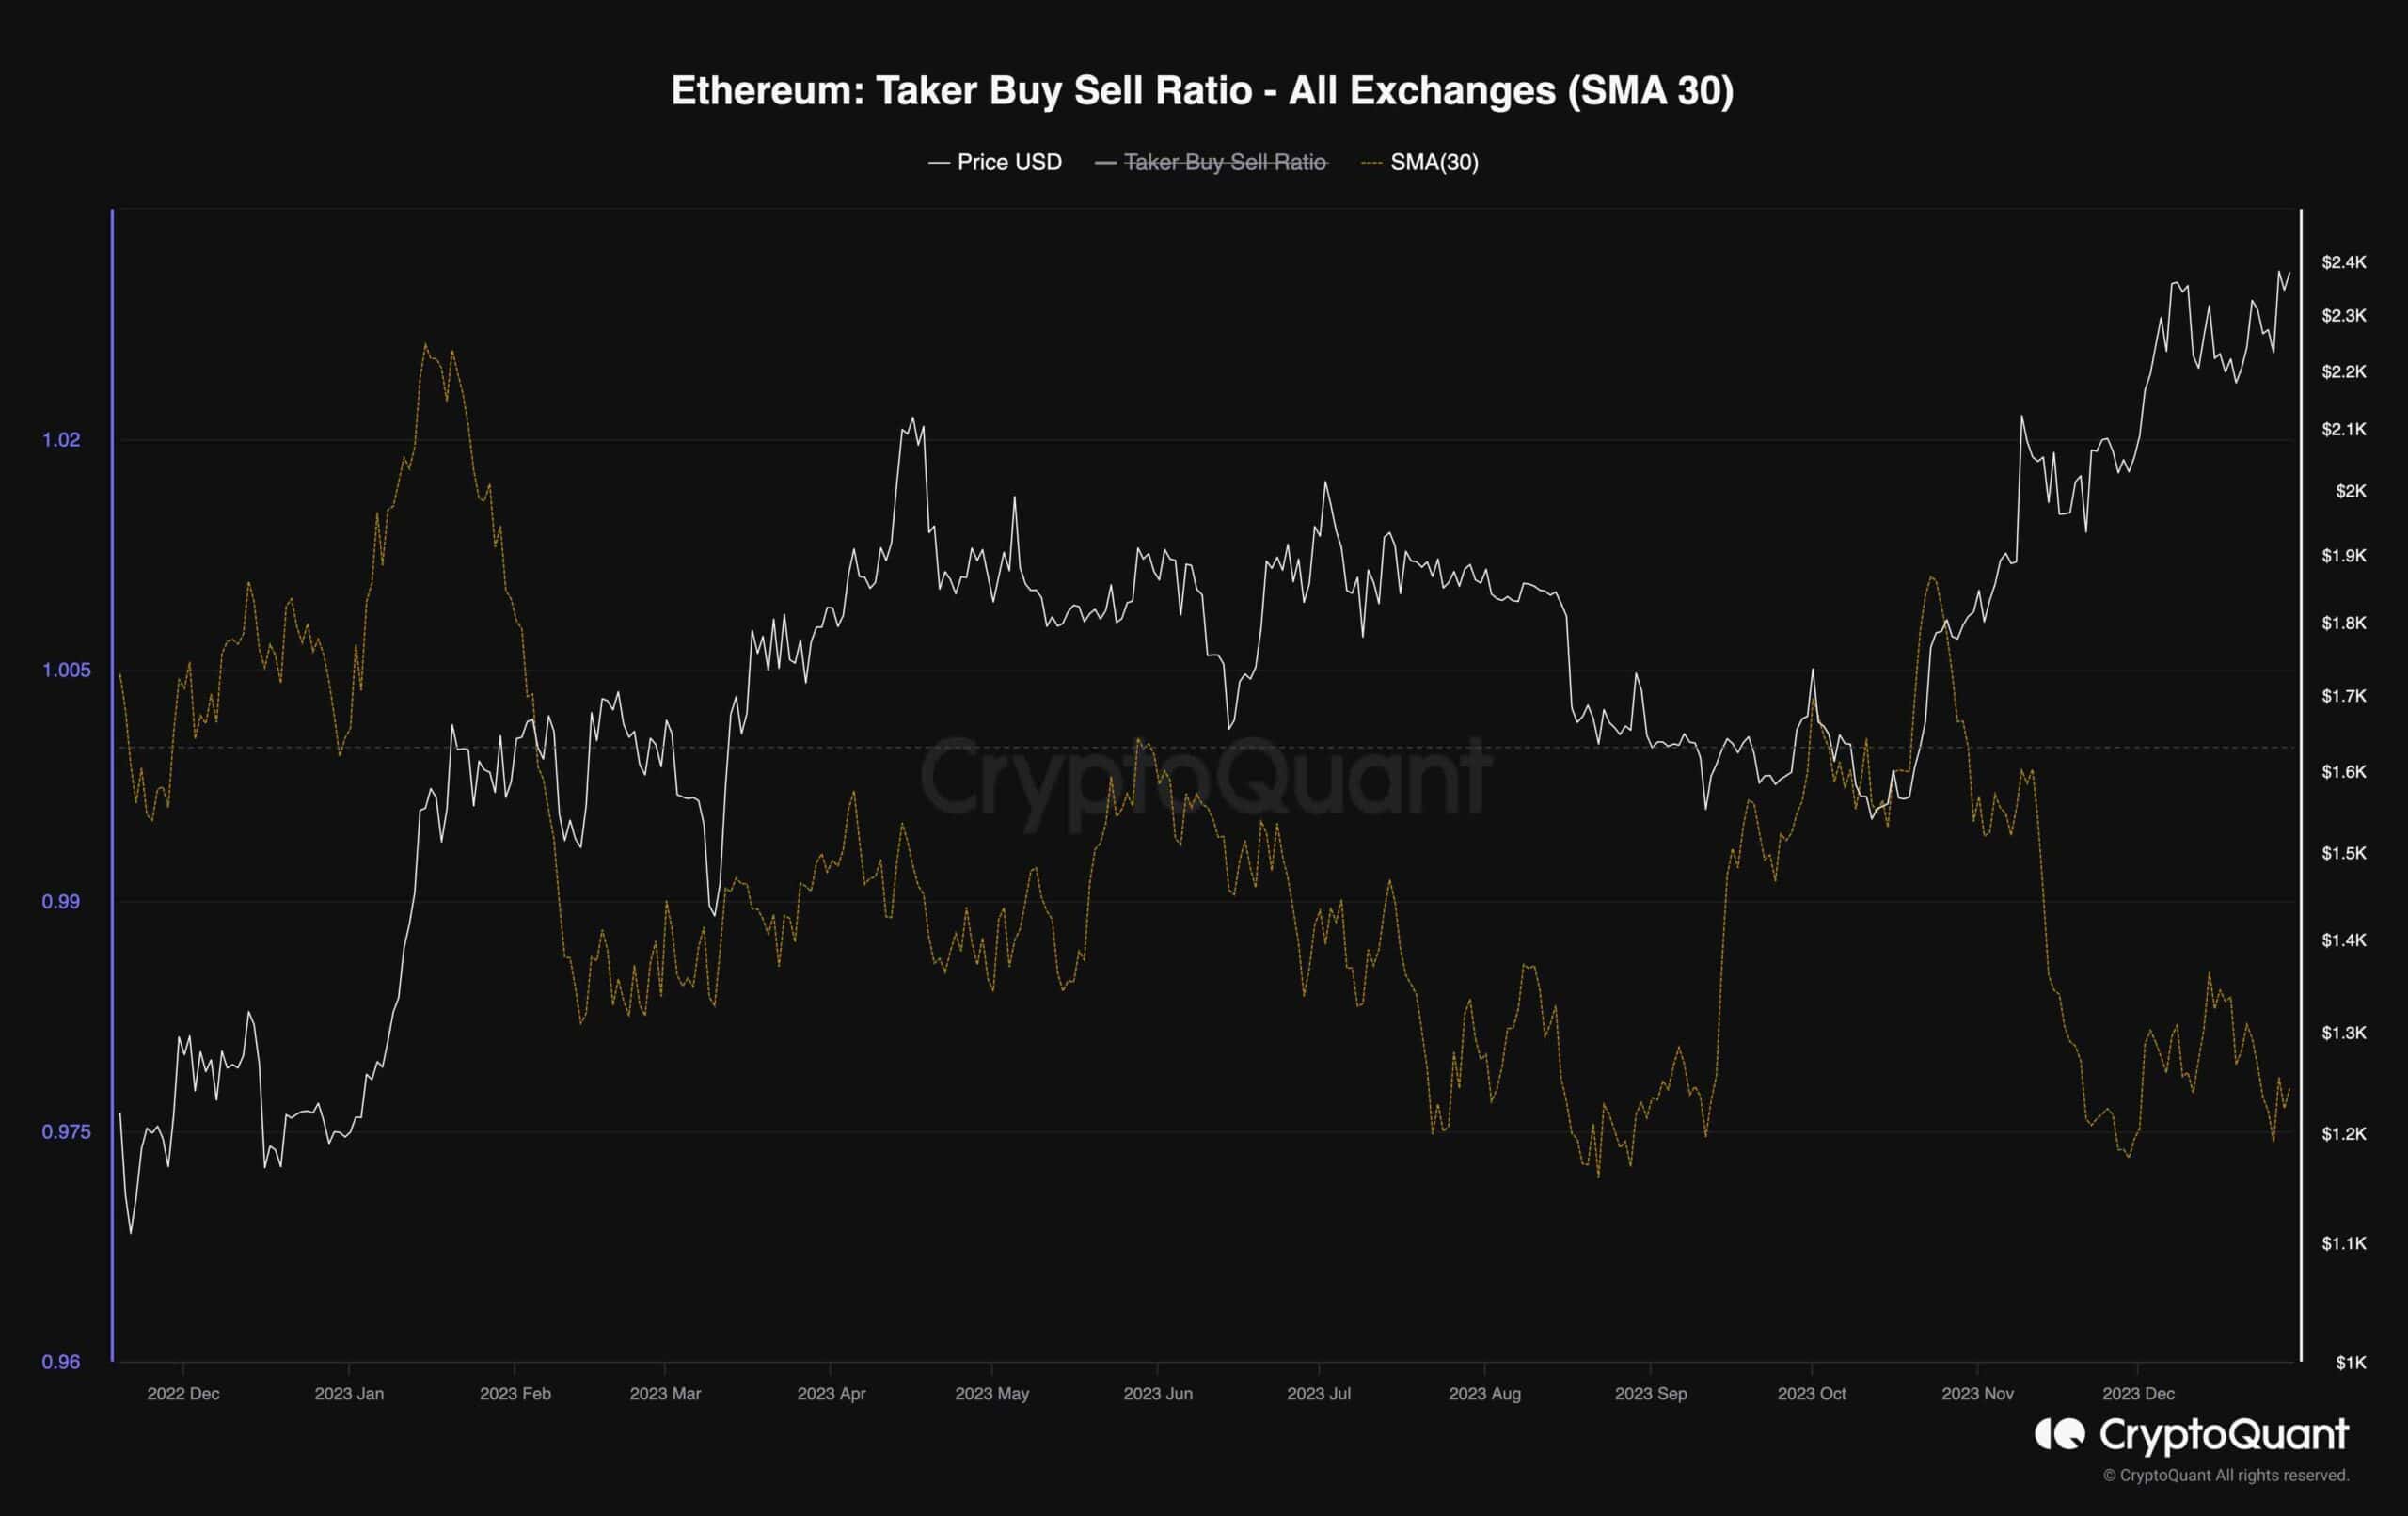
Within the domain of on-chain data analysis, exploring the sentiment reflected in the futures market provides valuable insights into Ethereum’s overarching perspective.
The provided chart portrays the 30-day standard moving average of the Ethereum taker buy-sell ratio. This metric indicates whether buyers or sellers are executing more aggressively on aggregate (taker orders). Values below 1 are perceived as bearish, while values above 1 are indicative of bullish sentiment.
Upon examination of the chart, a notable trend emerges: the taker buy-sell ratio has consistently remained below 1 over the past six months.
Despite the recent uptrend in price, the metric has entered a consolidation phase, signaling an overall bearish sentiment among futures traders. Should the taker buy-sell ratio suddenly surge above 1 again, it would suggest a shift to a full-fledged bull market, potentially propelling the price to new yearly highs.