Ripple’s price has gone through increased volatility over the last 24 hours, experiencing fluctuations of around 15% in a matter of hours. Yet, there might be more of it en route. Technical Analysis By: Edris XRP/USDT Daily Chart On the daily timeframe, it is evident that the price has dropped towards and rebounded from %excerpt%.3 rapidly, as demonstrated by the considerable wick to the downside. The initial decline has been in play since the price was rejected from the 200-day and 50-day moving averages on multiple occasions. However, the %excerpt%.3 support level that previously held the price from crashing further has done so successfully again, pushing the cryptocurrency to the upside. Currently, the 50-day and 200-day moving averages remain significant dynamic resistance levels
Topics:
CryptoVizArt considers the following as important: Ripple (XRP) Price, XRP Analysis, xrpbtc, xrpusd
This could be interesting, too:
Jordan Lyanchev writes Ripple’s (XRP) Surge to Triggers Over Million in Short Liquidations
Jordan Lyanchev writes Trump Confirms Work on Strategic Crypto Reserve: XRP, ADA, SOL Included
Dimitar Dzhondzhorov writes Is a Major Ripple v. SEC Lawsuit Development Expected This Week? Here’s Why
Mandy Williams writes Ripple Releases Institutional DeFi Roadmap for XRP Ledger in 2025
Ripple’s price has gone through increased volatility over the last 24 hours, experiencing fluctuations of around 15% in a matter of hours. Yet, there might be more of it en route.
Technical Analysis
By: Edris
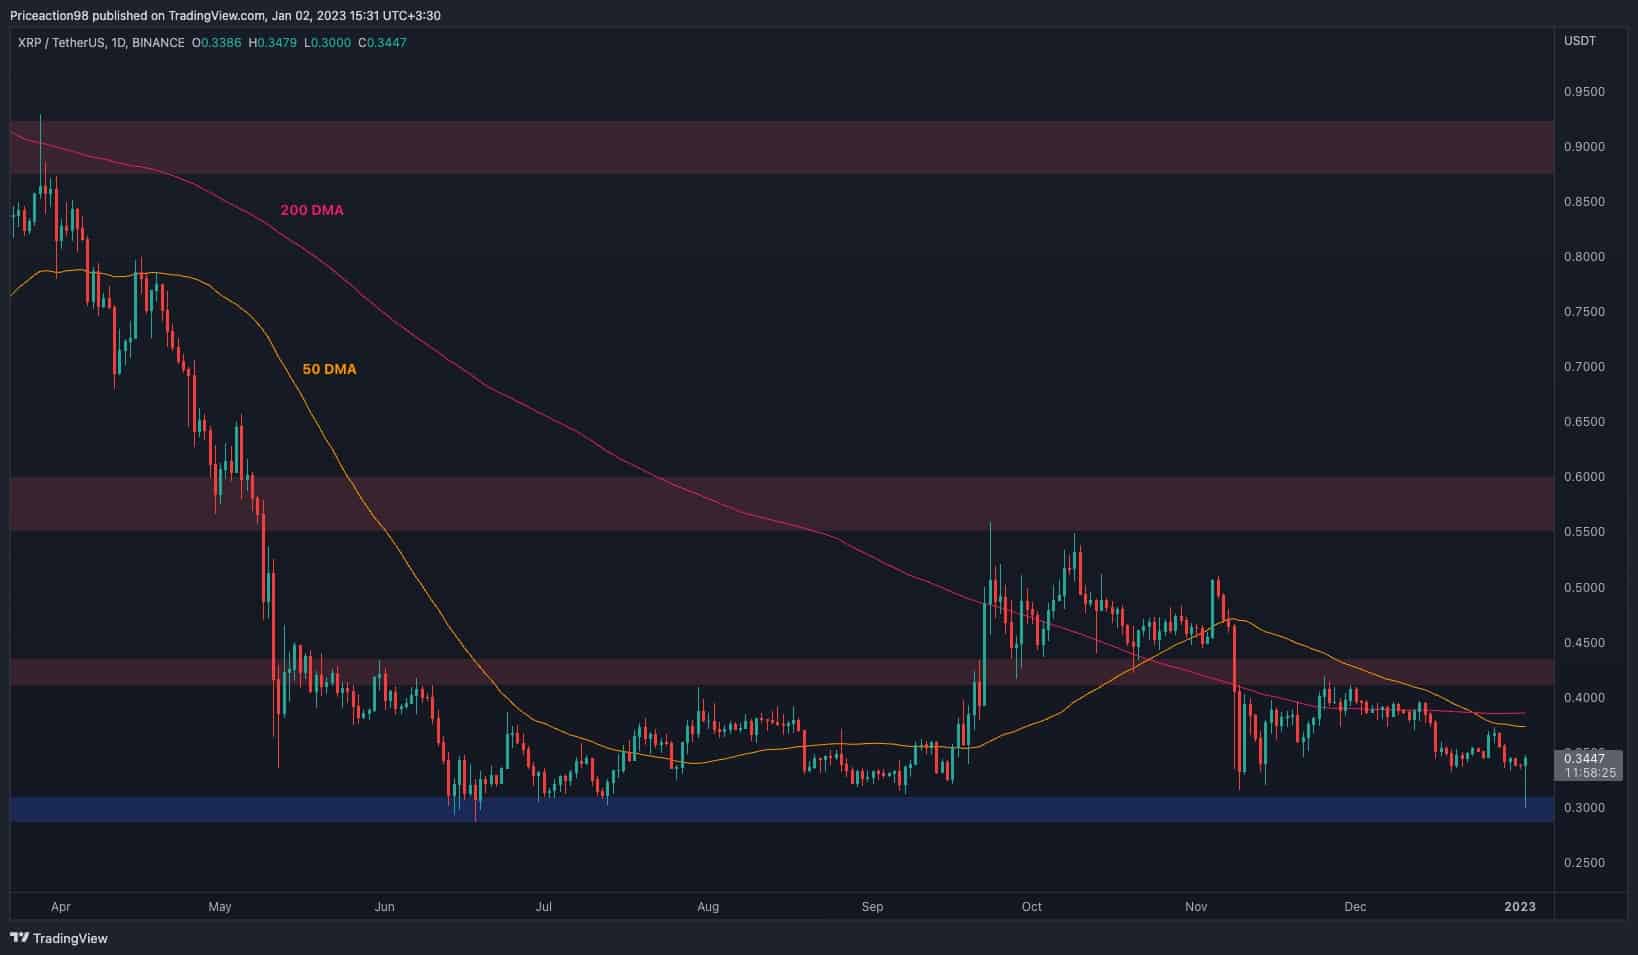
XRP/USDT Daily Chart
On the daily timeframe, it is evident that the price has dropped towards and rebounded from $0.3 rapidly, as demonstrated by the considerable wick to the downside. The initial decline has been in play since the price was rejected from the 200-day and 50-day moving averages on multiple occasions.
However, the $0.3 support level that previously held the price from crashing further has done so successfully again, pushing the cryptocurrency to the upside.
Currently, the 50-day and 200-day moving averages remain significant dynamic resistance levels around the $0.37 and $0.39 marks, respectively, with the $0.42 area being the critical resistance zone for the price to break for a rally in the short term. On the other hand, a breakdown of the $0.3 level would be catastrophic, as no recent support is available beyond it to turn things around.
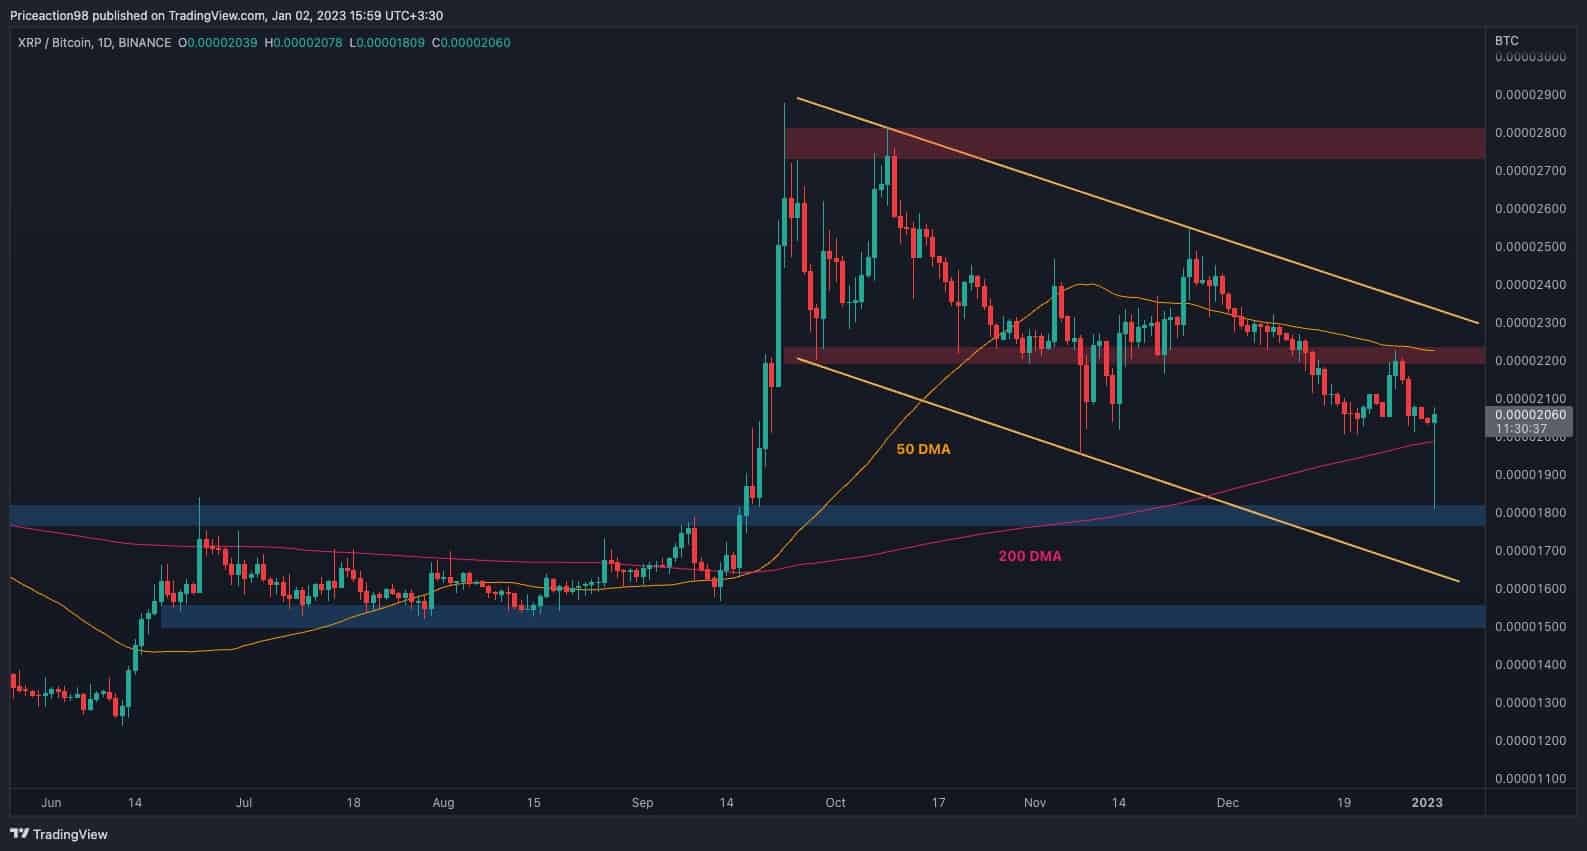
XRP/BTC Daily Chart
Against Bitcoin, XRP’s price has gone through similar volatility today, testing the 0.000018 SAT support level and instantly exploding back up. Still, the price remains trapped between the 50-day and 200-day moving averages, trending around the 0.000022 SAT and 0.000022 SAT levels, respectively.
While the price has seemingly climbed back above the 200-day moving average earlier today, it could be targeting the 50-day one located near the significant 0.000022 SAT static resistance level.
In case of a breakout above this area, a rally and breakout above the higher boundary of the large bearish flag could be expected, leading to a potential bullish trend in the near future. Conversely, a drop below the 200-day moving average would make a decline toward the 0.000018 SAT, and even the 0.000015 SAT support levels probable. However, considering the current market structure, the bullish scenario seems more reliable.