After Ripple’s sudden decline, the price fell below the 100-day moving average. However, it has now reached the critical support level of the 200-day moving average at %excerpt%.41, and the bears might just be getting started. Technical Analysis By Shayan The Daily Chart Following Ripple’s rejection from the %excerpt%.58 resistance level on the daily chart, the price experienced a massive decline, dropping below the 100-day moving average. However, the cryptocurrency has found substantial support at the 200-day moving average of %excerpt%.41. The strength of this moving average suggests that the price may enter a consolidation phase. However, if the bears manage to push it below the 200-day moving average, this may trigger a cascade effect and bearish sentiment for Ripple’s long-term
Topics:
CryptoVizArt considers the following as important: Ripple (XRP) Price, XRP Analysis, xrpbtc, xrpusd
This could be interesting, too:
Jordan Lyanchev writes Ripple’s (XRP) Surge to Triggers Over Million in Short Liquidations
Jordan Lyanchev writes Trump Confirms Work on Strategic Crypto Reserve: XRP, ADA, SOL Included
Dimitar Dzhondzhorov writes Is a Major Ripple v. SEC Lawsuit Development Expected This Week? Here’s Why
Mandy Williams writes Ripple Releases Institutional DeFi Roadmap for XRP Ledger in 2025
After Ripple’s sudden decline, the price fell below the 100-day moving average. However, it has now reached the critical support level of the 200-day moving average at $0.41, and the bears might just be getting started.
Technical Analysis
By Shayan
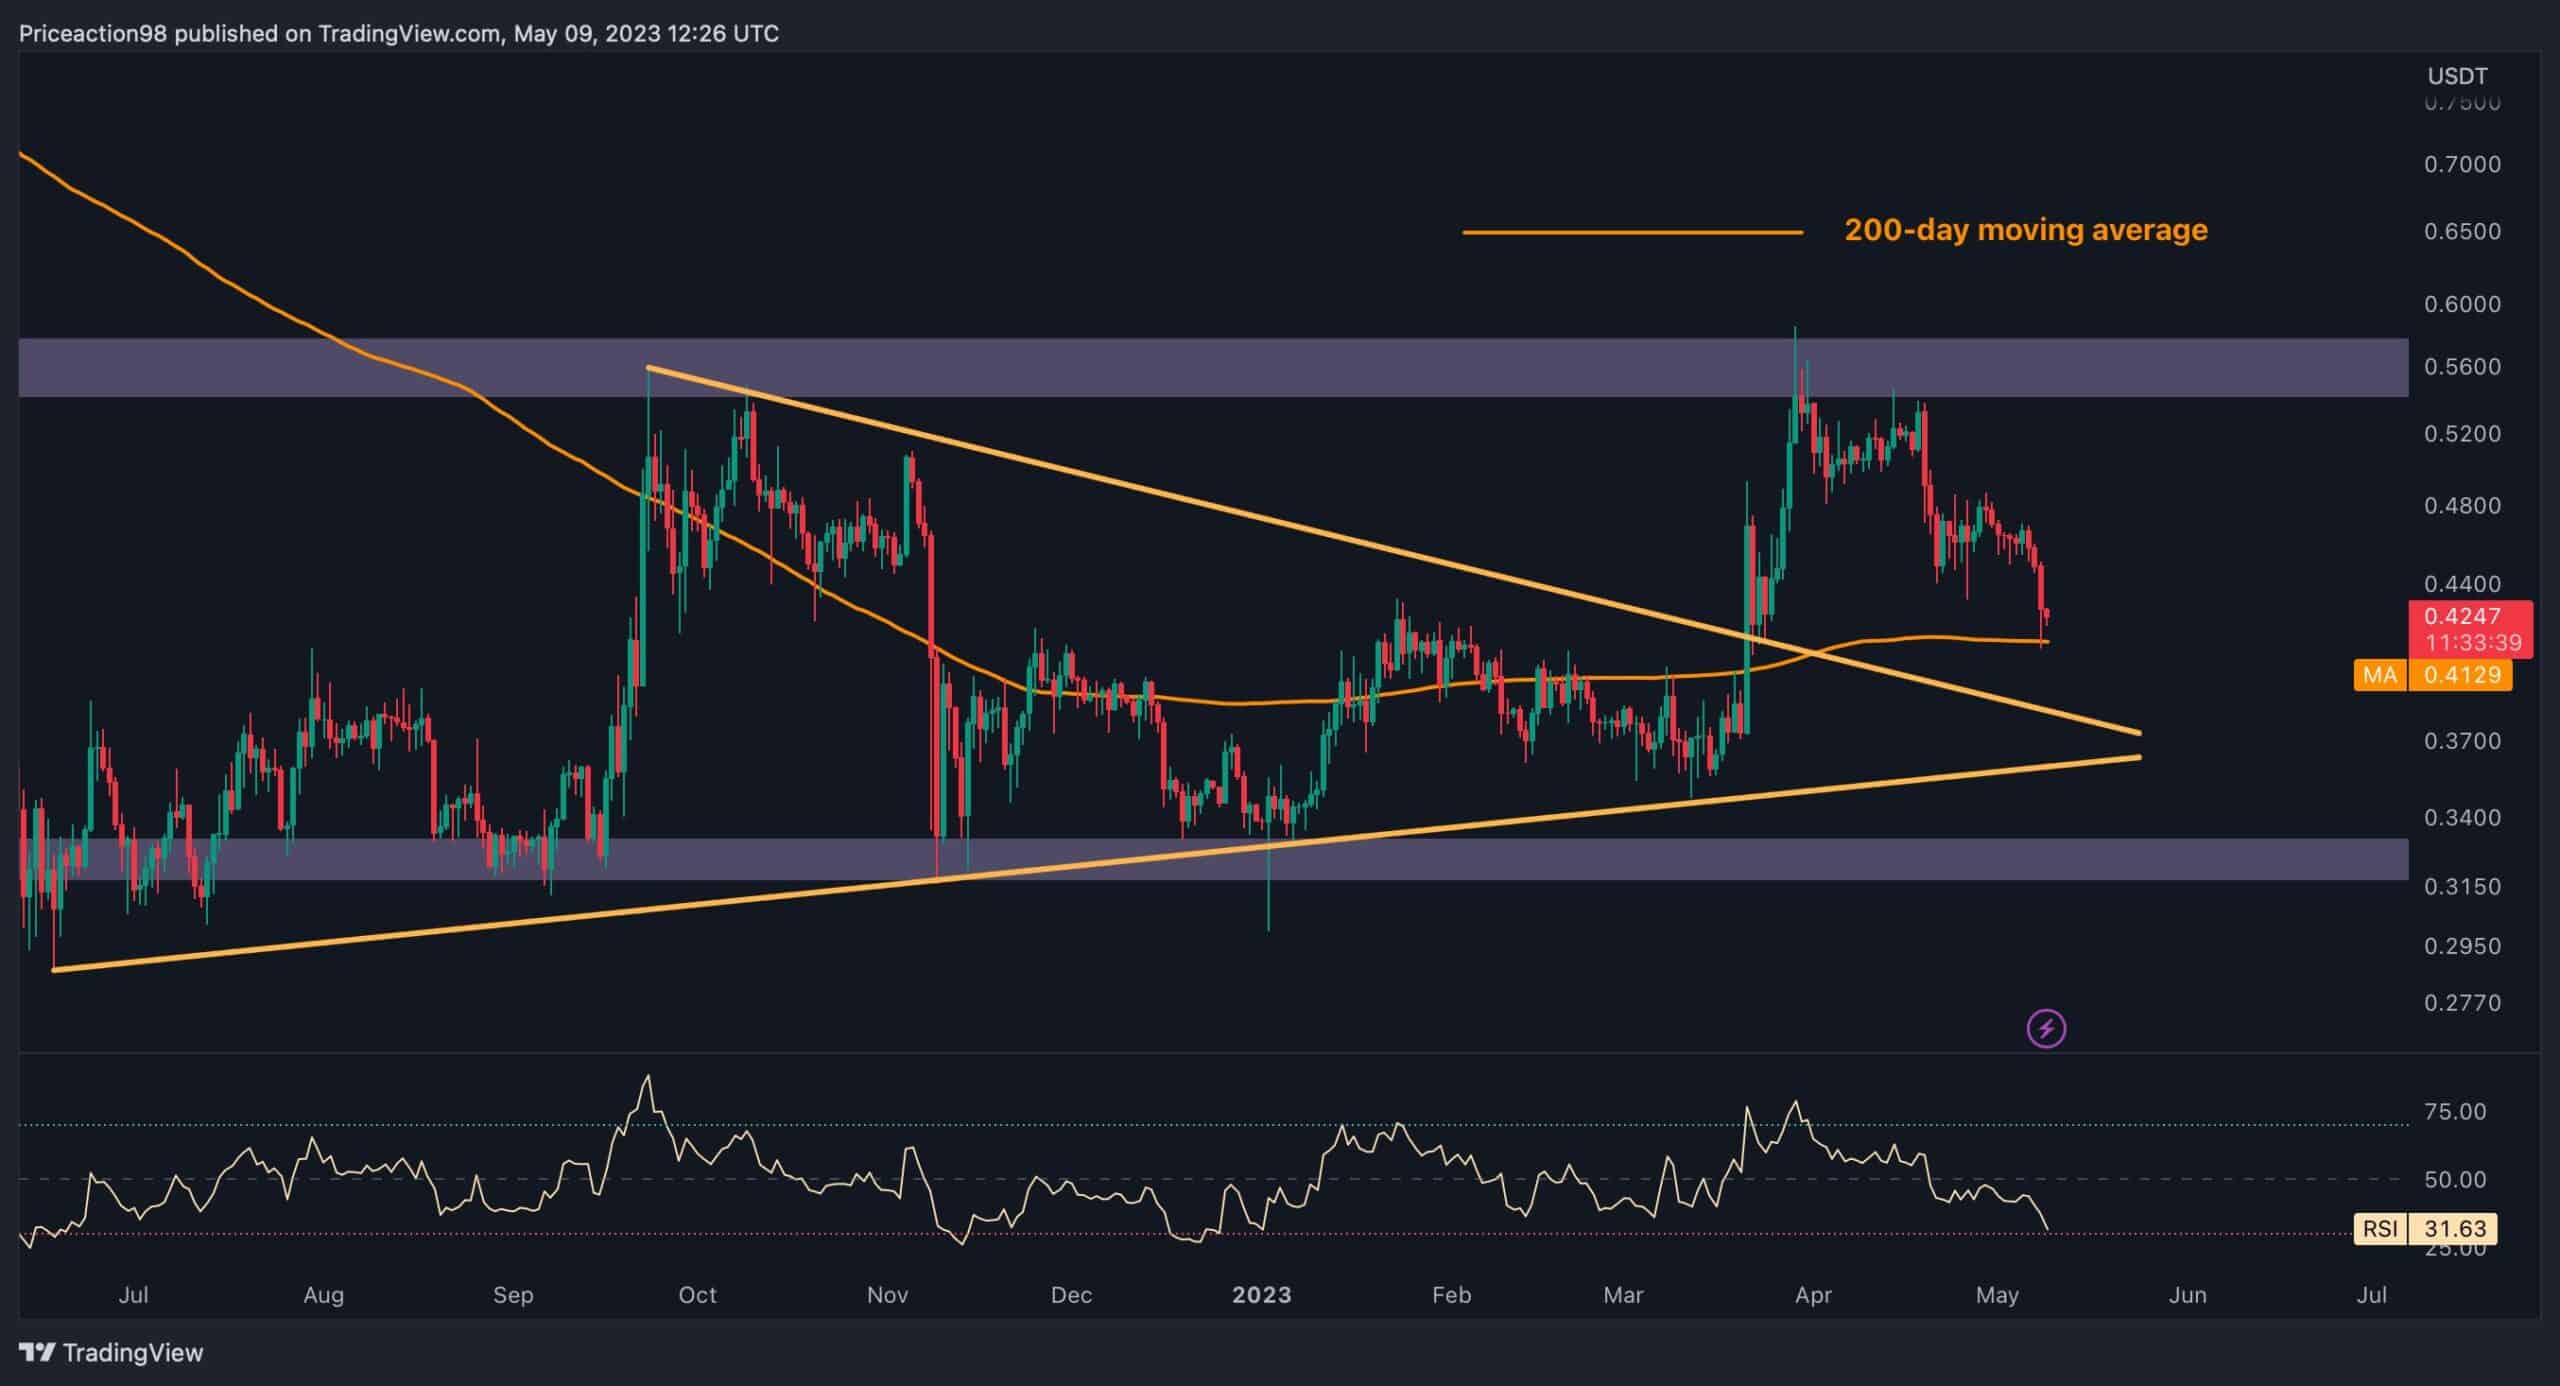
The Daily Chart
Following Ripple’s rejection from the $0.58 resistance level on the daily chart, the price experienced a massive decline, dropping below the 100-day moving average. However, the cryptocurrency has found substantial support at the 200-day moving average of $0.41.
The strength of this moving average suggests that the price may enter a consolidation phase. However, if the bears manage to push it below the 200-day moving average, this may trigger a cascade effect and bearish sentiment for Ripple’s long-term prospects.
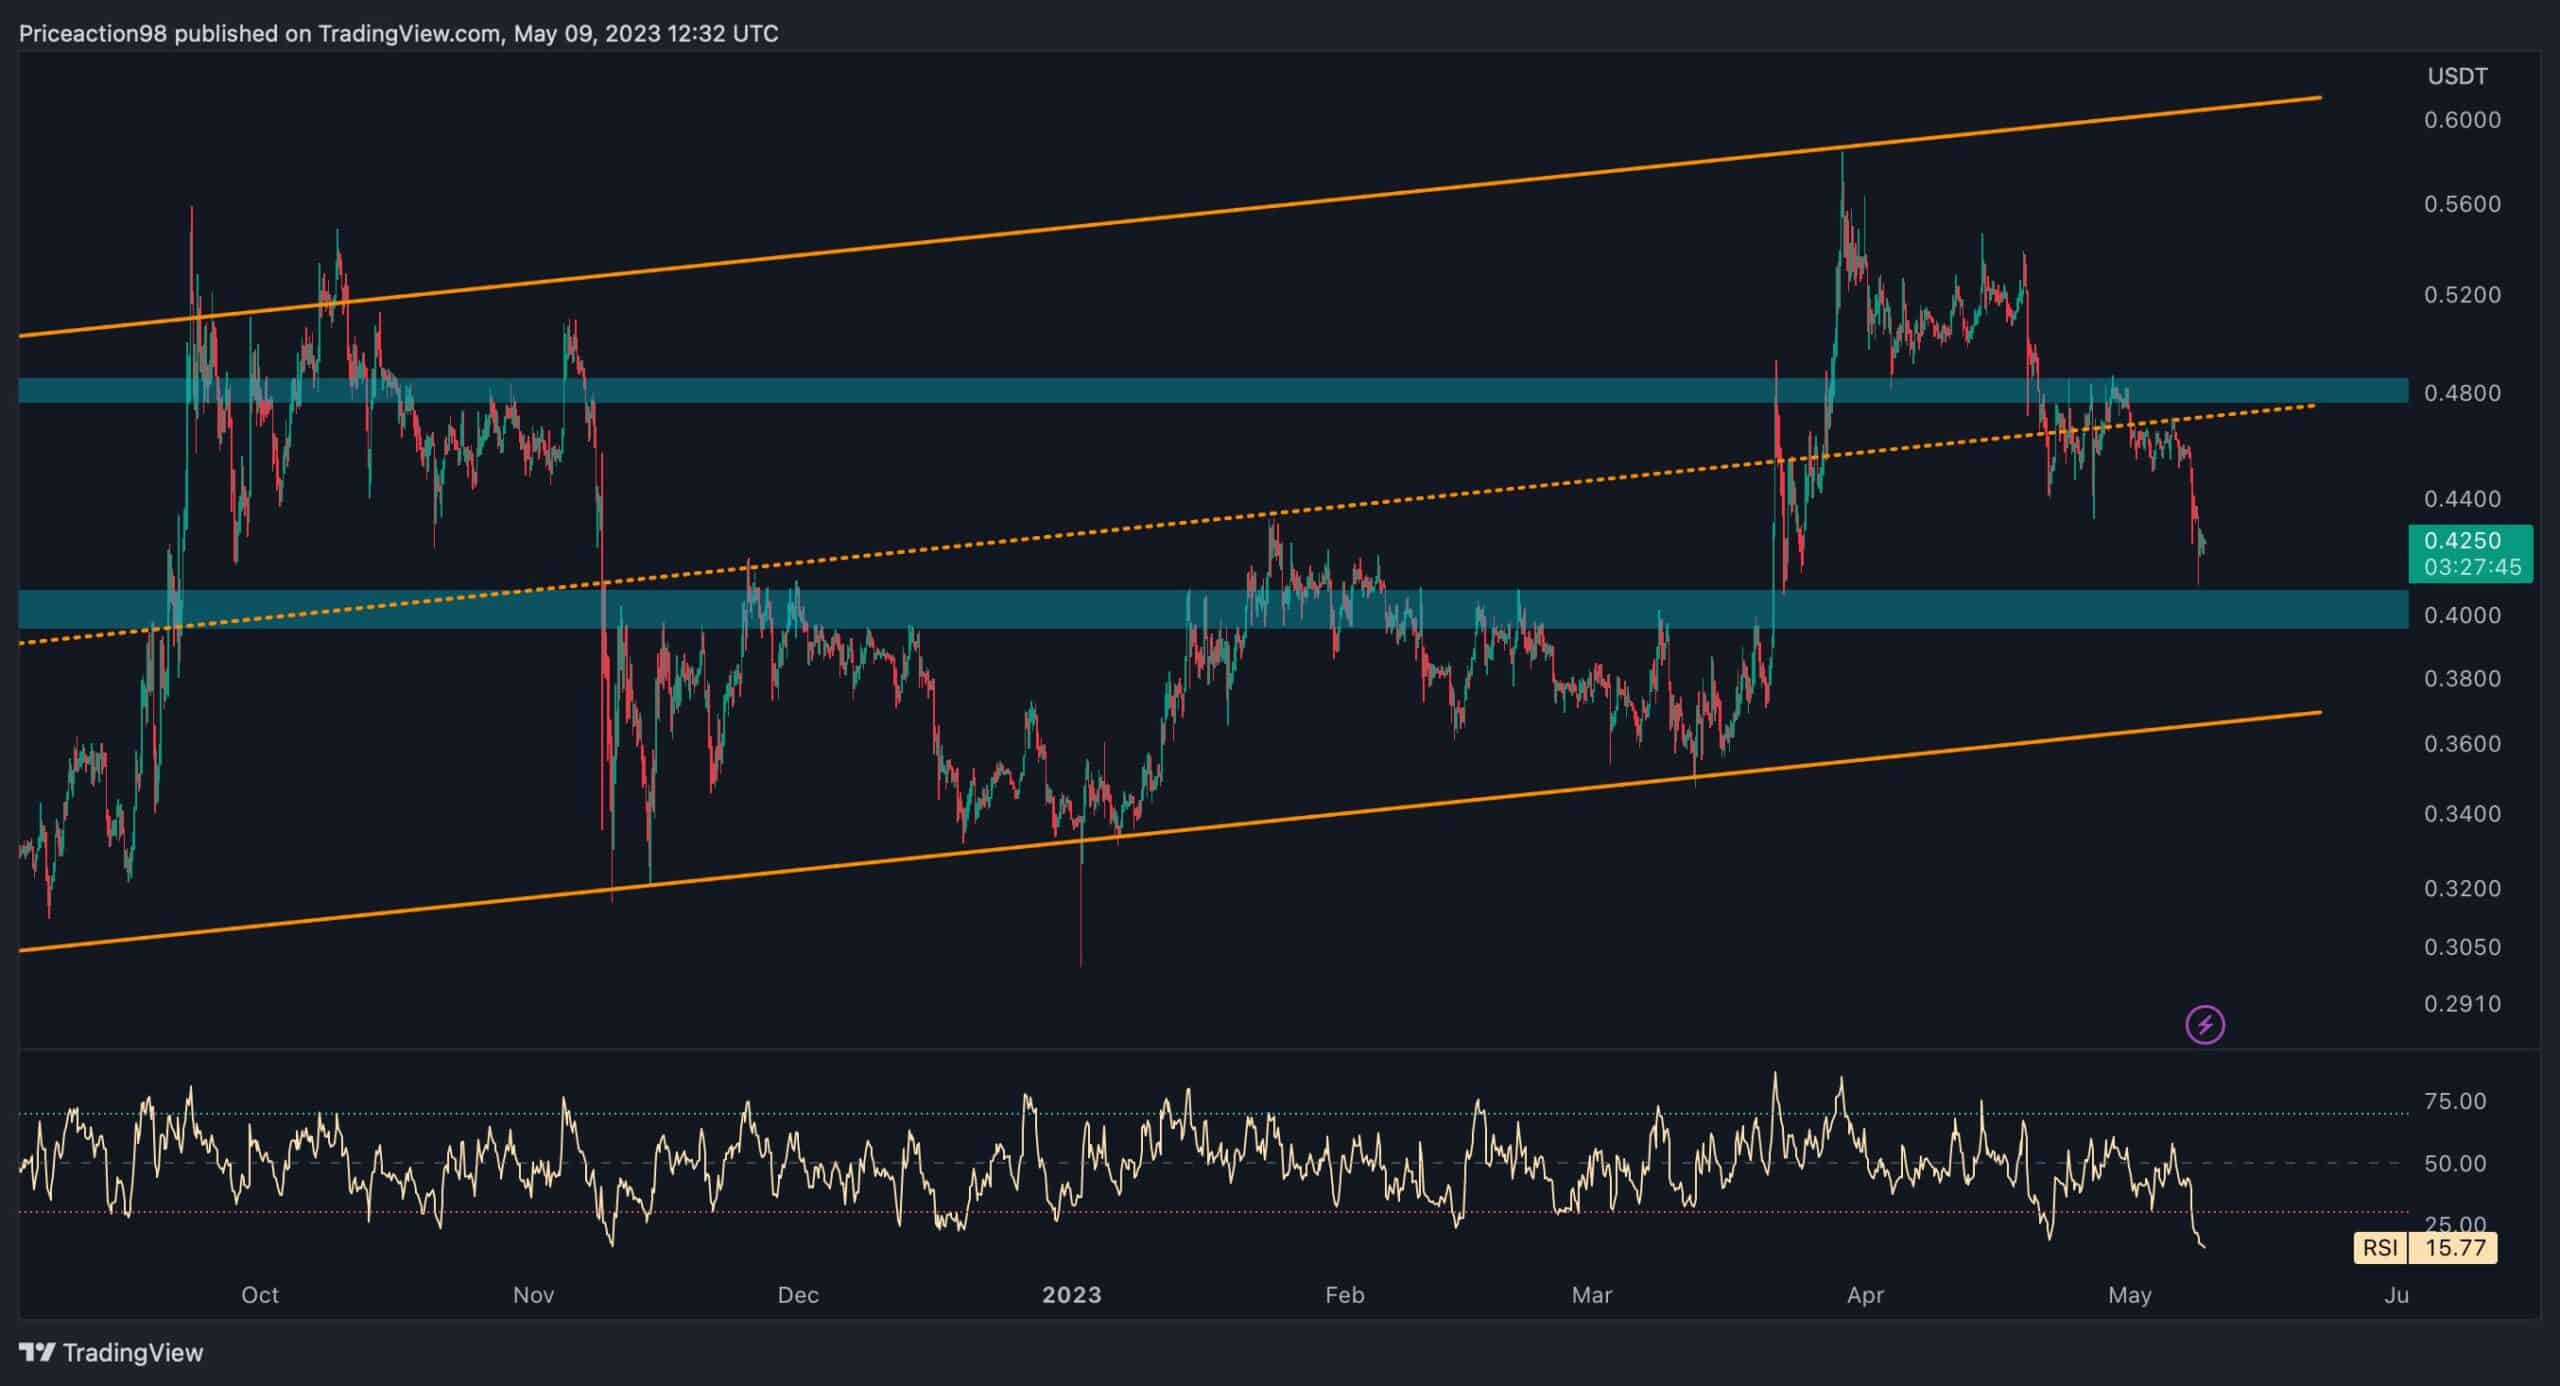
The 4-Hour Chart
On the 4-hour chart, Ripple’s price has formed an ascending channel. The recent rejection caused it to drop below the minor support level of $0.48 and the channel’s mid-trend line. Currently, XRP faces two crucial support levels: the primary one of $0.4 and the channel’s lower trendline, approximately at $0.37.
In summary, based on the recent action, the price seems more likely to remain within the range of $0.4 and $0.48 until a breakout occurs.