After a period of steady price movements, Ripple has finally moved – toward a bearish trajectory. This decline has led to a breakdown below a critical support zone defined by the 200-day moving average. Technical Analysis By Shayan The Daily Chart A closer look at the daily chart shows a notable drop in XRP price due to elevated selling pressure and an increasing bearish sentiment. The price slipped beneath the crucial 100-day MA at %excerpt%.55, reaching the 200-day moving average at %excerpt%.5. This downward movement has disrupted the bullish trend, resulting in a rejection. However, a sudden rebound pushed the price back above the 200-day moving average (the Grayscale’s win over the SEC pump), only to reencounter rejection, leading to another dip below the significant MA. This
Topics:
CryptoVizArt considers the following as important: Ripple (XRP) Price, XRP Analysis, xrpbtc, xrpusd
This could be interesting, too:
Jordan Lyanchev writes Ripple’s (XRP) Surge to Triggers Over Million in Short Liquidations
Jordan Lyanchev writes Trump Confirms Work on Strategic Crypto Reserve: XRP, ADA, SOL Included
Dimitar Dzhondzhorov writes Is a Major Ripple v. SEC Lawsuit Development Expected This Week? Here’s Why
Mandy Williams writes Ripple Releases Institutional DeFi Roadmap for XRP Ledger in 2025
After a period of steady price movements, Ripple has finally moved – toward a bearish trajectory. This decline has led to a breakdown below a critical support zone defined by the 200-day moving average.
Technical Analysis
By Shayan
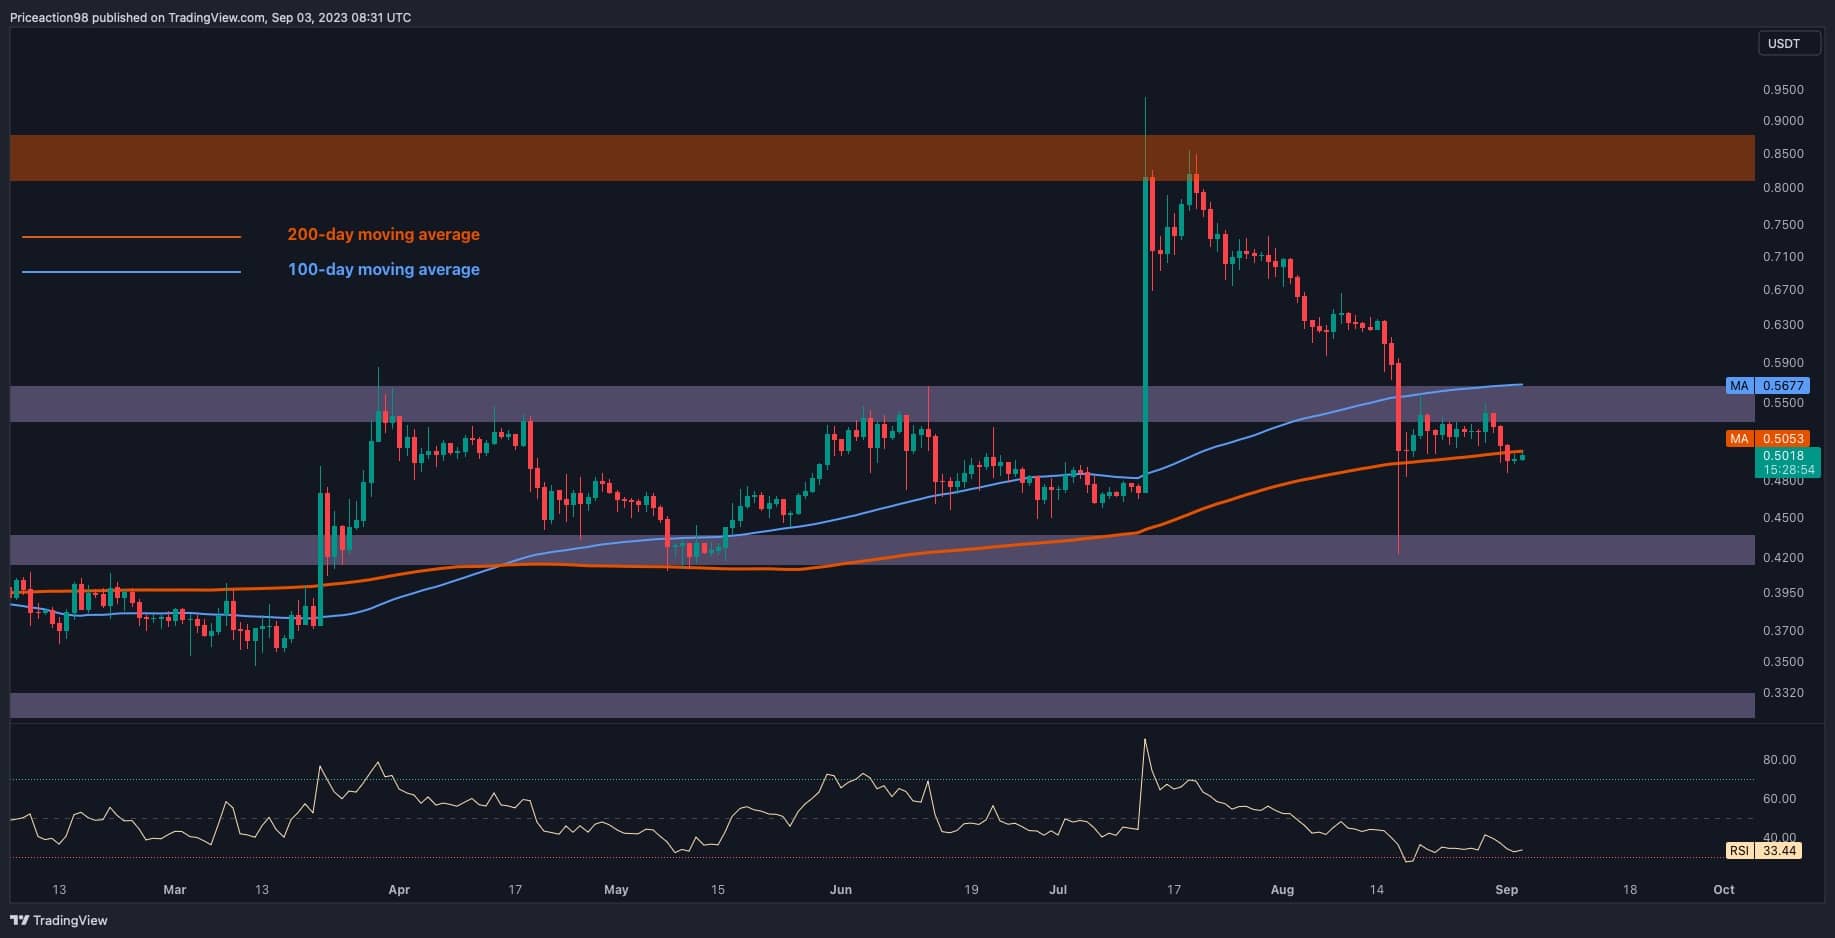
The Daily Chart
A closer look at the daily chart shows a notable drop in XRP price due to elevated selling pressure and an increasing bearish sentiment.
The price slipped beneath the crucial 100-day MA at $0.55, reaching the 200-day moving average at $0.5. This downward movement has disrupted the bullish trend, resulting in a rejection.
However, a sudden rebound pushed the price back above the 200-day moving average (the Grayscale’s win over the SEC pump), only to reencounter rejection, leading to another dip below the significant MA. This particular support area carries substantial weight, and if support holds, it has the potential to halt further declines.
Nevertheless, a breakdown below the 200-day MA, followed by a subsequent pullback, could signal the beginning of a medium to long-term bearish trend.
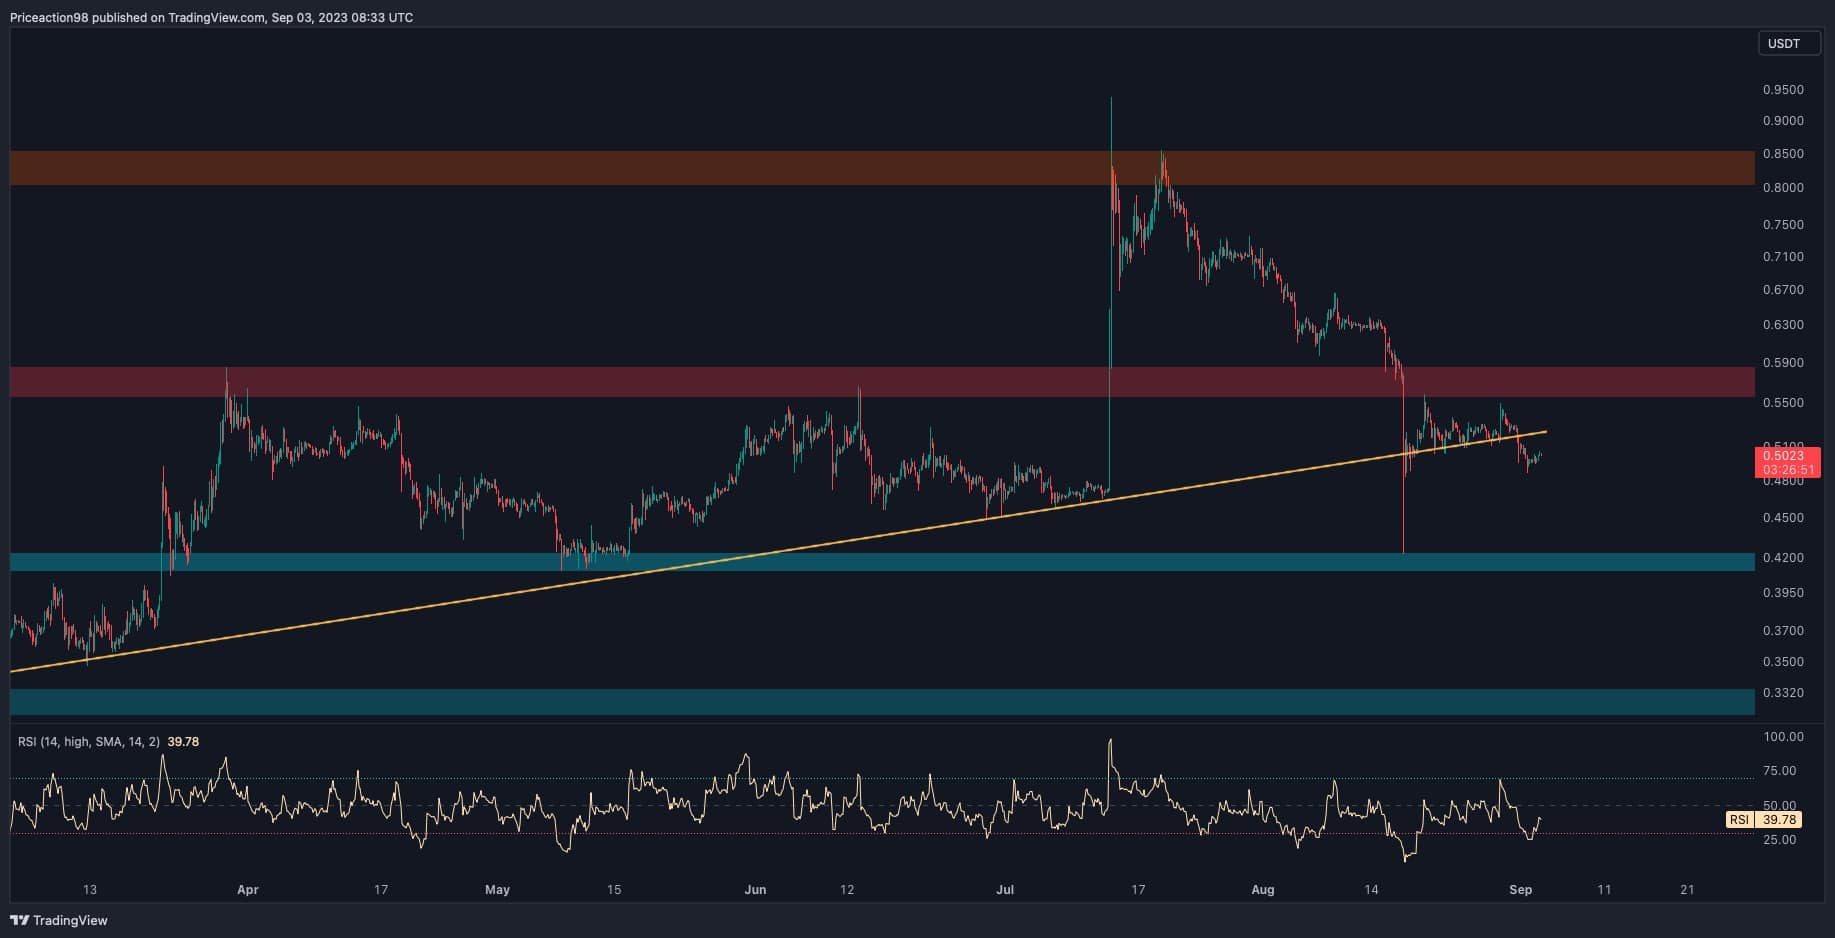
The 4-Hour Chart
Although the price initially found support upon reaching this pivotal trendline and produced a modest recovery, it ultimately faced rejection, leading to a break beneath this supportive trendline.
Nonetheless, this breakout will only be confirmed once the price retraces to retest the broken trendline and forms a pullback. Such a scenario could potentially drive the price towards lower thresholds, with the likelihood of a drop towards the static support at $0.42 increasing.
Conversely, if buyers effectively maintain the price in the area of this pivotal trendline, the breakout may be considered a false alarm, possibly triggering a new rally toward the $0.85 mark.
Regardless of the outcome, continuous caution in monitoring price fluctuations remains crucial, as the interplay between support and resistance levels is poised to significantly impact Ripple’s immediate price trajectory.