Ethereum’s recent market performance has seen an unexpected and sharp rejection from the .8K resistance level, triggering a significant downward trend that broke down both the pivotal 100-day and 200-day moving averages. This development is a clear, bearish signal for Ethereum’s mid-term prospects. Technical Analysis By Shayan The Daily Chart Following a notable drop from the critical .8K resistance zone, Ethereum’s price dipped below the critical 100-day and 200-day moving averages, roughly around the .8K mark. Yet, the price ultimately found support at a significant level of .6K, initiating a bounce. This support zone holds precise significance as it’s also the 61.6% Fibonacci retracement level, corresponding to the recent impulsive upward move towards the .1K
Topics:
CryptoVizArt considers the following as important: ETH Analysis, ETHBTC, Ethereum (ETH) Price, ethusd
This could be interesting, too:
Mandy Williams writes Ethereum Derivatives Metrics Signal Modest Downside Tail Risk Ahead: Nansen
Jordan Lyanchev writes Weekly Bitcoin, Ethereum ETF Recap: Light at the End of the Tunnel for BTC
CryptoVizArt writes Will Weak Momentum Drive ETH to .5K? (Ethereum Price Analysis)
Jordan Lyanchev writes Bybit Hack Fallout: Arthur Hayes, Samson Mow Push for Ethereum Rollback
Ethereum’s recent market performance has seen an unexpected and sharp rejection from the $1.8K resistance level, triggering a significant downward trend that broke down both the pivotal 100-day and 200-day moving averages. This development is a clear, bearish signal for Ethereum’s mid-term prospects.
Technical Analysis
By Shayan
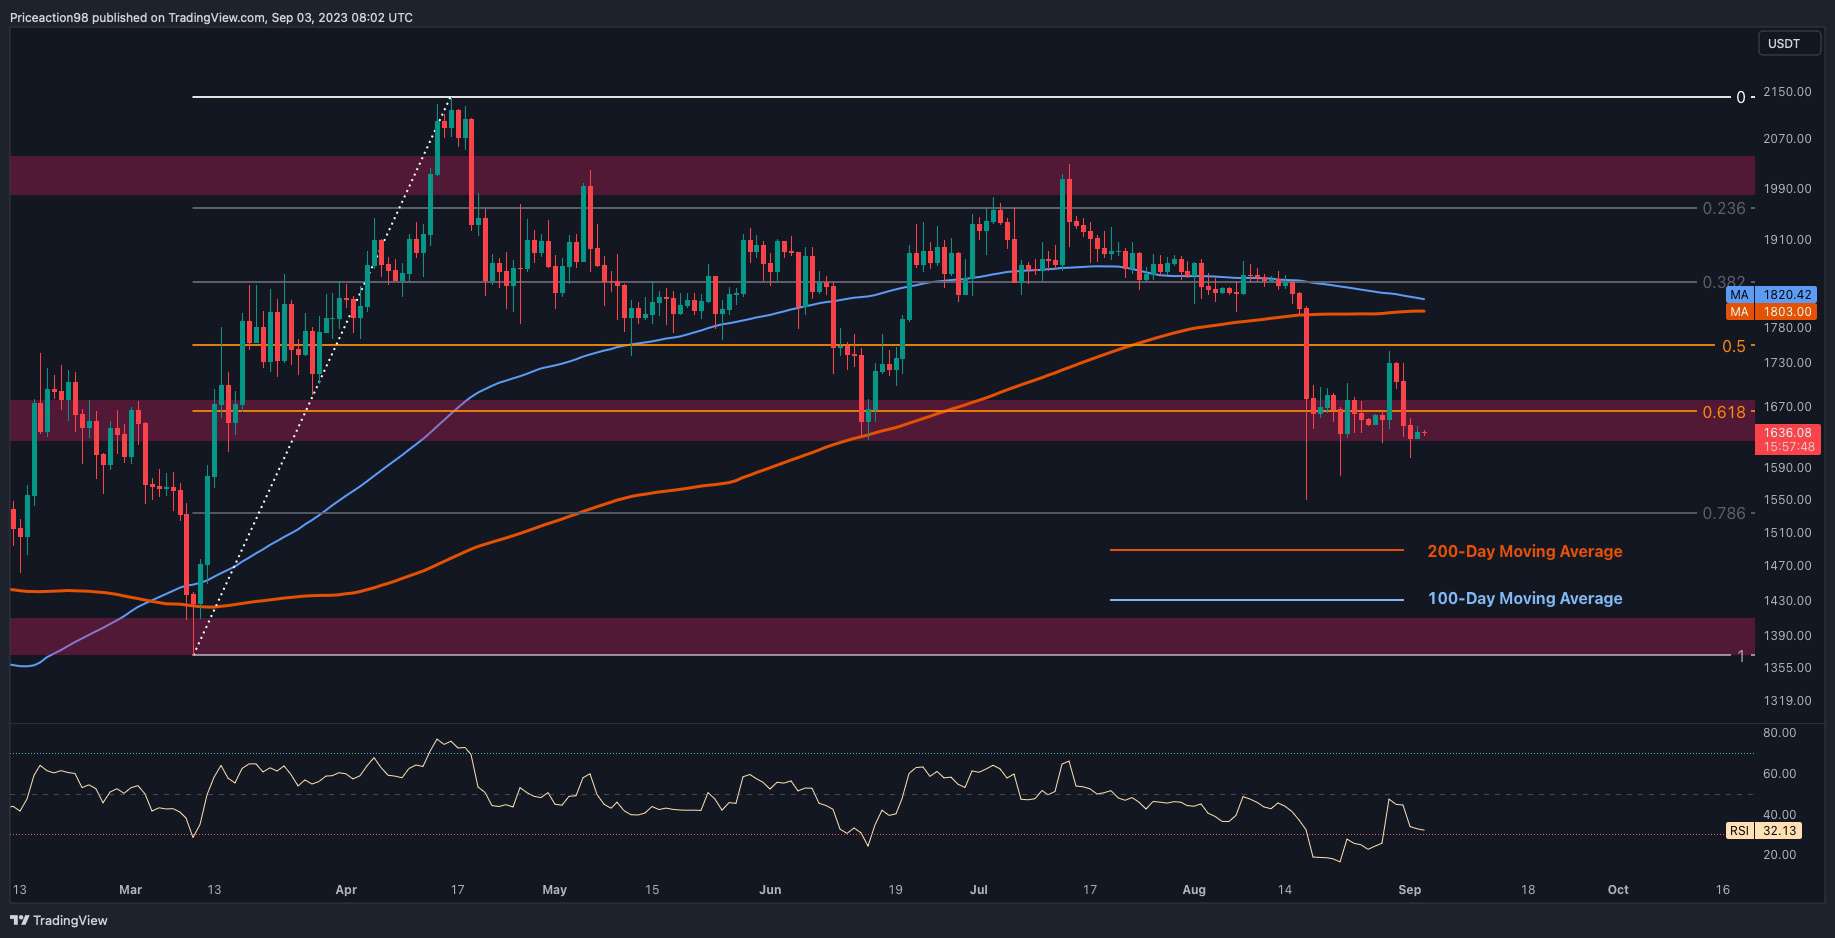
The Daily Chart
Following a notable drop from the critical $1.8K resistance zone, Ethereum’s price dipped below the critical 100-day and 200-day moving averages, roughly around the $1.8K mark. Yet, the price ultimately found support at a significant level of $1.6K, initiating a bounce.
This support zone holds precise significance as it’s also the 61.6% Fibonacci retracement level, corresponding to the recent impulsive upward move towards the $2.1K mark in early March.
However, this initial rebound was followed by another impulsive downward movement, again touching the crucial support zone at $1.6K. While this price action does indicate a noticeable bearish sentiment in the market, it’s essential to recognize that the potential revival of support could set the stage for another possible bullish bounce.
Such a rebound could potentially shift the market into a consolidation phase. Contrarily, if the price drops below the $1.6K mark, the possibility of a bearish cascade becomes increasingly likely.
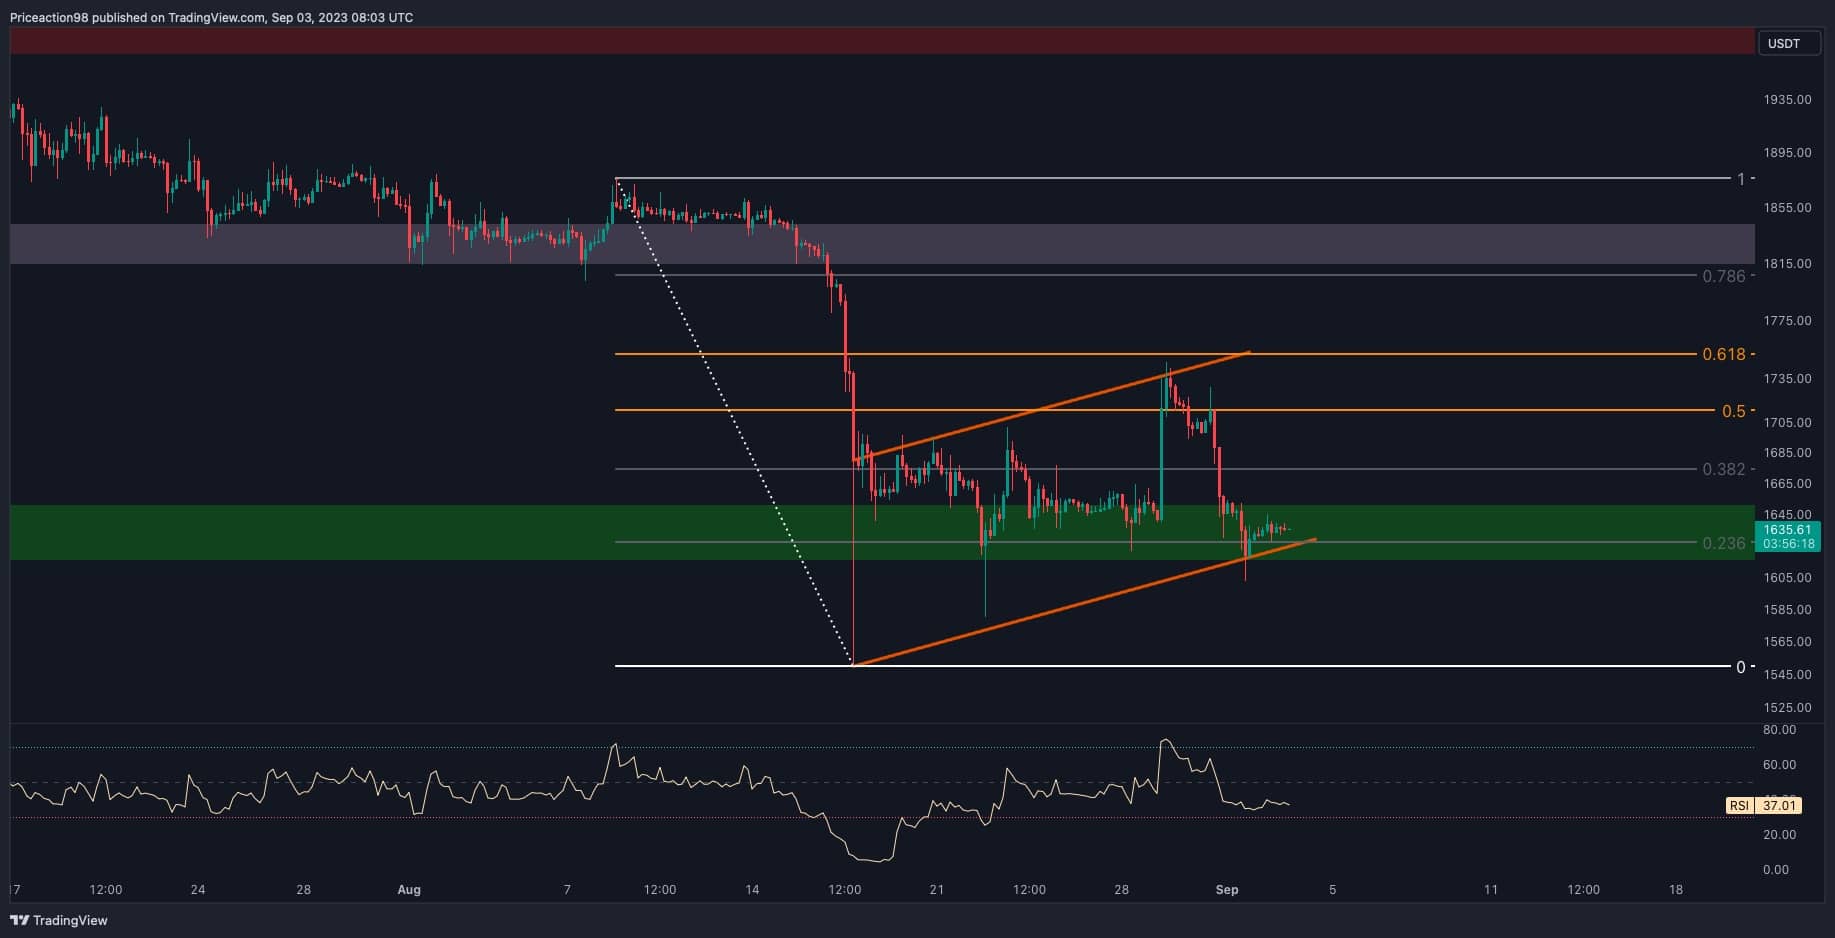
The 4-Hour Chart
Looking at the 4-hour timeframe, it becomes evident that the downward trajectory was momentarily halted when Ethereum reached the substantial $1.6K support region. This indecision led to a brief consolidation phase marked by low volatility. However, the price experienced a sudden surge (the Grayscale pump), marked by the emergence of a substantial green candle.
However, buying pressure weakened as the price ascended and approached the critical 61.8% Fibonacci retracement level, prompting a reversal. Consequently, the price embarked on another impulsive retracement, driving it back towards the $1.6K range. Furthermore, Ethereum has formed a bearish continuation flag pattern, and it is currently attempting to breach the lower boundary of this pattern.
Because the $1.6K threshold holds significant psychological importance, if sellers successfully push the price below this critical level, the market could potentially witness another quick and steep plummet toward lower price thresholds.
On-chain Analysis
By Shayan
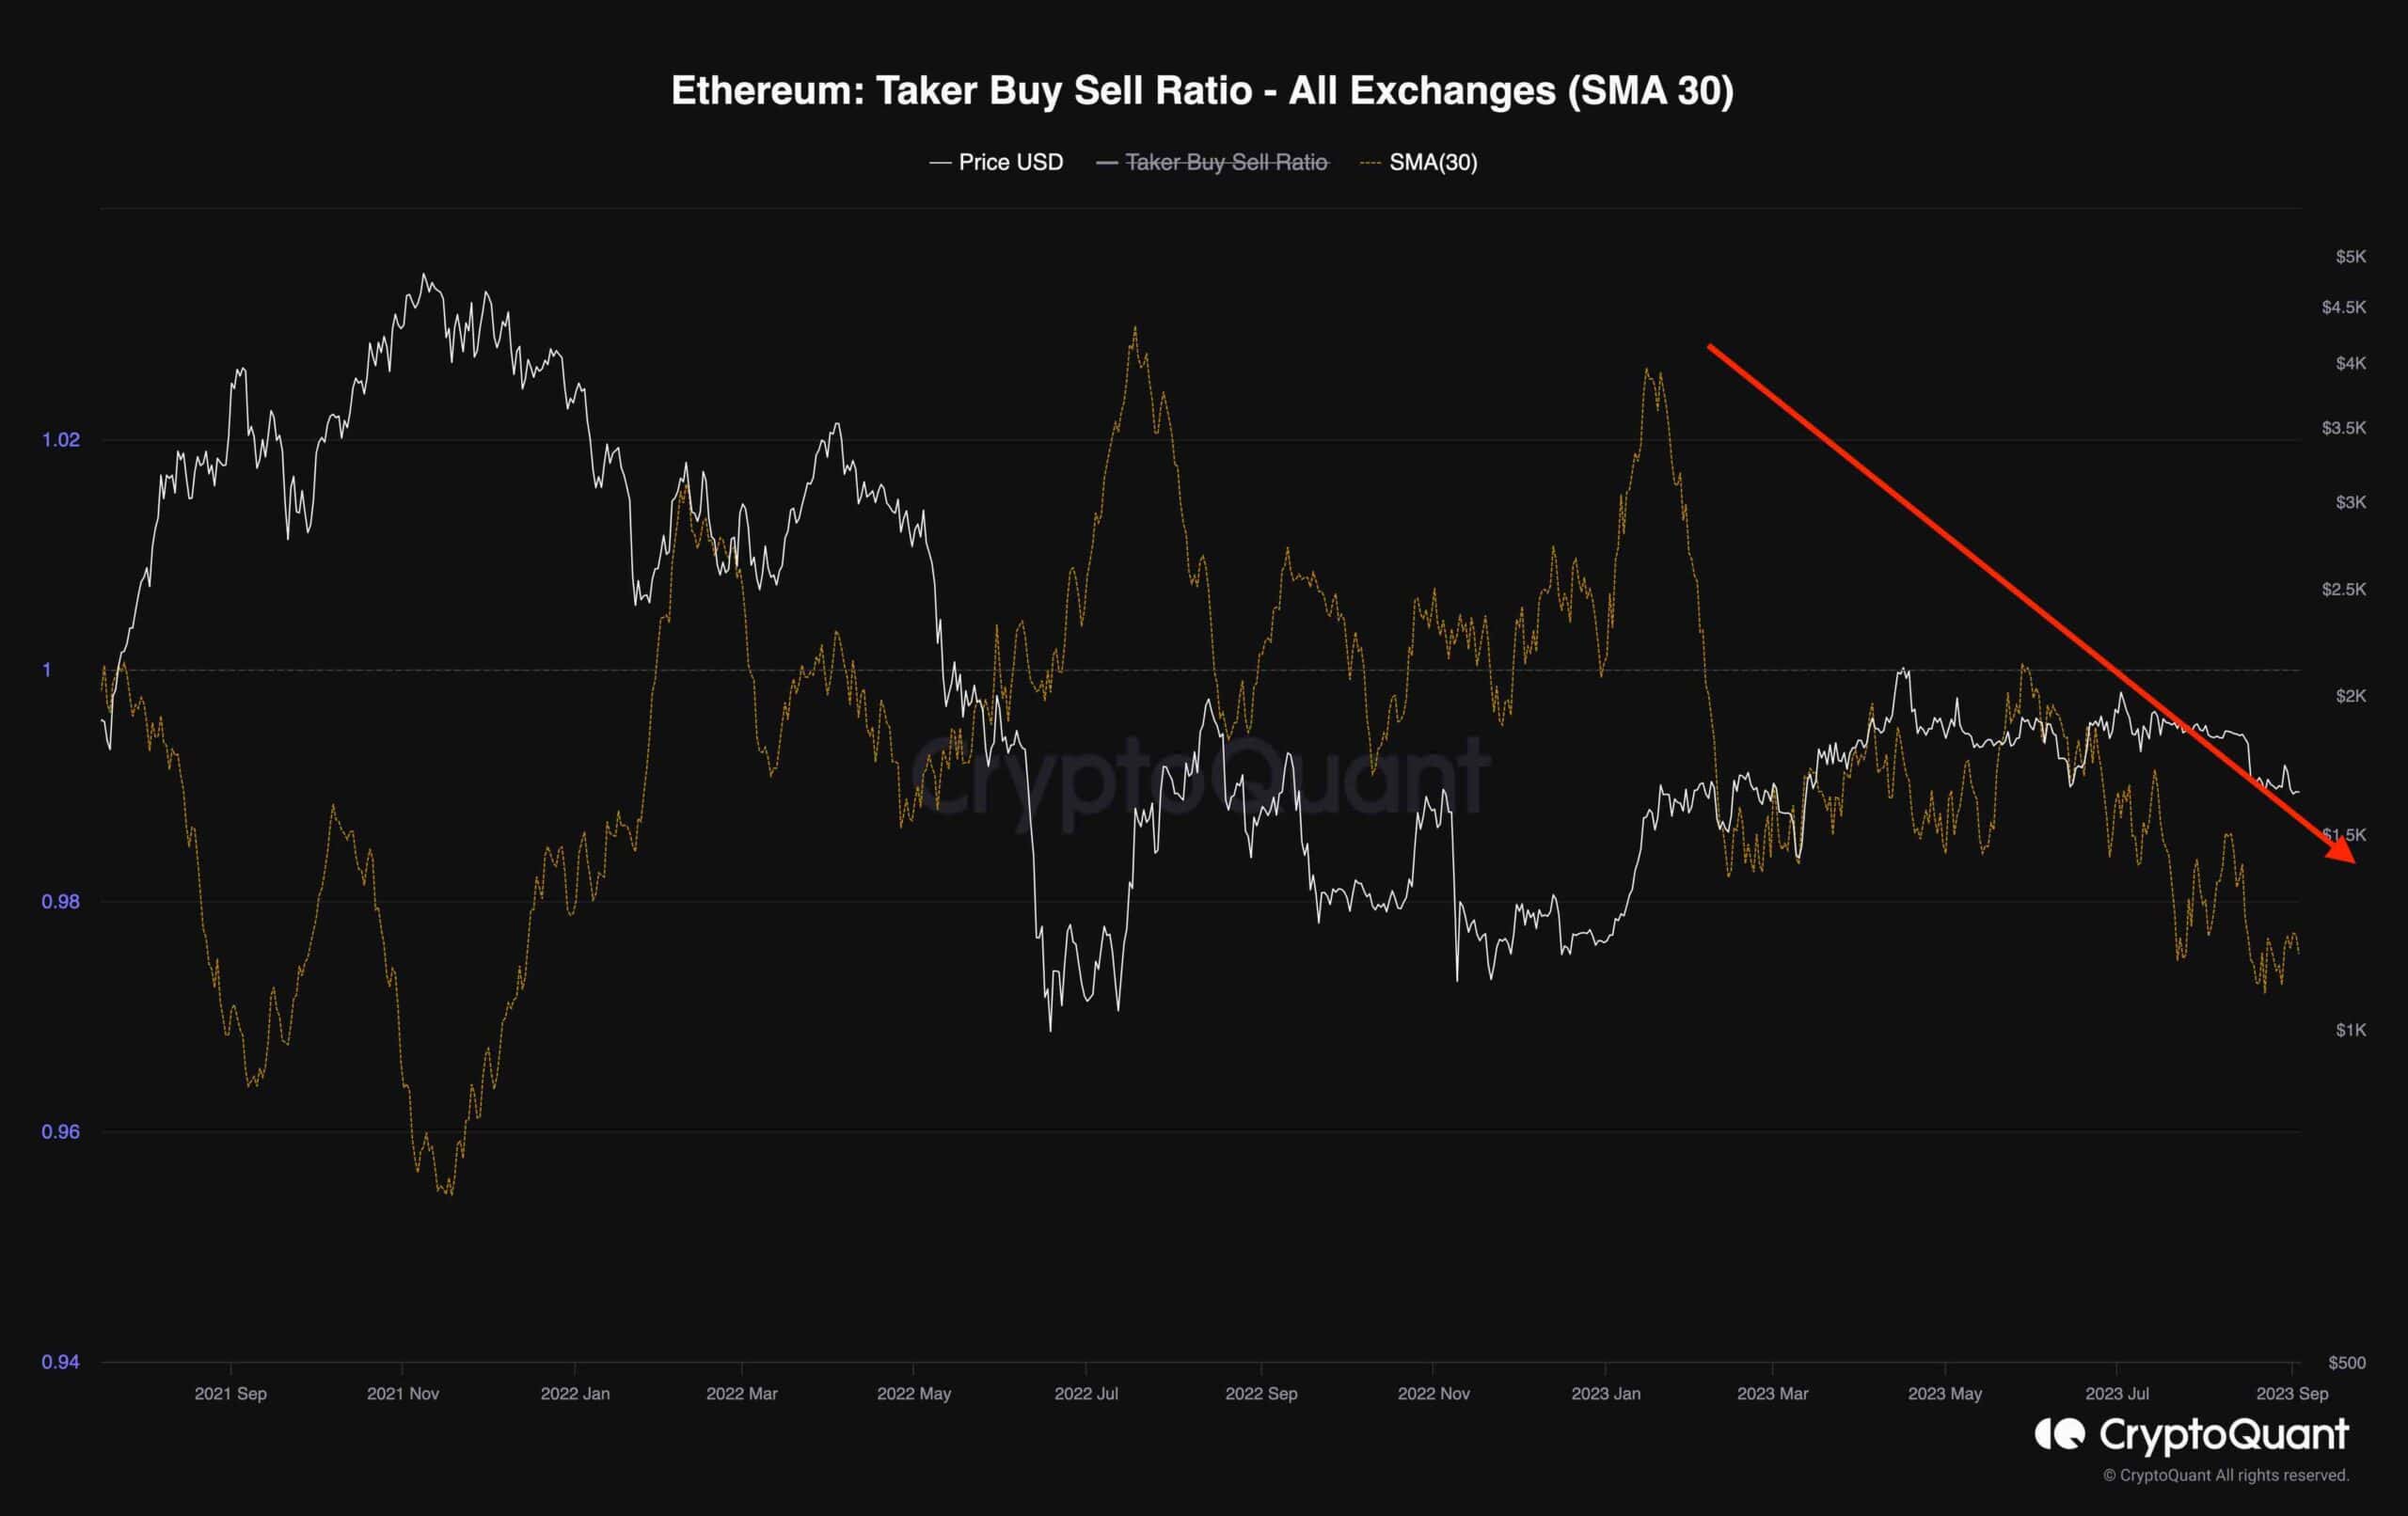
The current Ethereum price action showcases a robust downtrend, a notable exit from the weeks of consolidation within a narrow price range. To gain deeper insights into the market sentiment, examining futures market metrics is essential.
This particular chart shows the 30-day moving average of the taker buy-sell ratio metric, a key indicator revealing the relative aggressiveness of buyers versus sellers in executing their orders. When this metric records values above 1, it signifies a bullish sentiment, whereas values below 1 indicate a bearish sentiment prevailing in the market.
The chart illustrates the downward trajectory of the taker buy-sell ratio over the past few months. It consistently fluctuates below the pivotal one mark, reaching a yearly low. This behavior underscores the dominant bearish sentiment among futures traders participating in Ethereum’s market.
As long as this prevailing trend remains unaltered, the probability of witnessing further bearish price movements remains high. For Ethereum’s price to initiate a new rally, it would necessitate a shift in behavior among futures traders, specifically characterized by a more aggressive buying stance. This shift would be noticeable when the metric rises above the critical 1 threshold.