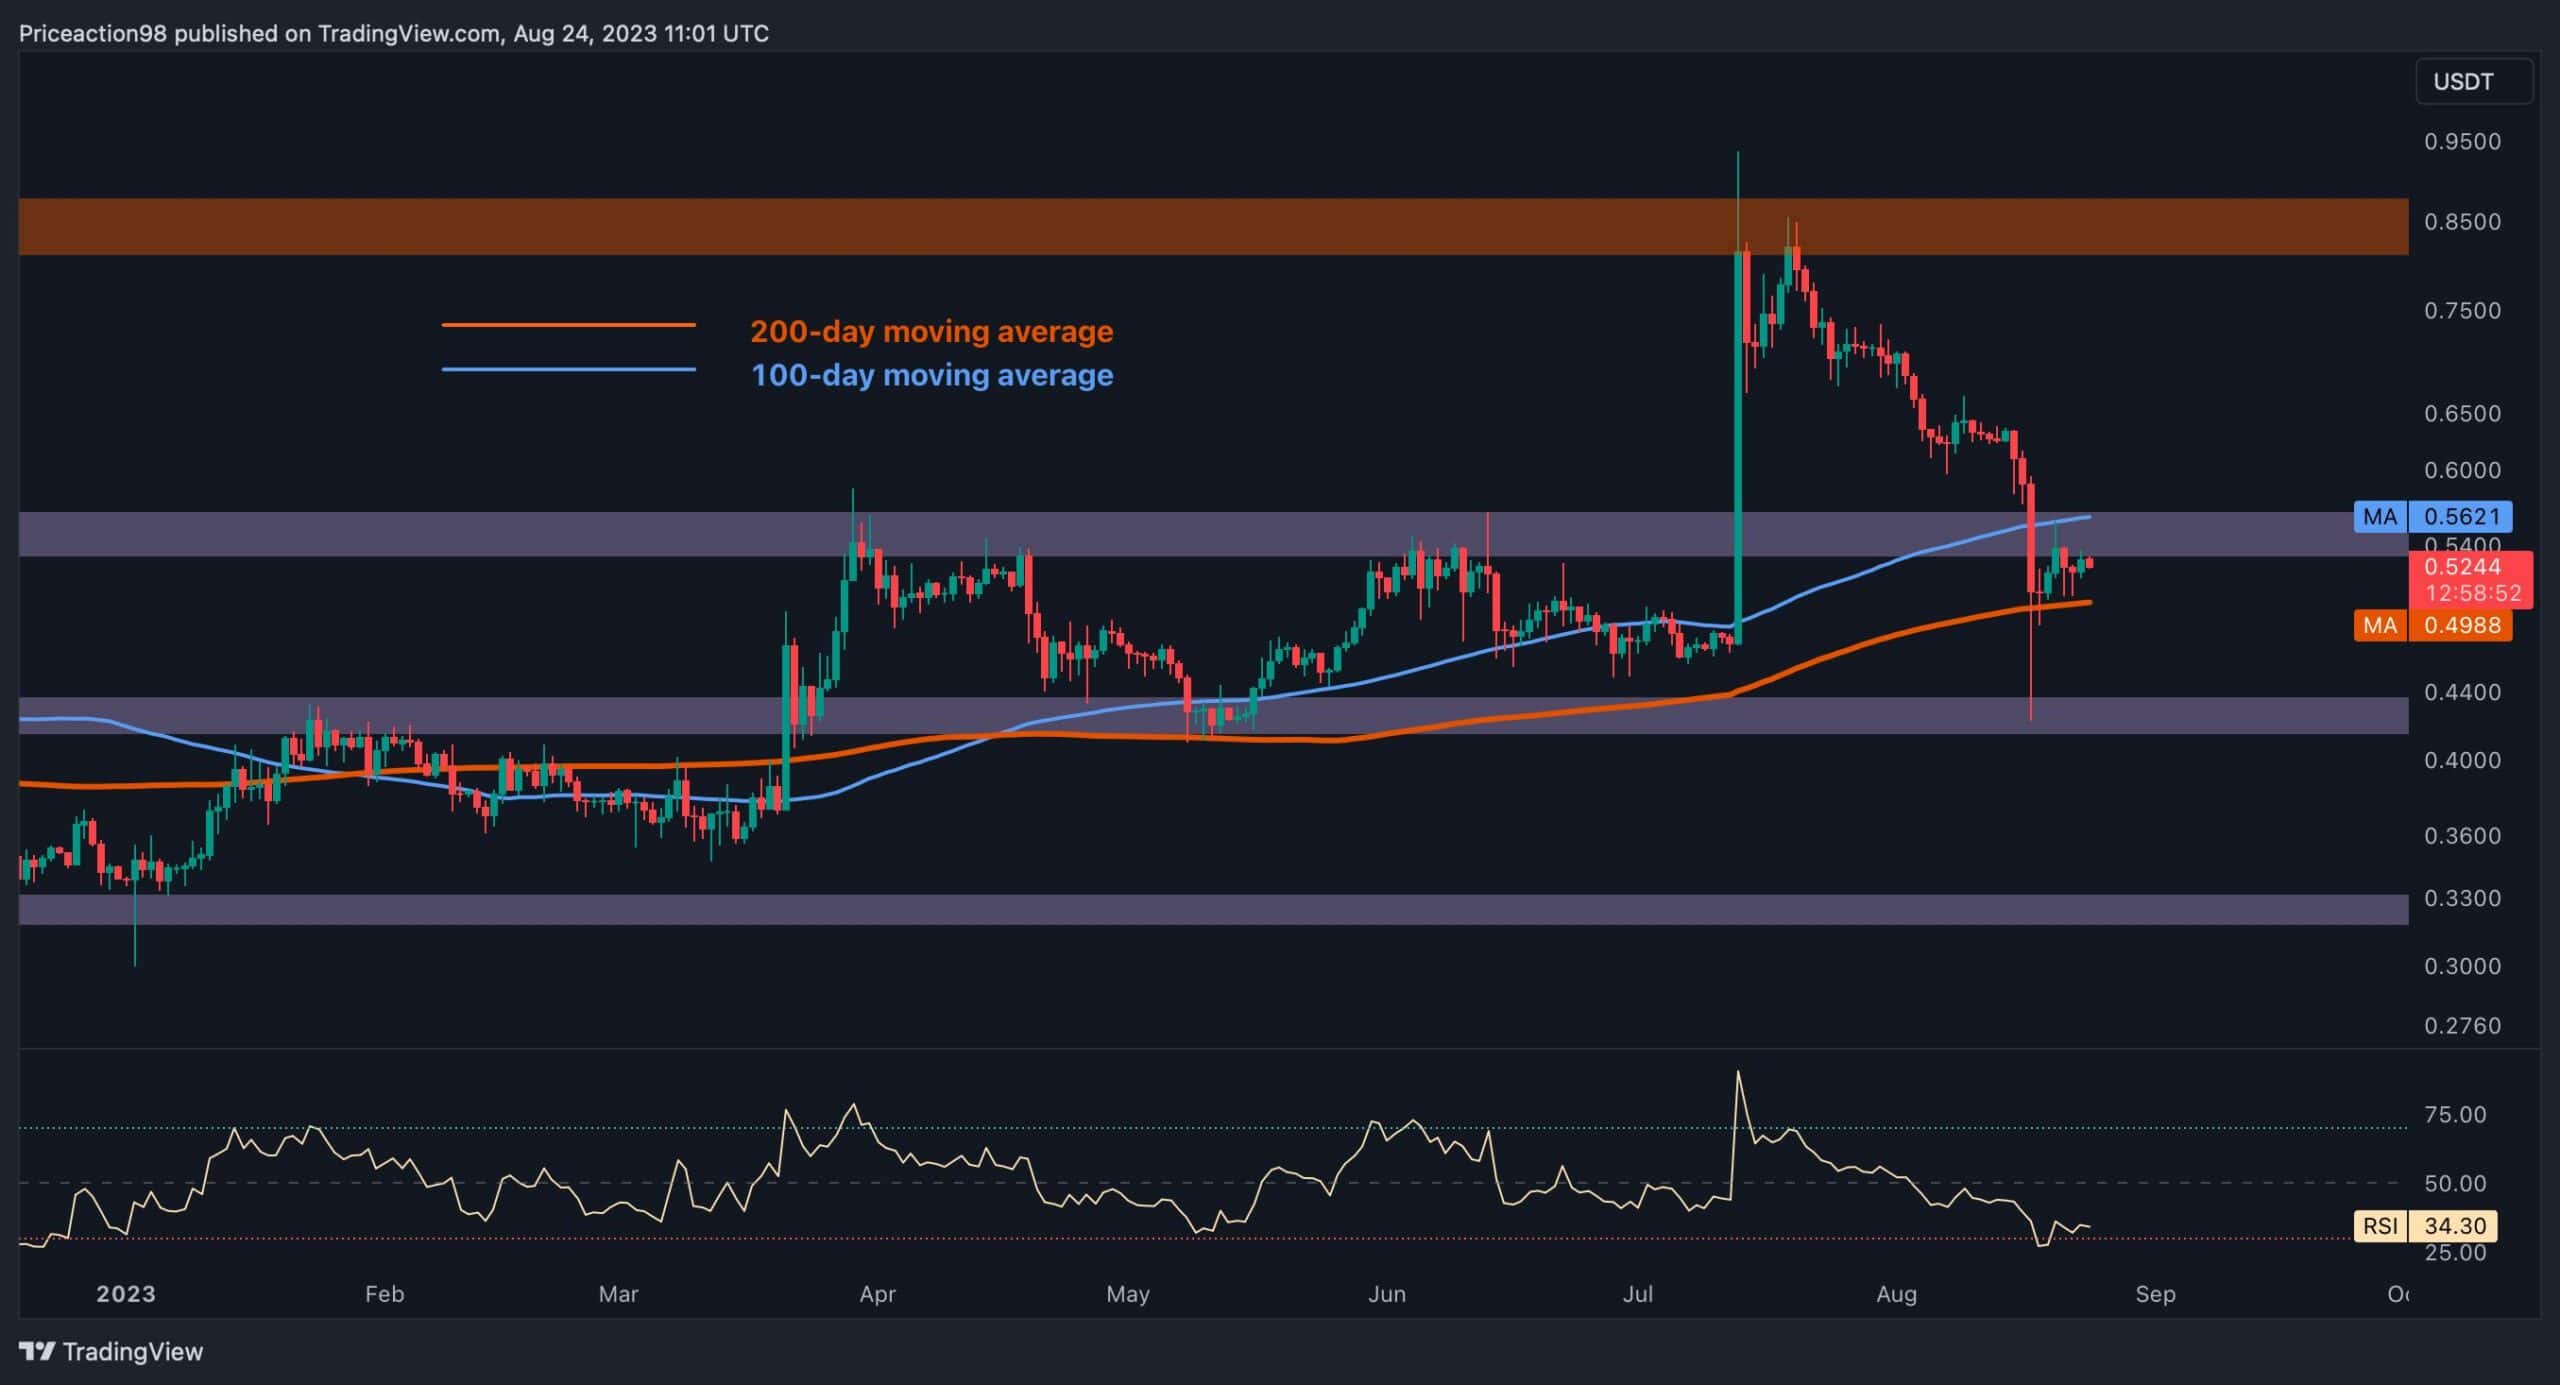
Ripple’s price movement has been relatively stagnant, following a cascading downward trend. This decline led the price to a robust support area represented by the 200-day moving average. Technical Analysis By Shayan The Daily Chart Looking at the daily chart, the increased selling pressure and bearish sentiment are evident, resulting in a significant price decrease. This downward movement has disrupted the previous bullish trend and led to an extended rejection. Consequently, the price fell below the 100-day and 200-day moving averages, respectively, at %excerpt%.55 and %excerpt%.49. However, a sudden rebound occurred at the approximate %excerpt%.42 support level, pushing the price above the 200-day moving average again. This support zone serves as a substantial level and has the potential to
Topics:
CryptoVizArt considers the following as important: Ripple (XRP) Price, XRP Analysis, xrpbtc, xrpusd
This could be interesting, too:
Jordan Lyanchev writes Ripple’s (XRP) Surge to Triggers Over Million in Short Liquidations
Jordan Lyanchev writes Trump Confirms Work on Strategic Crypto Reserve: XRP, ADA, SOL Included
Dimitar Dzhondzhorov writes Is a Major Ripple v. SEC Lawsuit Development Expected This Week? Here’s Why
Mandy Williams writes Ripple Releases Institutional DeFi Roadmap for XRP Ledger in 2025
Ripple’s price movement has been relatively stagnant, following a cascading downward trend. This decline led the price to a robust support area represented by the 200-day moving average.
Technical Analysis
By Shayan
The Daily Chart
Looking at the daily chart, the increased selling pressure and bearish sentiment are evident, resulting in a significant price decrease. This downward movement has disrupted the previous bullish trend and led to an extended rejection. Consequently, the price fell below the 100-day and 200-day moving averages, respectively, at $0.55 and $0.49.
However, a sudden rebound occurred at the approximate $0.42 support level, pushing the price above the 200-day moving average again. This support zone serves as a substantial level and has the potential to stop further declines and foster a brief period of consolidation.
The current price is bounded within a narrow range marked by the 100-day and 200-day moving averages. A breakout above this range could serve as an indicator of Ripple’s upcoming trajectory. This breakout might indicate either a corrective phase prior to a continuation of the downtrend or a reversal with an aim toward the resistance level at $0.85.
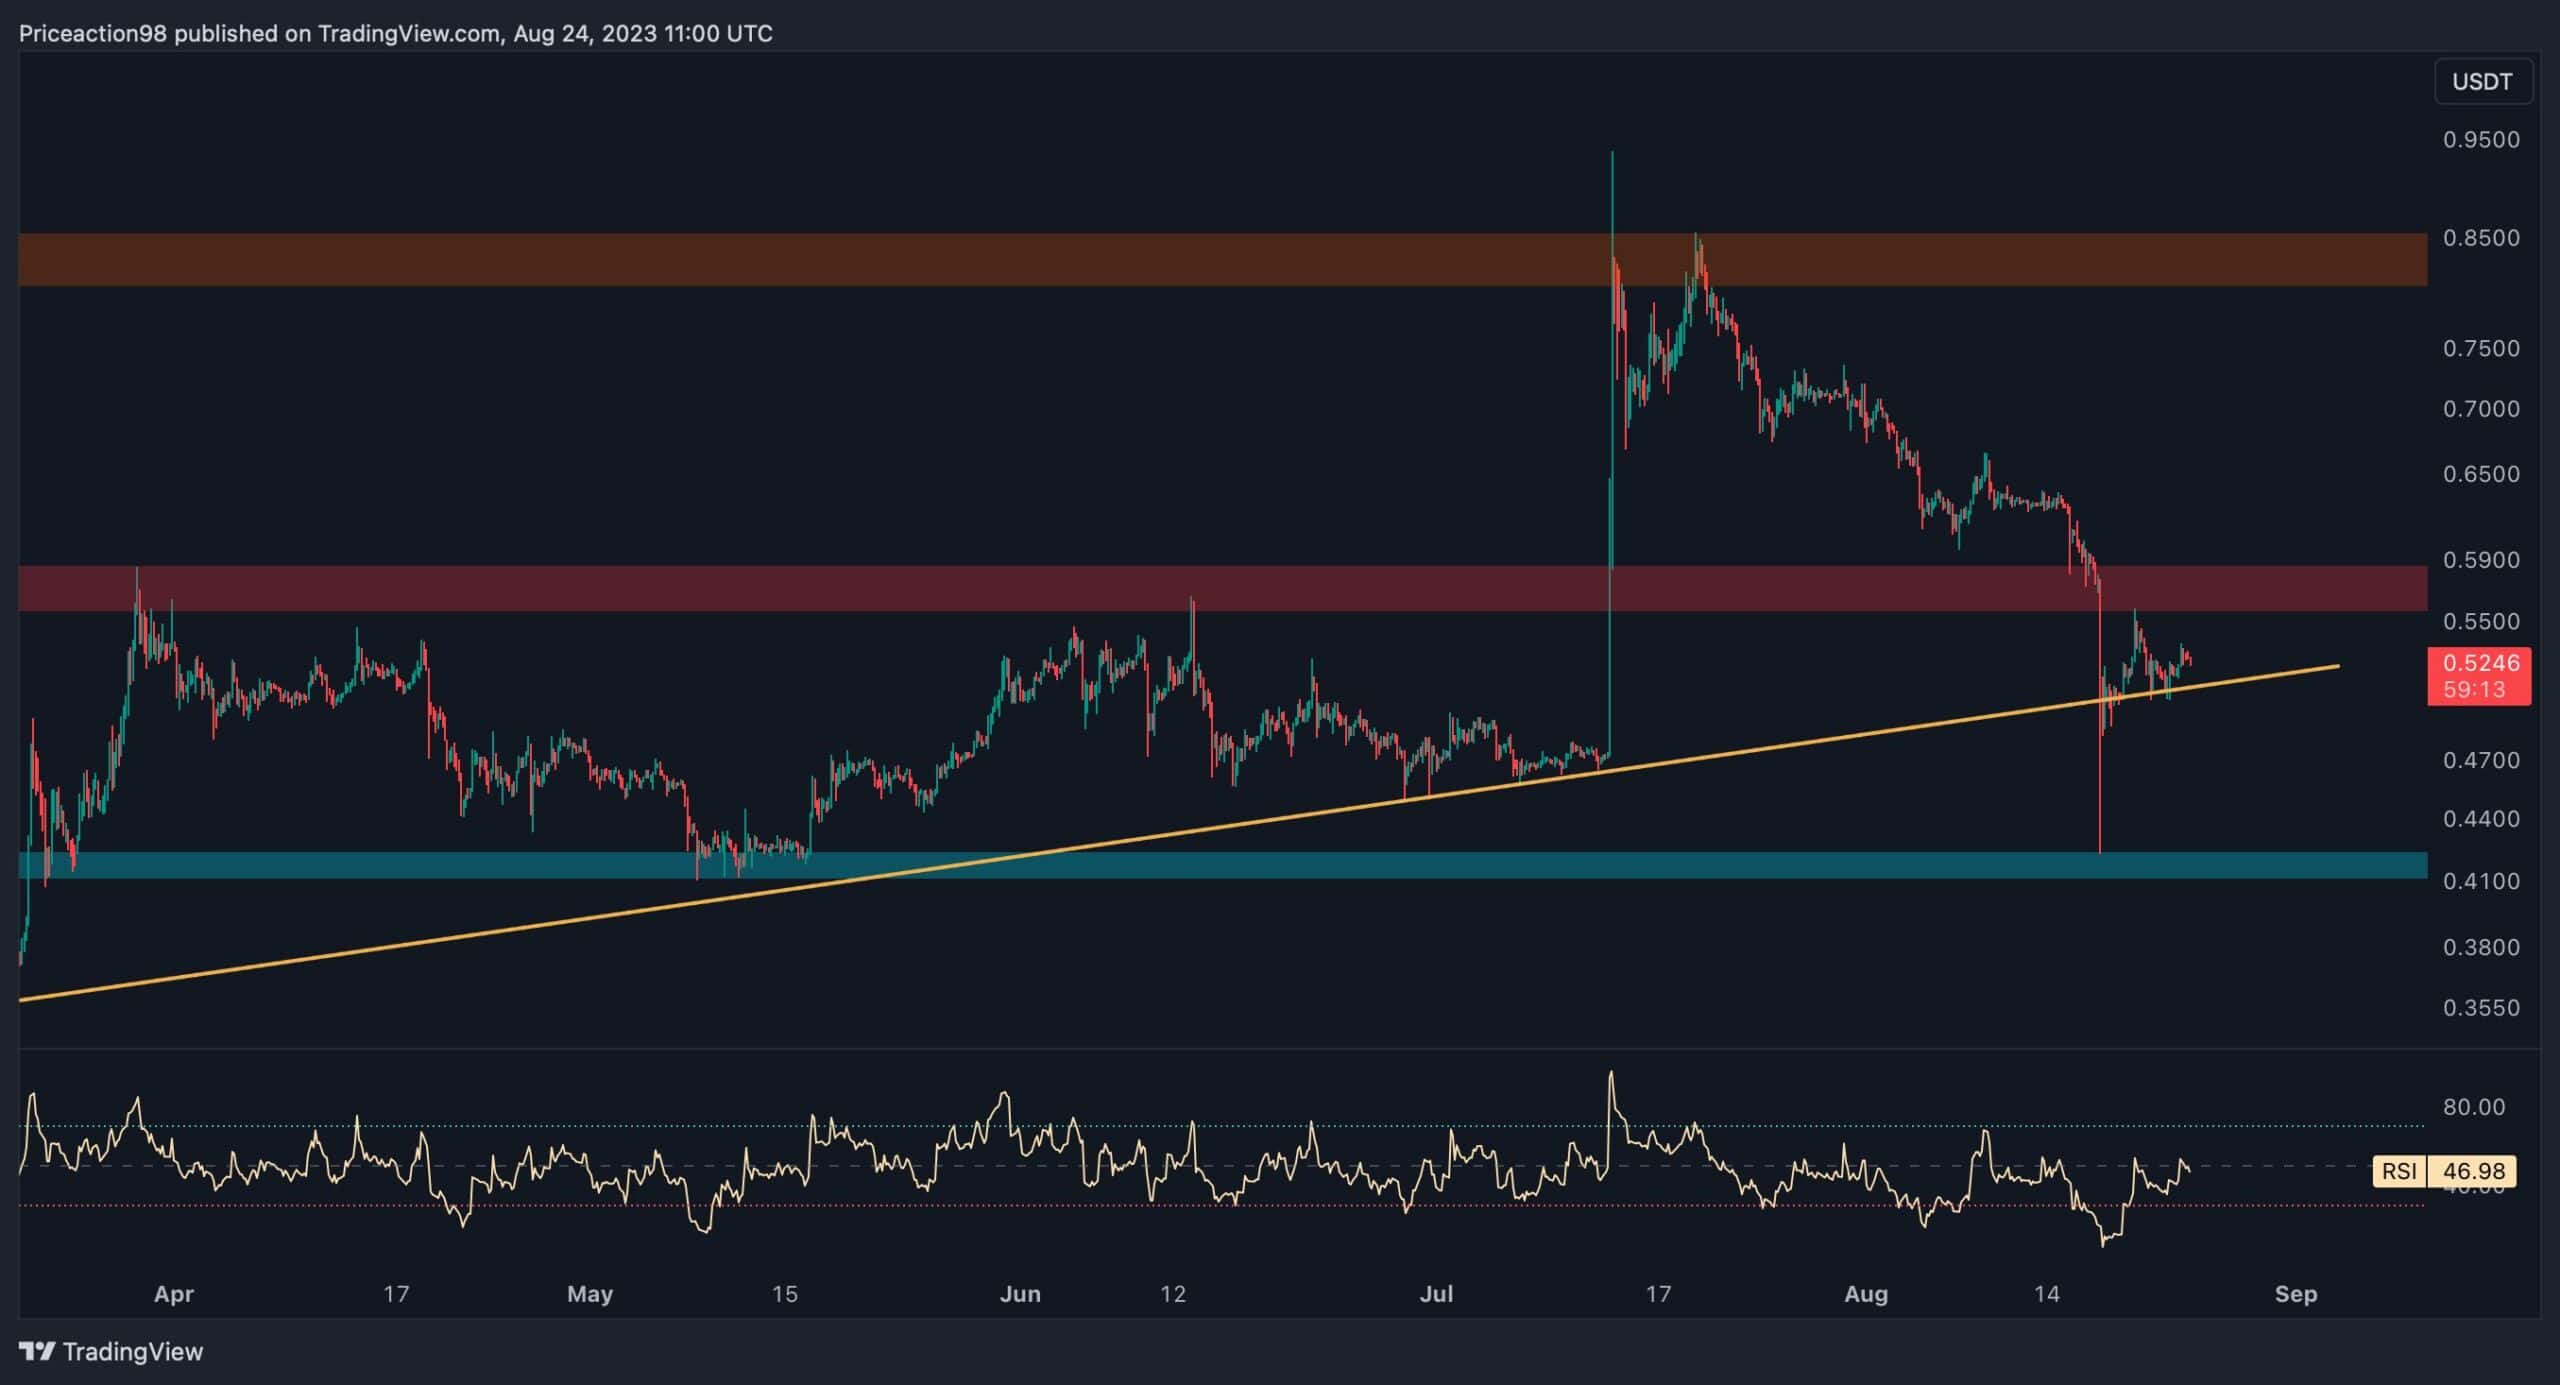
The 4-Hour Chart
Looking at the 4-hour chart, it becomes apparent that the recent decline caused a retracement toward a long-standing uptrend line, which has consistently provided strong support. Despite the price being supported upon reaching this pivotal trendline and experiencing a slight rebound, the possibility of further downward movement remains viable.
Such a scenario could push the price below this crucial dynamic support level. In this case, the price descending towards the static support at $0.42 becomes more likely.
Conversely, if buyers effectively maintain the price around this pivotal trendline, it could trigger a fresh surge towards the $0.85 mark. Regardless of the outcome, vigilantly monitoring price fluctuations is imperative. The interplay between the support and resistance levels will undoubtedly influence shaping the immediate course of Ripple’s price action.