Ripple’s price has been showing a slight uptrend, retracing toward the 200-day moving average on the daily chart. However, if the cryptocurrency successfully breaks above the 200-day moving average and the significant resistance zone at %excerpt%.55, the market will probably shift into a bullish trend. XRP Analysis By Shayan The Daily Chart Upon analyzing the daily chart, Ripple’s price experienced a notable rejection, leading to a phase of consolidation. It retraced slightly toward the 200-day moving average at %excerpt%.5223 and managed to reclaim it somewhat. The 200-day moving average is widely recognized as a strong resistance level. However, the price breaking above this level indicates the potential for a bullish reversal in the market, suggesting the possibility of further
Topics:
CryptoVizArt considers the following as important: Ripple (XRP) Price, XRP Analysis, xrpbtc, xrpusd
This could be interesting, too:
Jordan Lyanchev writes Ripple’s (XRP) Surge to Triggers Over Million in Short Liquidations
Jordan Lyanchev writes Trump Confirms Work on Strategic Crypto Reserve: XRP, ADA, SOL Included
Dimitar Dzhondzhorov writes Is a Major Ripple v. SEC Lawsuit Development Expected This Week? Here’s Why
Mandy Williams writes Ripple Releases Institutional DeFi Roadmap for XRP Ledger in 2025
Ripple’s price has been showing a slight uptrend, retracing toward the 200-day moving average on the daily chart.
However, if the cryptocurrency successfully breaks above the 200-day moving average and the significant resistance zone at $0.55, the market will probably shift into a bullish trend.
XRP Analysis
By Shayan
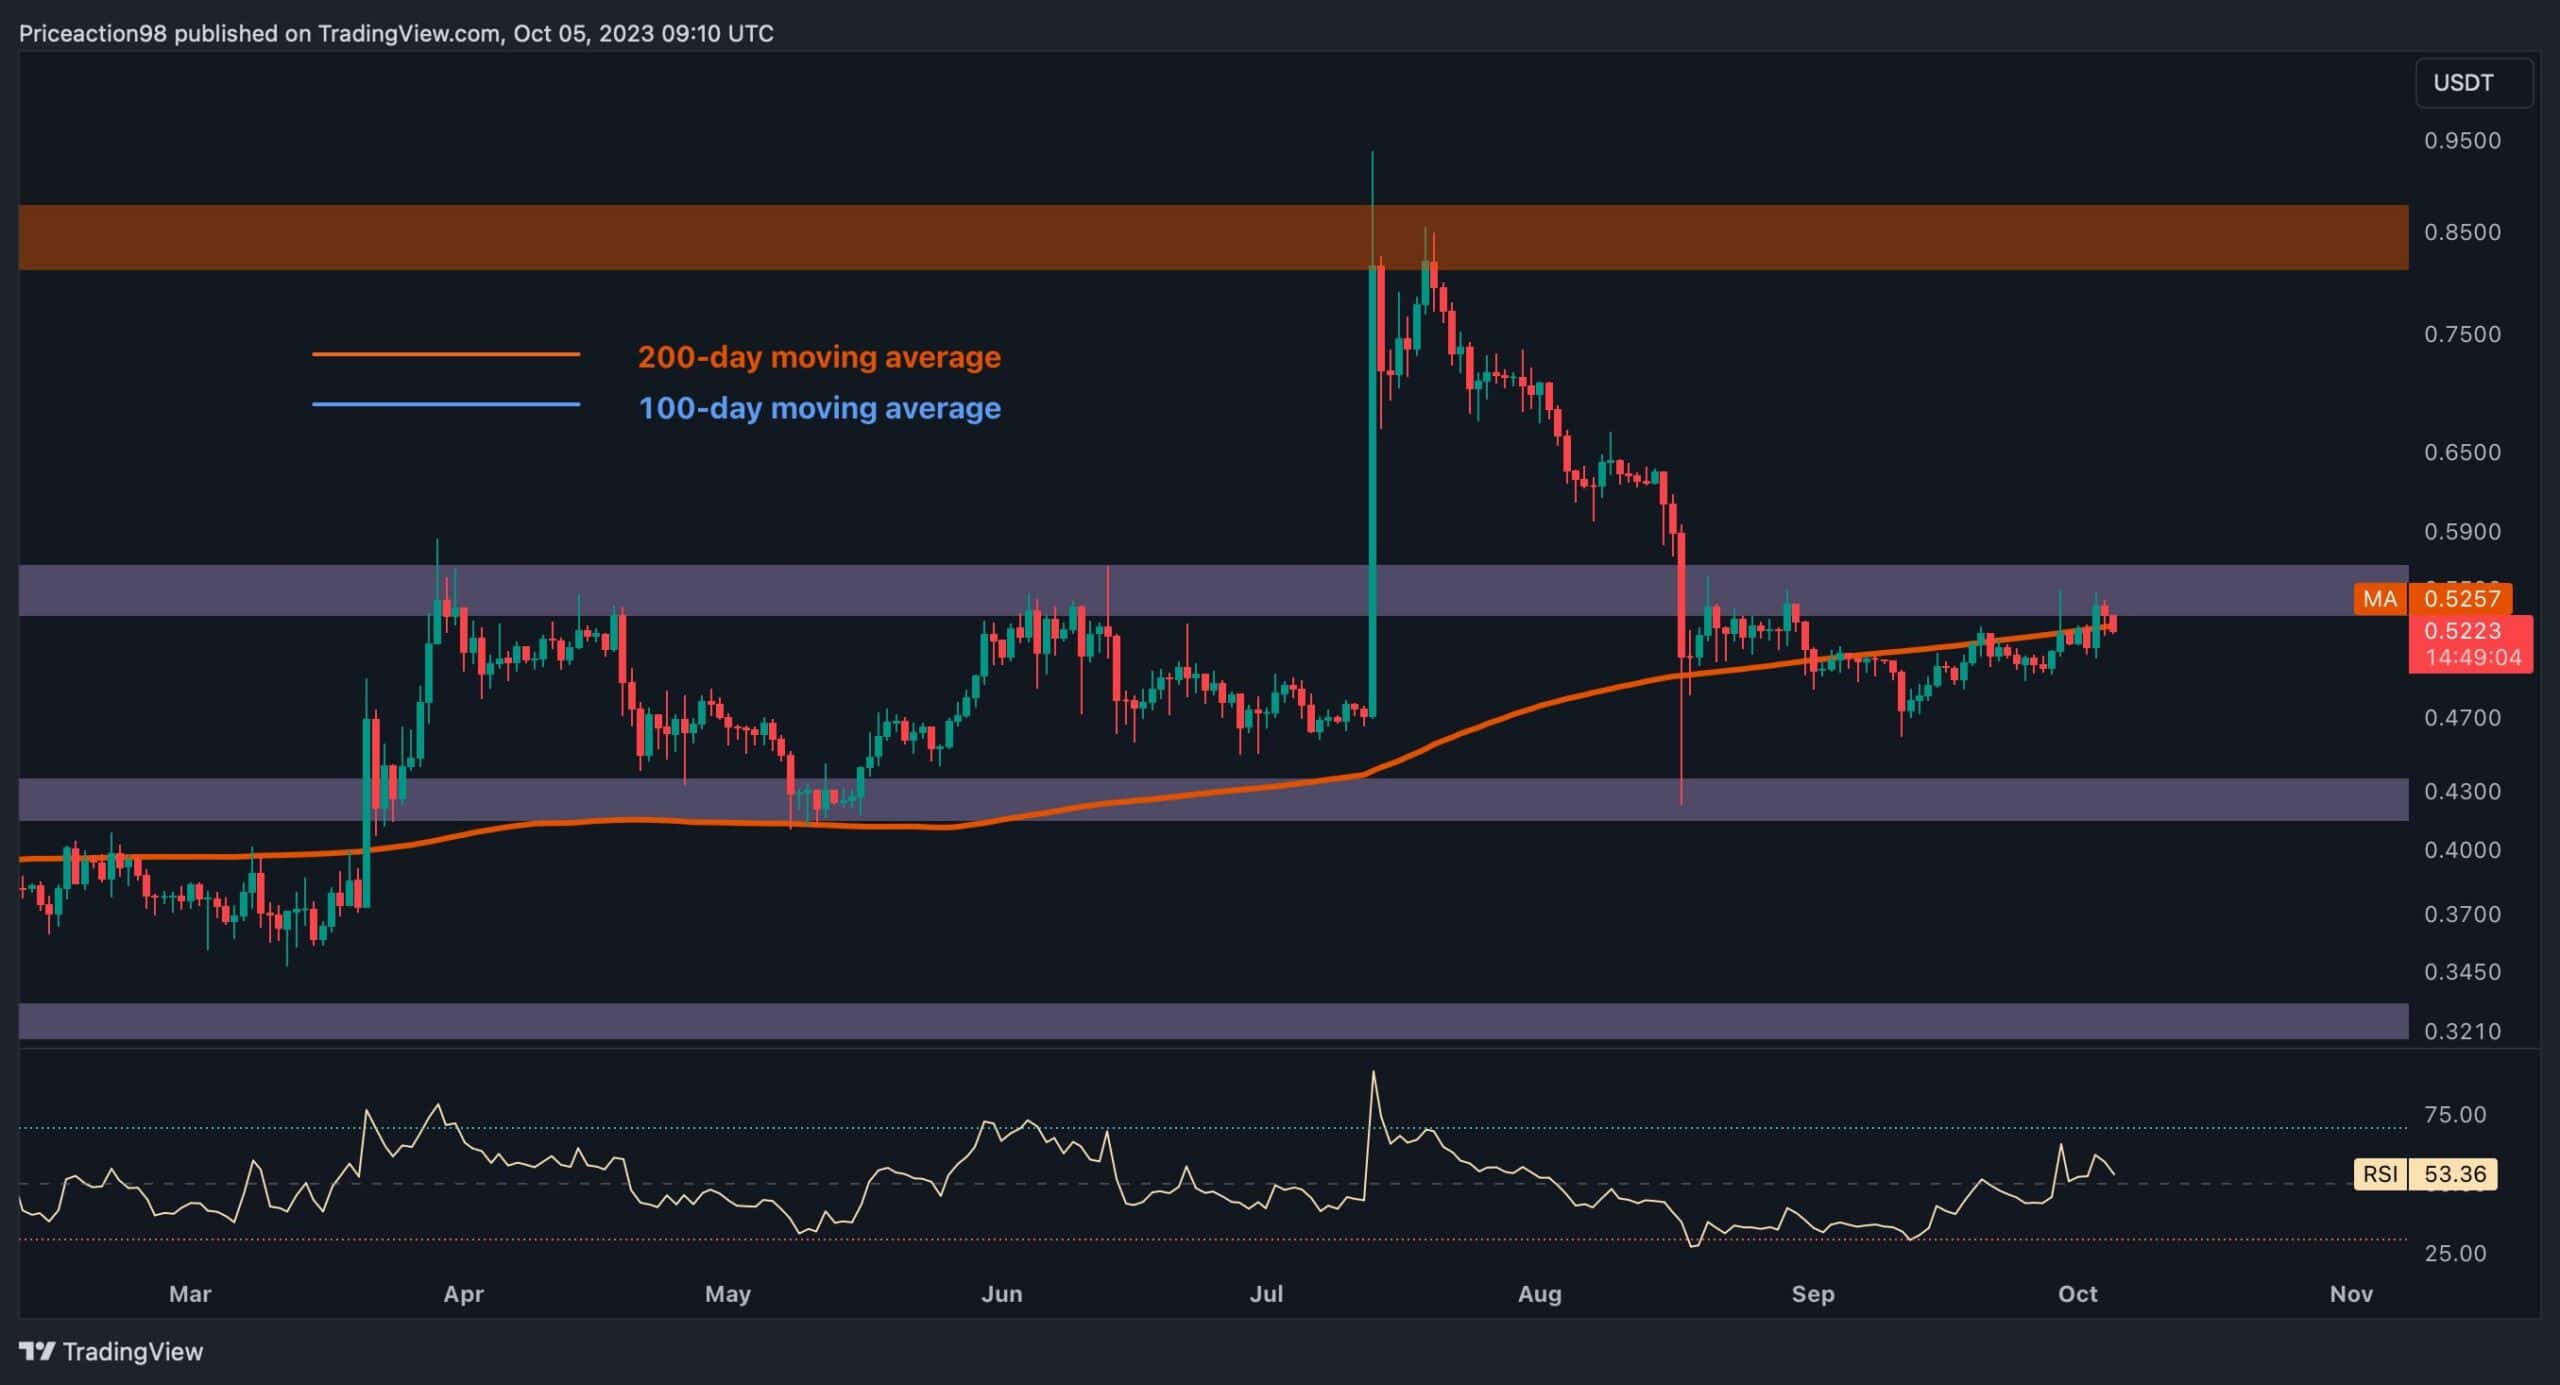
The Daily Chart
Upon analyzing the daily chart, Ripple’s price experienced a notable rejection, leading to a phase of consolidation. It retraced slightly toward the 200-day moving average at $0.5223 and managed to reclaim it somewhat. The 200-day moving average is widely recognized as a strong resistance level.
However, the price breaking above this level indicates the potential for a bullish reversal in the market, suggesting the possibility of further upward movements. It is important to note that this scenario relies on a downward pullback that confirms the validity of the breakout.
Nevertheless, despite the price slightly surpassing the moving average, there is still a high possibility of rejection followed by a decline.
This is because the 200-day moving average is considered a significant resistance level, particularly when combined with the static resistance region of $0.55. This scenario remains valid if the pullback occurs successfully and the price fails to sustain above the 200-day moving average.
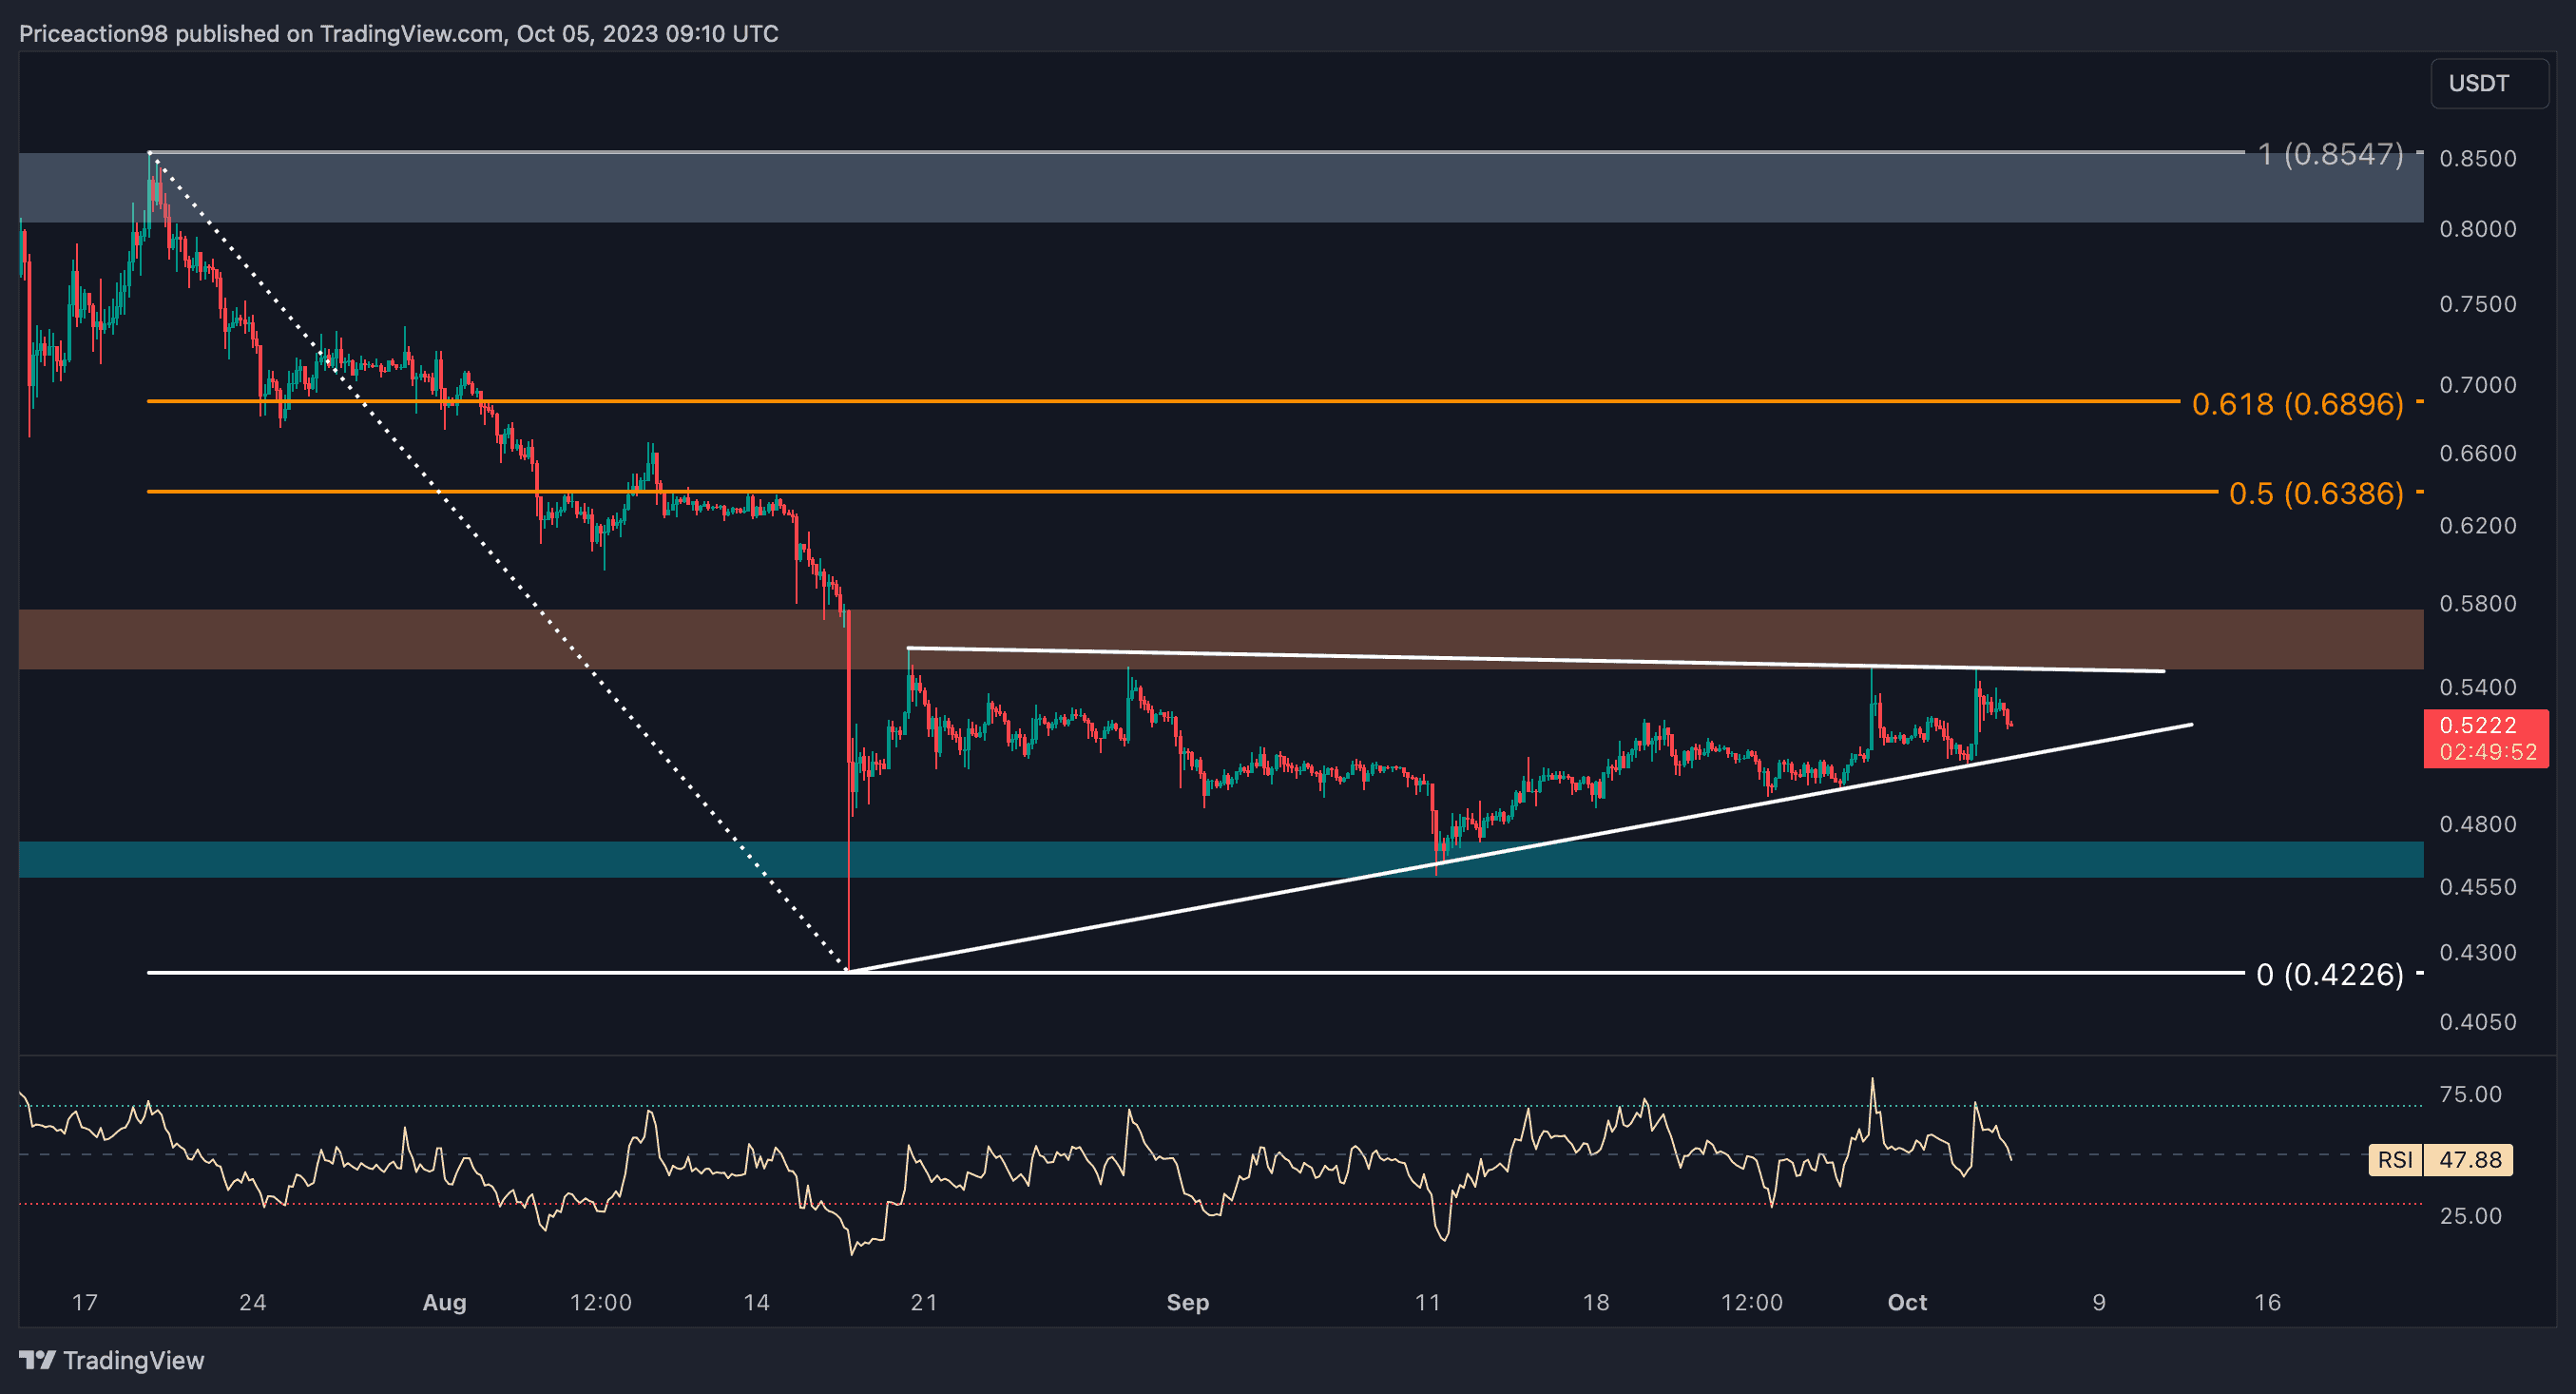
The 4-Hour Chart
Shifting our attention to the 4-hour chart, we can see that the price has found significant support after a prolonged downtrend, resulting in a temporary sideways movement. An important development to note is the emergence of an ascending triangle, a well-known continuation pattern.
Currently, the price is on the verge of breaking below the lower boundary of the triangle, indicating a potential continuation of the initial downtrend.
On the other hand, if the price surges and breaks above the triangle’s upper trendline, this scenario would be invalidated, suggesting the possibility of an upward movement.
However, considering the significance of the resistance region at $0.55 and the presence of sellers in the market, the more probable scenario is a rejection followed by a decline below the lower threshold of the triangle. Traders should closely monitor these levels to make informed decisions in the market.