XRP Analysis By Shayan After failing to breach the %excerpt%.74 mark, Ripple initiated a corrective leg, retracing toward the 100-day and 200-day moving averages at approximately %excerpt%.55. However, a crucial support region stands in the way, potentially putting a halt to Ripple’s short-term downward trajectory. The daily chart illustrates that Ripple encountered seller dominance when attempting to surpass the %excerpt%.74 mark, impeding further upward momentum. Subsequently, the price entered a correction stage, retracing toward a pivotal support region on the daily chart. This critical support range encompasses the 100 and 200-day moving averages, along with the static support level of %excerpt%.54, providing substantial psychological support for Ripple. Given recent price action and the
Topics:
CryptoVizArt considers the following as important: Ripple (XRP) Price, XRP Analysis, xrpbtc, xrpusd
This could be interesting, too:
Jordan Lyanchev writes Ripple’s (XRP) Surge to Triggers Over Million in Short Liquidations
Jordan Lyanchev writes Trump Confirms Work on Strategic Crypto Reserve: XRP, ADA, SOL Included
Dimitar Dzhondzhorov writes Is a Major Ripple v. SEC Lawsuit Development Expected This Week? Here’s Why
Mandy Williams writes Ripple Releases Institutional DeFi Roadmap for XRP Ledger in 2025
XRP Analysis
By Shayan
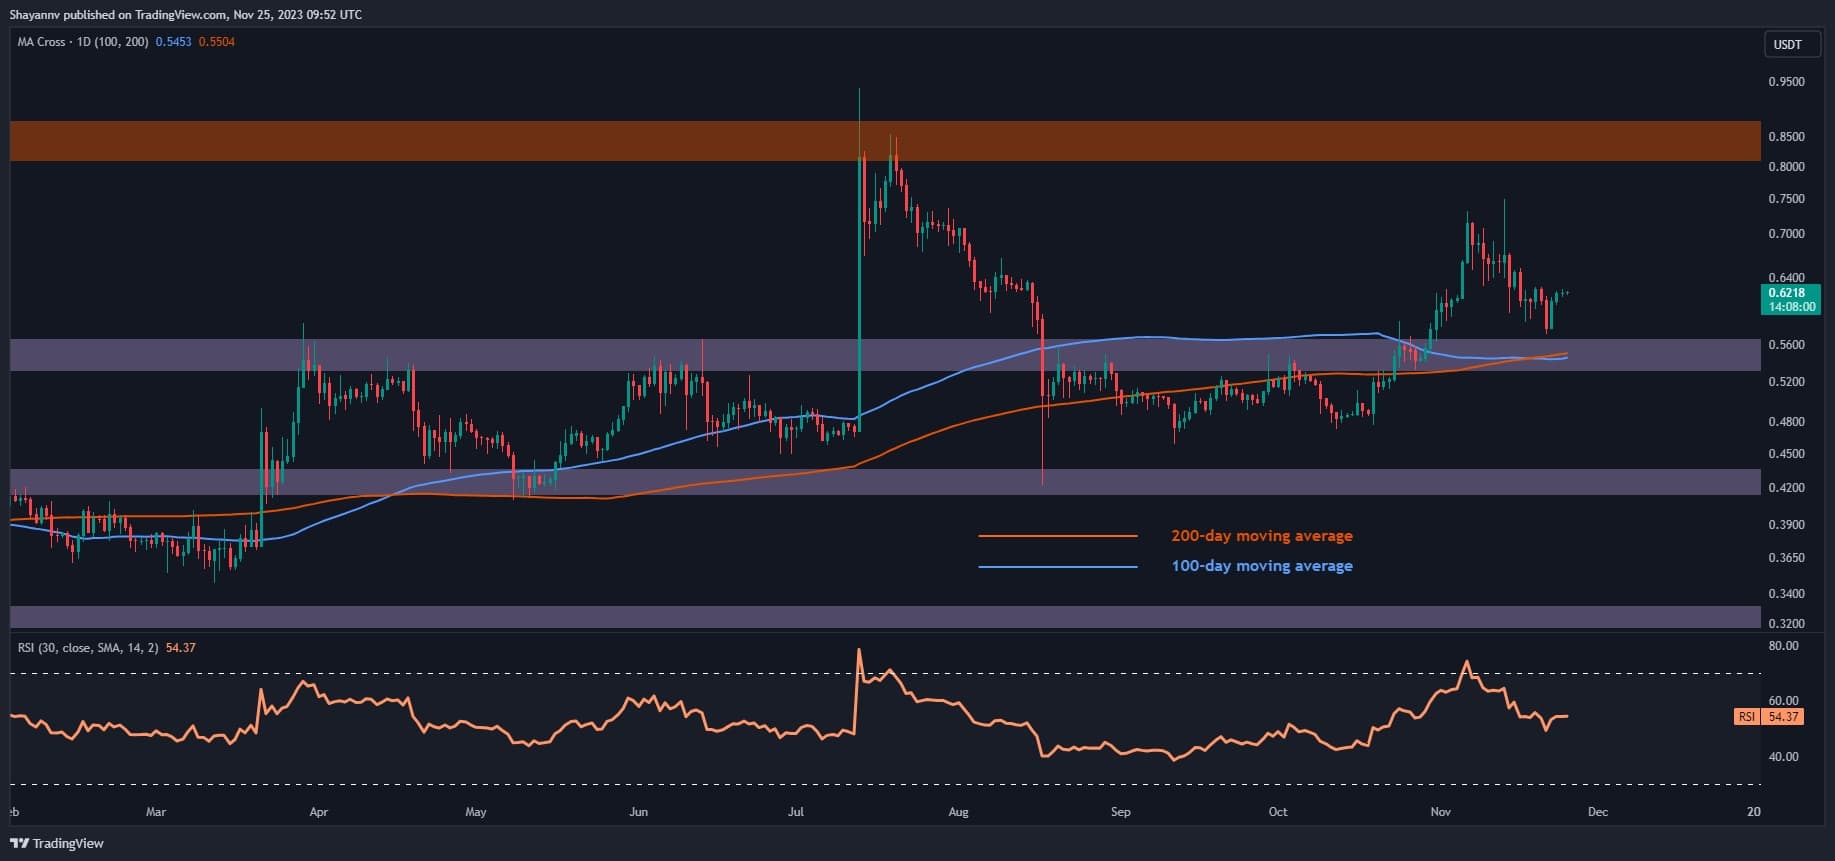
After failing to breach the $0.74 mark, Ripple initiated a corrective leg, retracing toward the 100-day and 200-day moving averages at approximately $0.55.
However, a crucial support region stands in the way, potentially putting a halt to Ripple’s short-term downward trajectory.
The daily chart illustrates that Ripple encountered seller dominance when attempting to surpass the $0.74 mark, impeding further upward momentum. Subsequently, the price entered a correction stage, retracing toward a pivotal support region on the daily chart.
This critical support range encompasses the 100 and 200-day moving averages, along with the static support level of $0.54, providing substantial psychological support for Ripple.
Given recent price action and the significance of the $0.54 support range, there is a high likelihood of an extension of the consolidation stage, with the price experiencing volatility around this crucial mark. If Ripple buyers re-enter the market, a fresh uptrend could potentially be initiated with the aim of reclaiming the $0.74 resistance threshold.
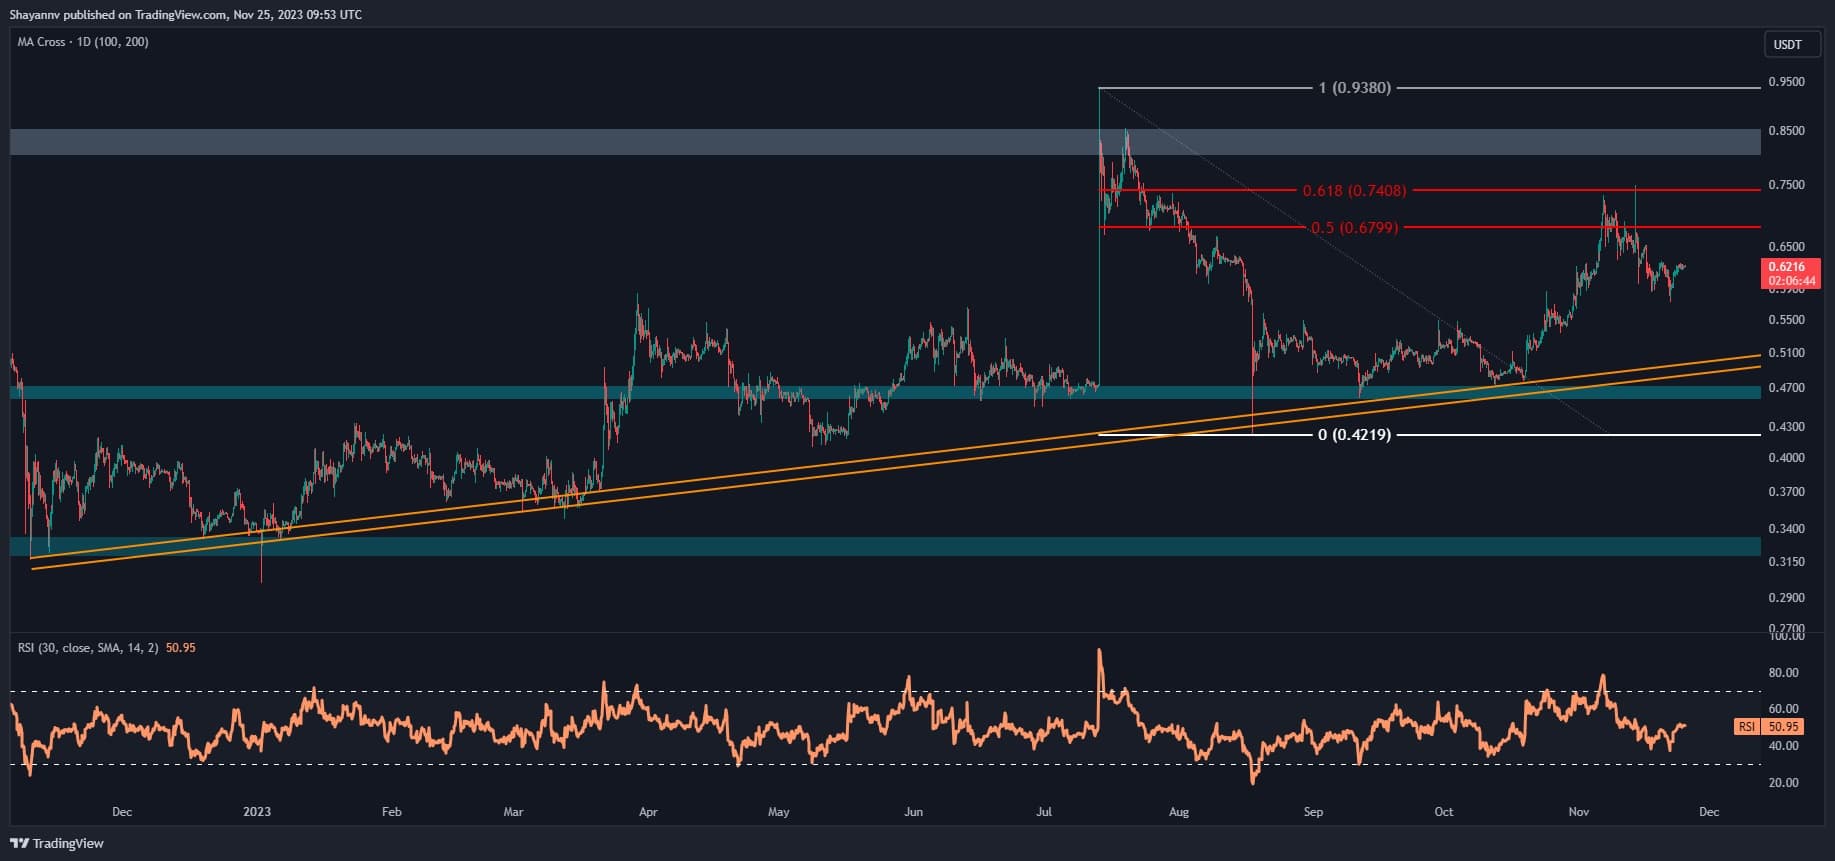
Turning attention to the 4-hour chart, Ripple’s upward movement encountered a formidable barrier within a critical resistance region defined by the price range between the 0.5 and 0.618 levels of the Fibonacci retracement ($0.6799-$0.7408). Intensified selling pressure in this crucial region led to a notable decline, marked by an extended retracement.
In the event that this retracement continues, Ripple’s multi-month ascending trendline, denoted by orange lines, and the static support region of $0.48 are poised to serve as the price’s main support. However, a successful breach of the 0.618 level of the Fibonacci retracement would invalidate this scenario, potentially triggering a substantial upward movement for Ripple’s price.