Ripple’s price has been trapped inside a static range between %excerpt%.42 and %excerpt%.31 and is struggling to break ou. A consolidation stage within this range could be imminent as the cryptocurrency was recently rejected from a vital resistance level. Technical Analysis By Shayan The Weekly Chart Since 2021, Ripple has been declining, forming a falling wedge pattern on the weekly timeframe. Recently, the price experienced a slight plummet after being rejected from the wedge’s upper threshold. The %excerpt%.31 price region currently serves as a significant support as it has been holding the price during the last four months, while the %excerpt%.55 region acts as a primary resistance. A shakeout is anticipated in the event of a decline below %excerpt%.31, and the wedge’s lower boundary will be Ripple’s
Topics:
CryptoVizArt considers the following as important: Ripple (XRP) Price, XRP Analysis, xrpbtc, xrpusd
This could be interesting, too:
Jordan Lyanchev writes Ripple’s (XRP) Surge to Triggers Over Million in Short Liquidations
Jordan Lyanchev writes Trump Confirms Work on Strategic Crypto Reserve: XRP, ADA, SOL Included
Dimitar Dzhondzhorov writes Is a Major Ripple v. SEC Lawsuit Development Expected This Week? Here’s Why
Mandy Williams writes Ripple Releases Institutional DeFi Roadmap for XRP Ledger in 2025
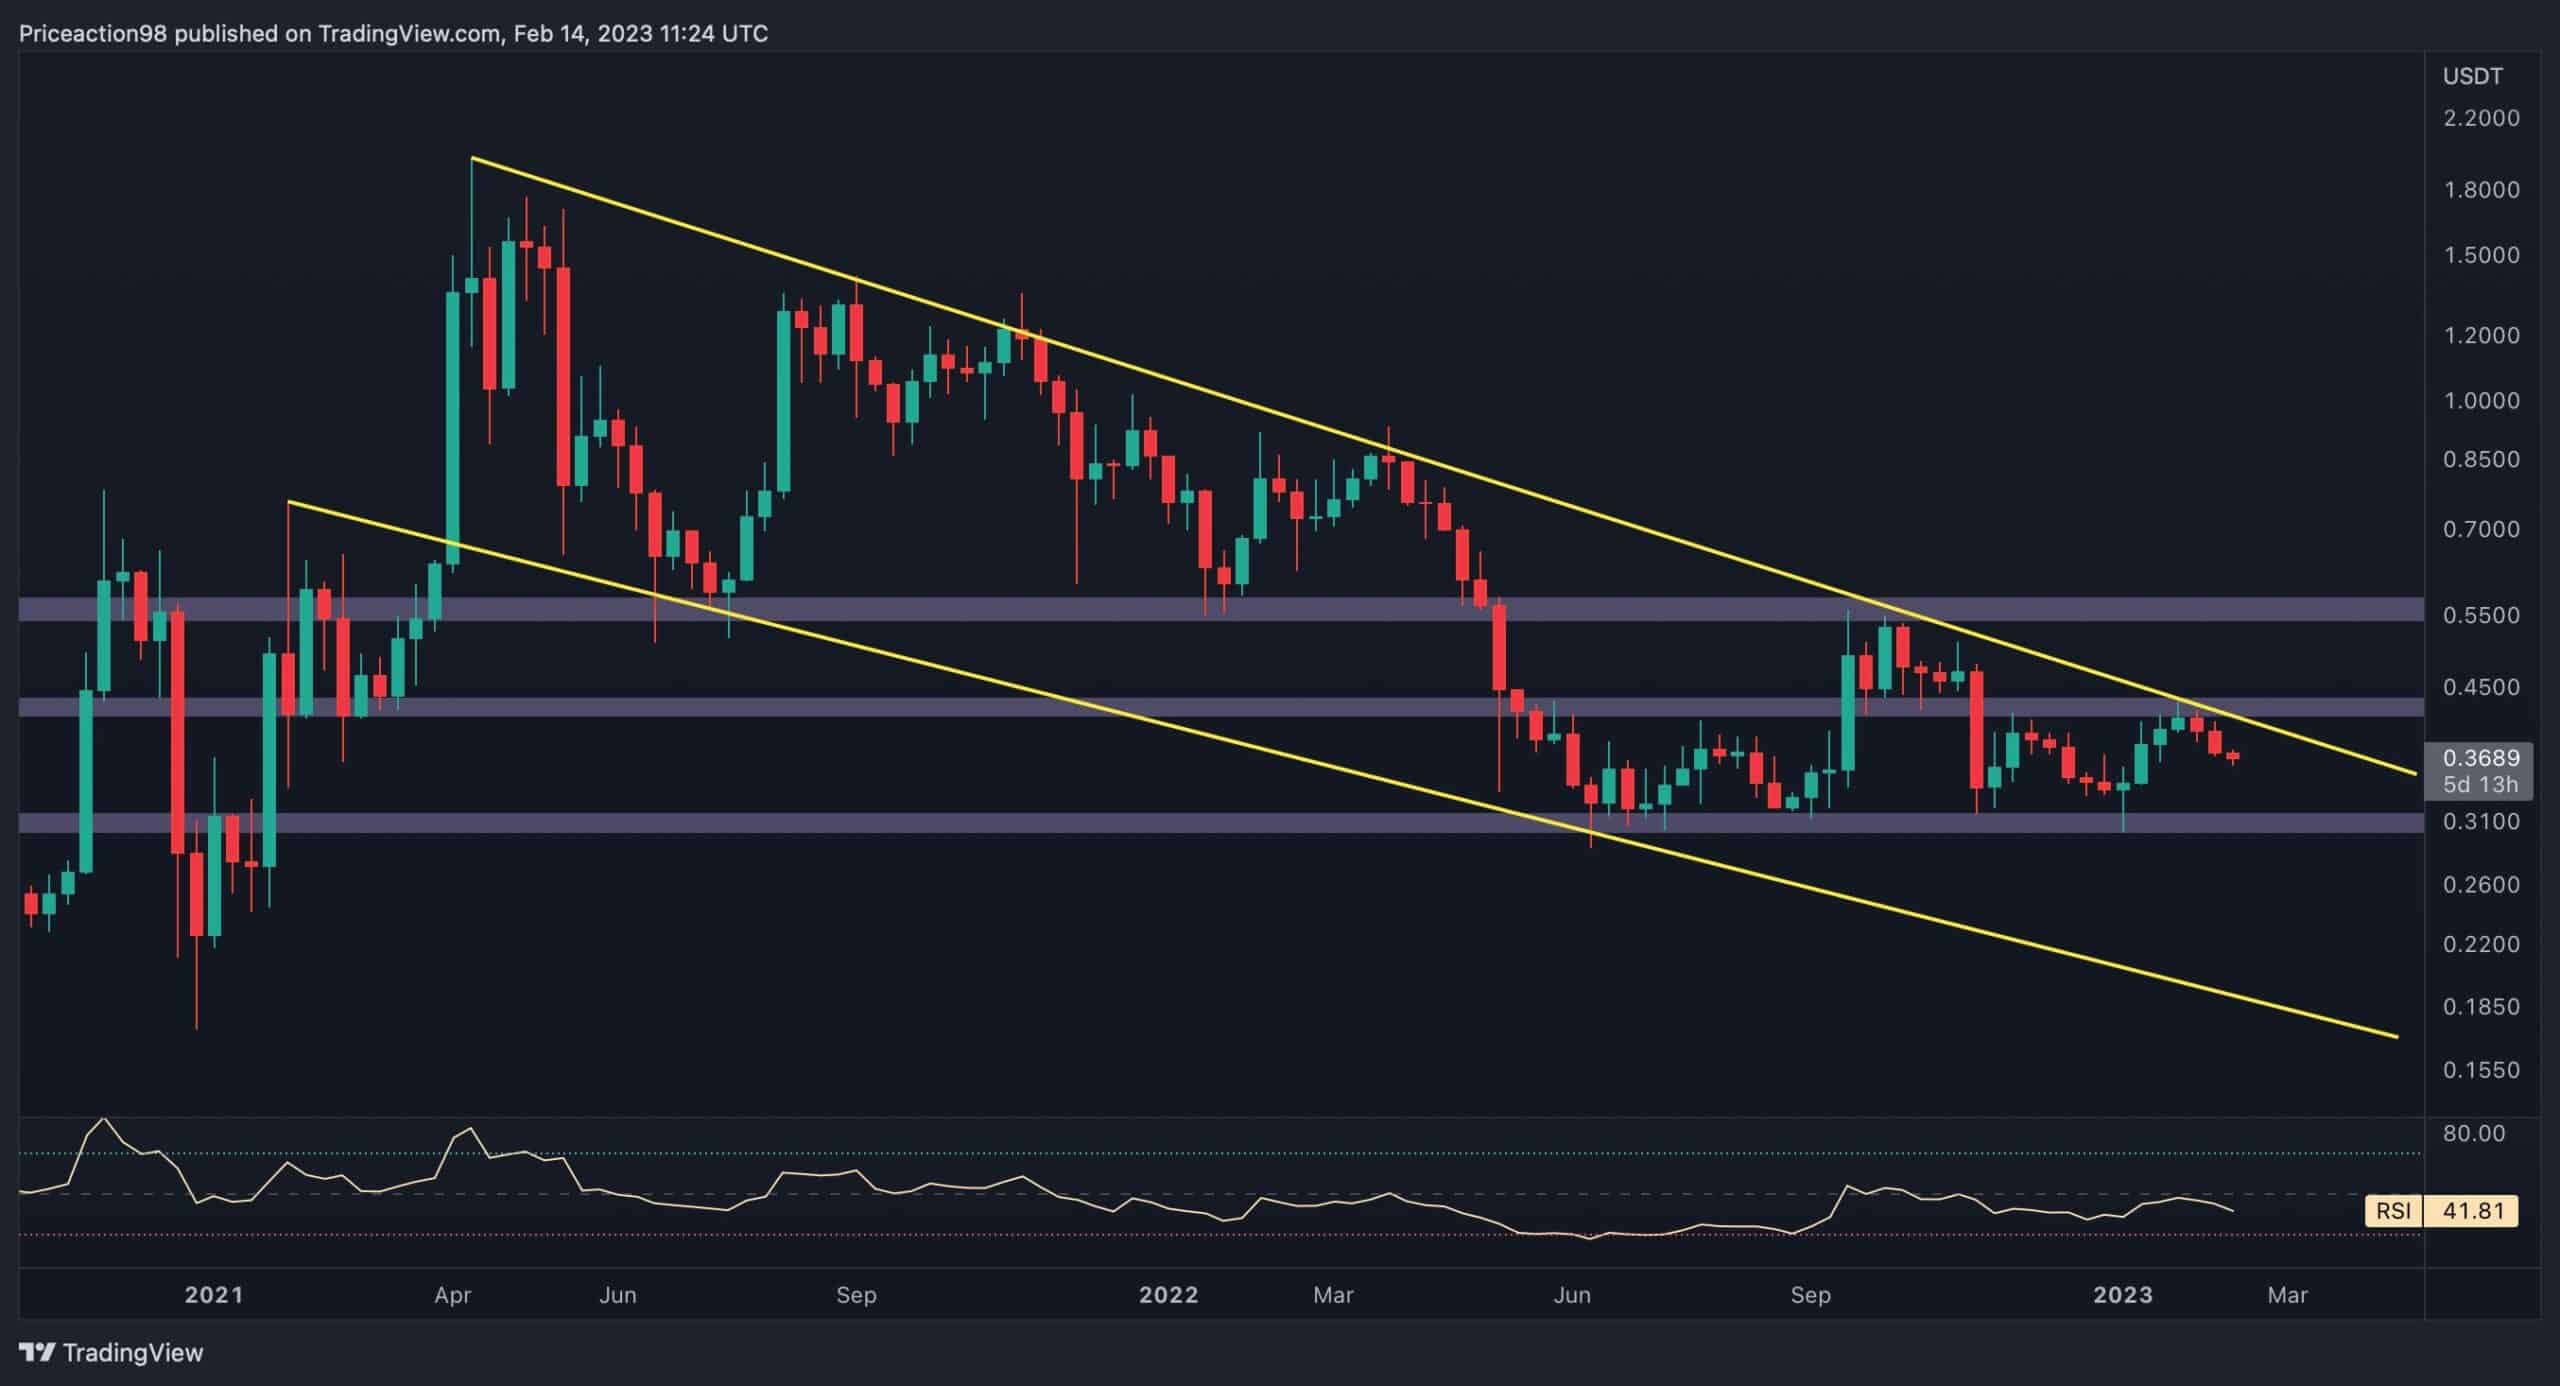
Ripple’s price has been trapped inside a static range between $0.42 and $0.31 and is struggling to break ou. A consolidation stage within this range could be imminent as the cryptocurrency was recently rejected from a vital resistance level.
Technical Analysis
By Shayan
The Weekly Chart
Since 2021, Ripple has been declining, forming a falling wedge pattern on the weekly timeframe. Recently, the price experienced a slight plummet after being rejected from the wedge’s upper threshold.
The $0.31 price region currently serves as a significant support as it has been holding the price during the last four months, while the $0.55 region acts as a primary resistance. A shakeout is anticipated in the event of a decline below $0.31, and the wedge’s lower boundary will be Ripple’s next stop.
The Daily Chart
As depicted by the chart below, the rejection from the prolonged descending trendline has led to the breakdown of the 200-day moving average. Typically, the overview or bias for the price of an asset is determined by the asset’s positioning compared to the 200-day moving average. If the price drops below the MA, the overview is considered bearish, while the opposite also applies.
To conclude, the price drop below the 200-day moving average indicates that Ripple’s current outlook leans bearish. Nevertheless, the price is expected to consolidate in the range between the $0.31 and $0.44 levels.