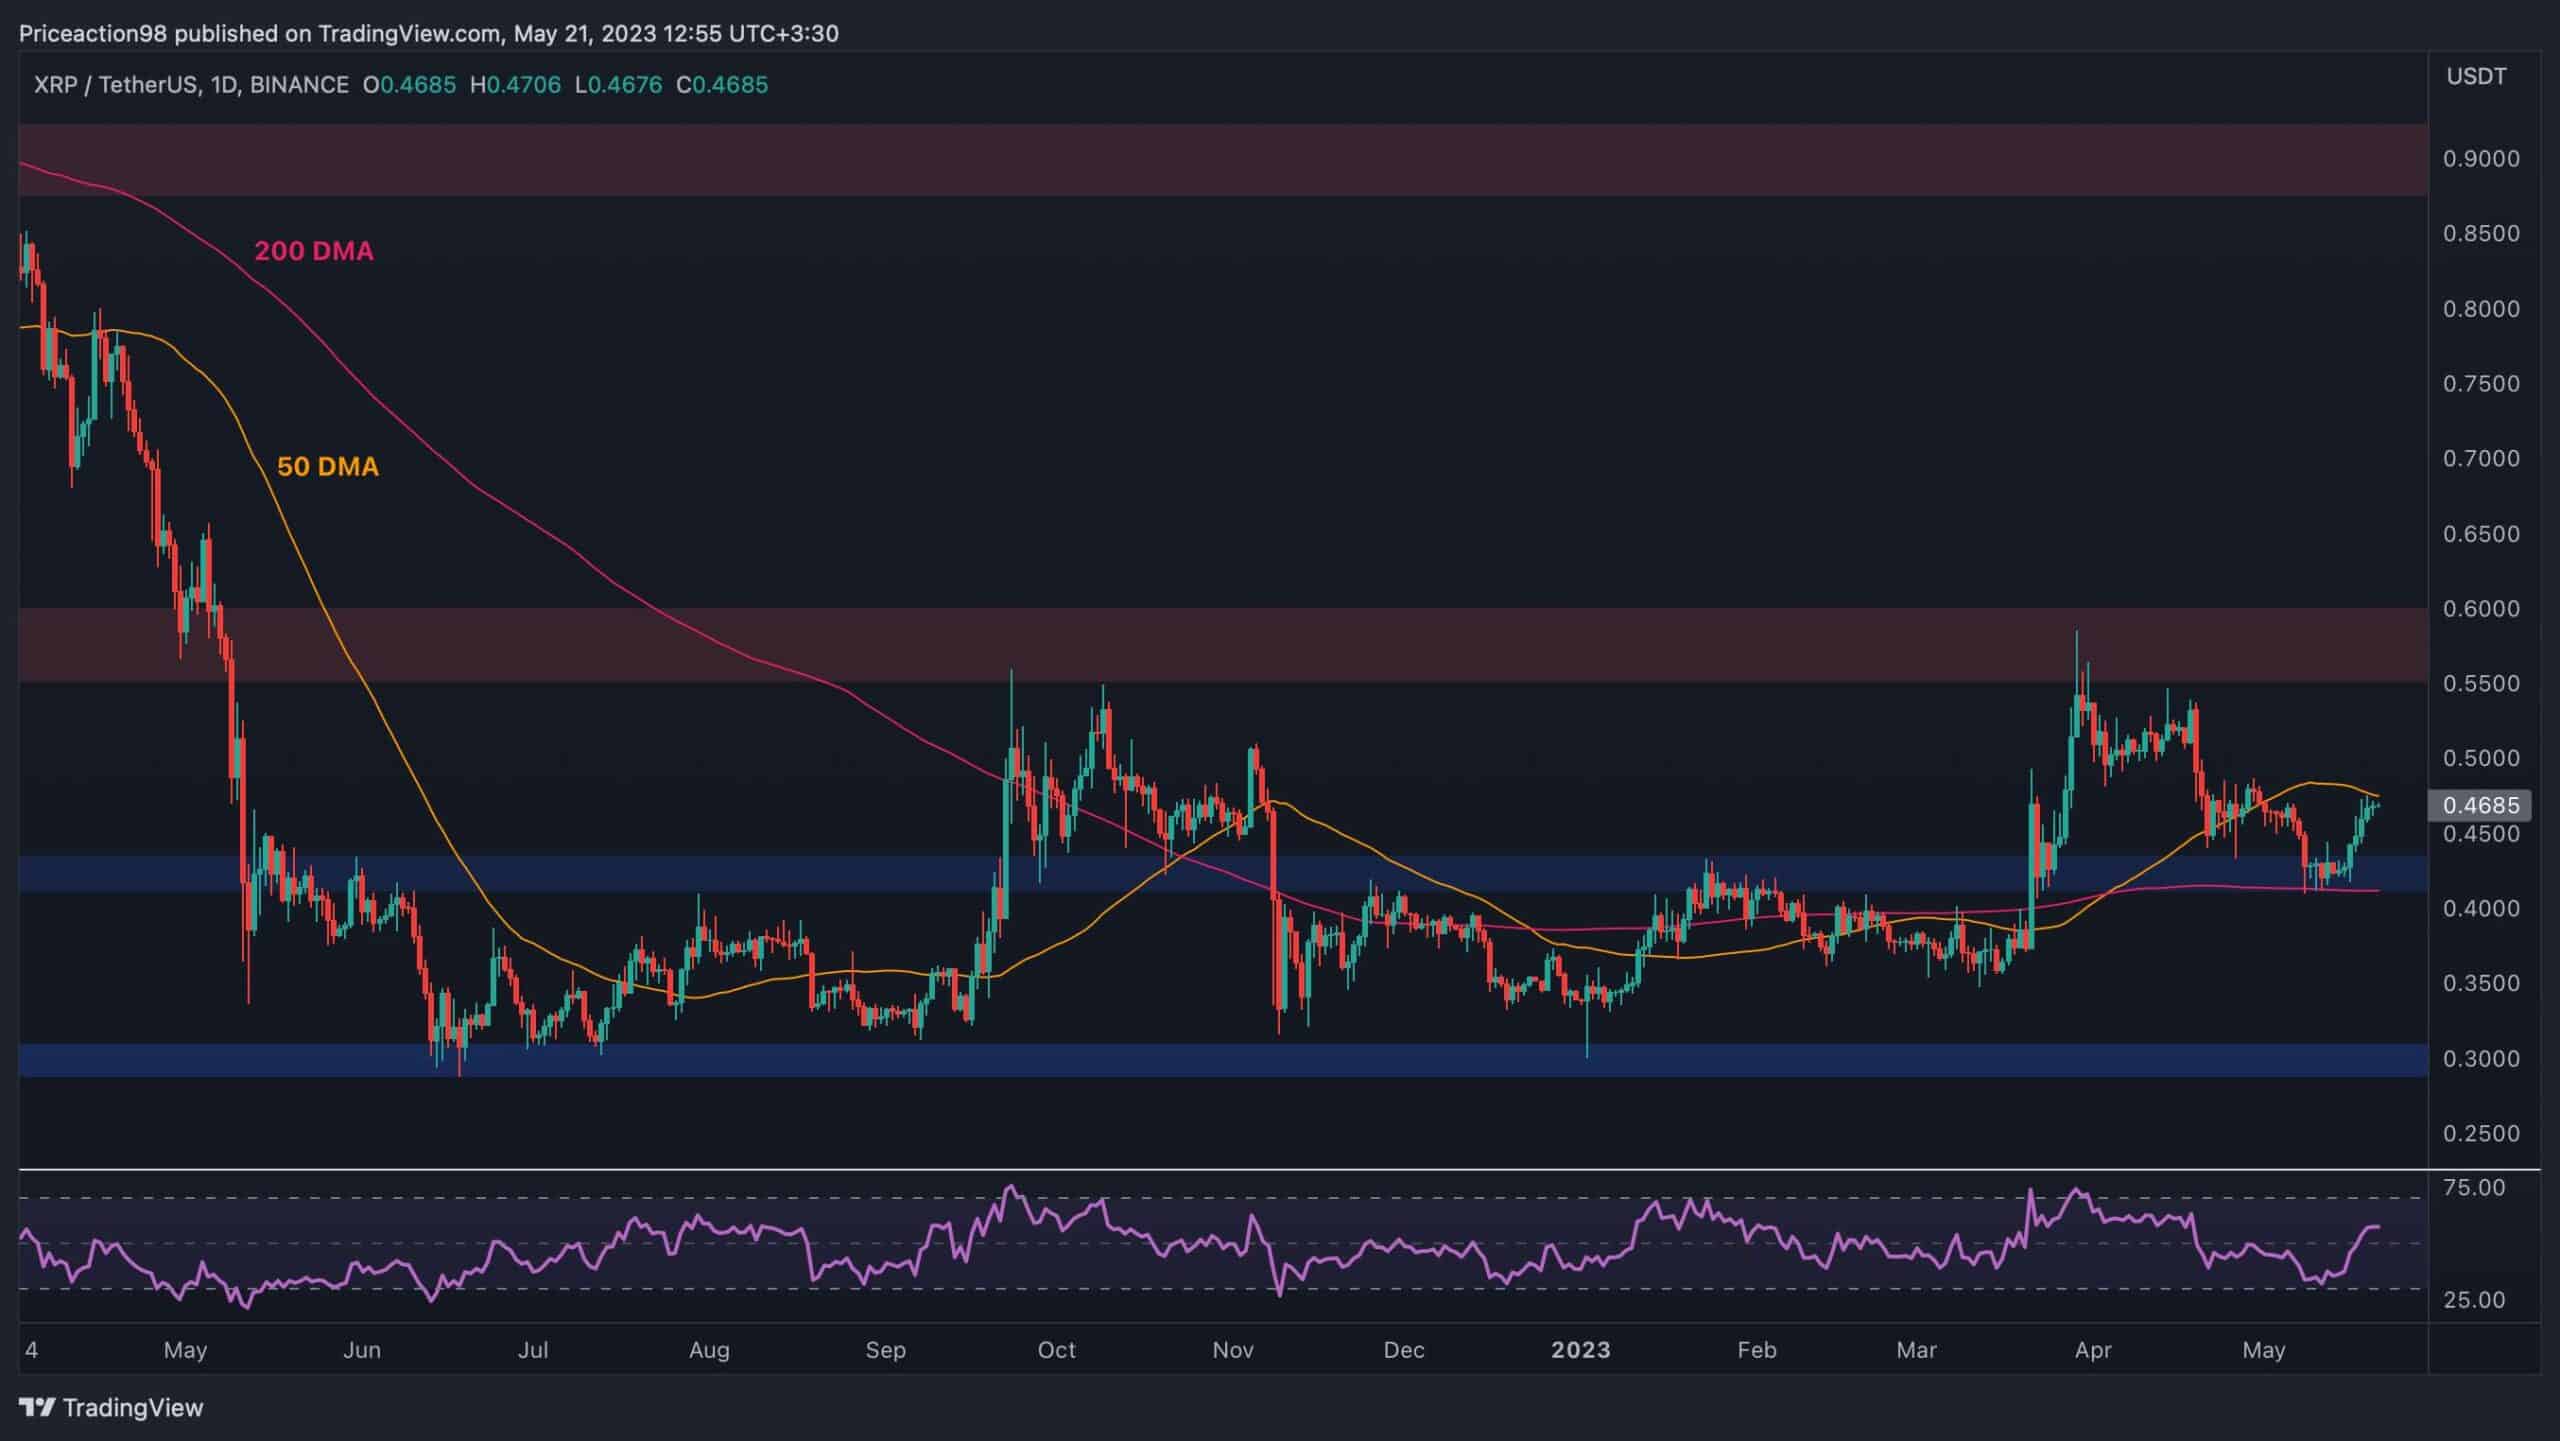
Ripple’s price is finally showing some bullishness following 4 weeks of downward movement. However, there are still some concerning signs on the charts. Technical Analysis By: Edris XRP/USDT Daily Chart The price has rebounded from the %excerpt%.43 support level, with the key 200-day moving average located around the same level. Currently, the 50-day moving average is being tested around the %excerpt%.47 mark, but XRP has yet to break above. If a bullish breakout were to occur, a rally toward the %excerpt%.6 resistance level would be the most probable scenario. On the other hand, a drop below the 200-day moving average would be disastrous, as a decline toward the %excerpt%.3 level and even lower would become more likely. This would likely prolong the bear market. The RSI indicator has also risen
Topics:
CryptoVizArt considers the following as important: Ripple (XRP) Price, XRP Analysis, xrpbtc, xrpusd
This could be interesting, too:
Jordan Lyanchev writes Ripple’s (XRP) Surge to Triggers Over Million in Short Liquidations
Jordan Lyanchev writes Trump Confirms Work on Strategic Crypto Reserve: XRP, ADA, SOL Included
Dimitar Dzhondzhorov writes Is a Major Ripple v. SEC Lawsuit Development Expected This Week? Here’s Why
Mandy Williams writes Ripple Releases Institutional DeFi Roadmap for XRP Ledger in 2025
Ripple’s price is finally showing some bullishness following 4 weeks of downward movement. However, there are still some concerning signs on the charts.
Technical Analysis
By: Edris
XRP/USDT Daily Chart
The price has rebounded from the $0.43 support level, with the key 200-day moving average located around the same level. Currently, the 50-day moving average is being tested around the $0.47 mark, but XRP has yet to break above.
If a bullish breakout were to occur, a rally toward the $0.6 resistance level would be the most probable scenario. On the other hand, a drop below the 200-day moving average would be disastrous, as a decline toward the $0.3 level and even lower would become more likely. This would likely prolong the bear market.
The RSI indicator has also risen above 50%, displaying bullish momentum at the moment.
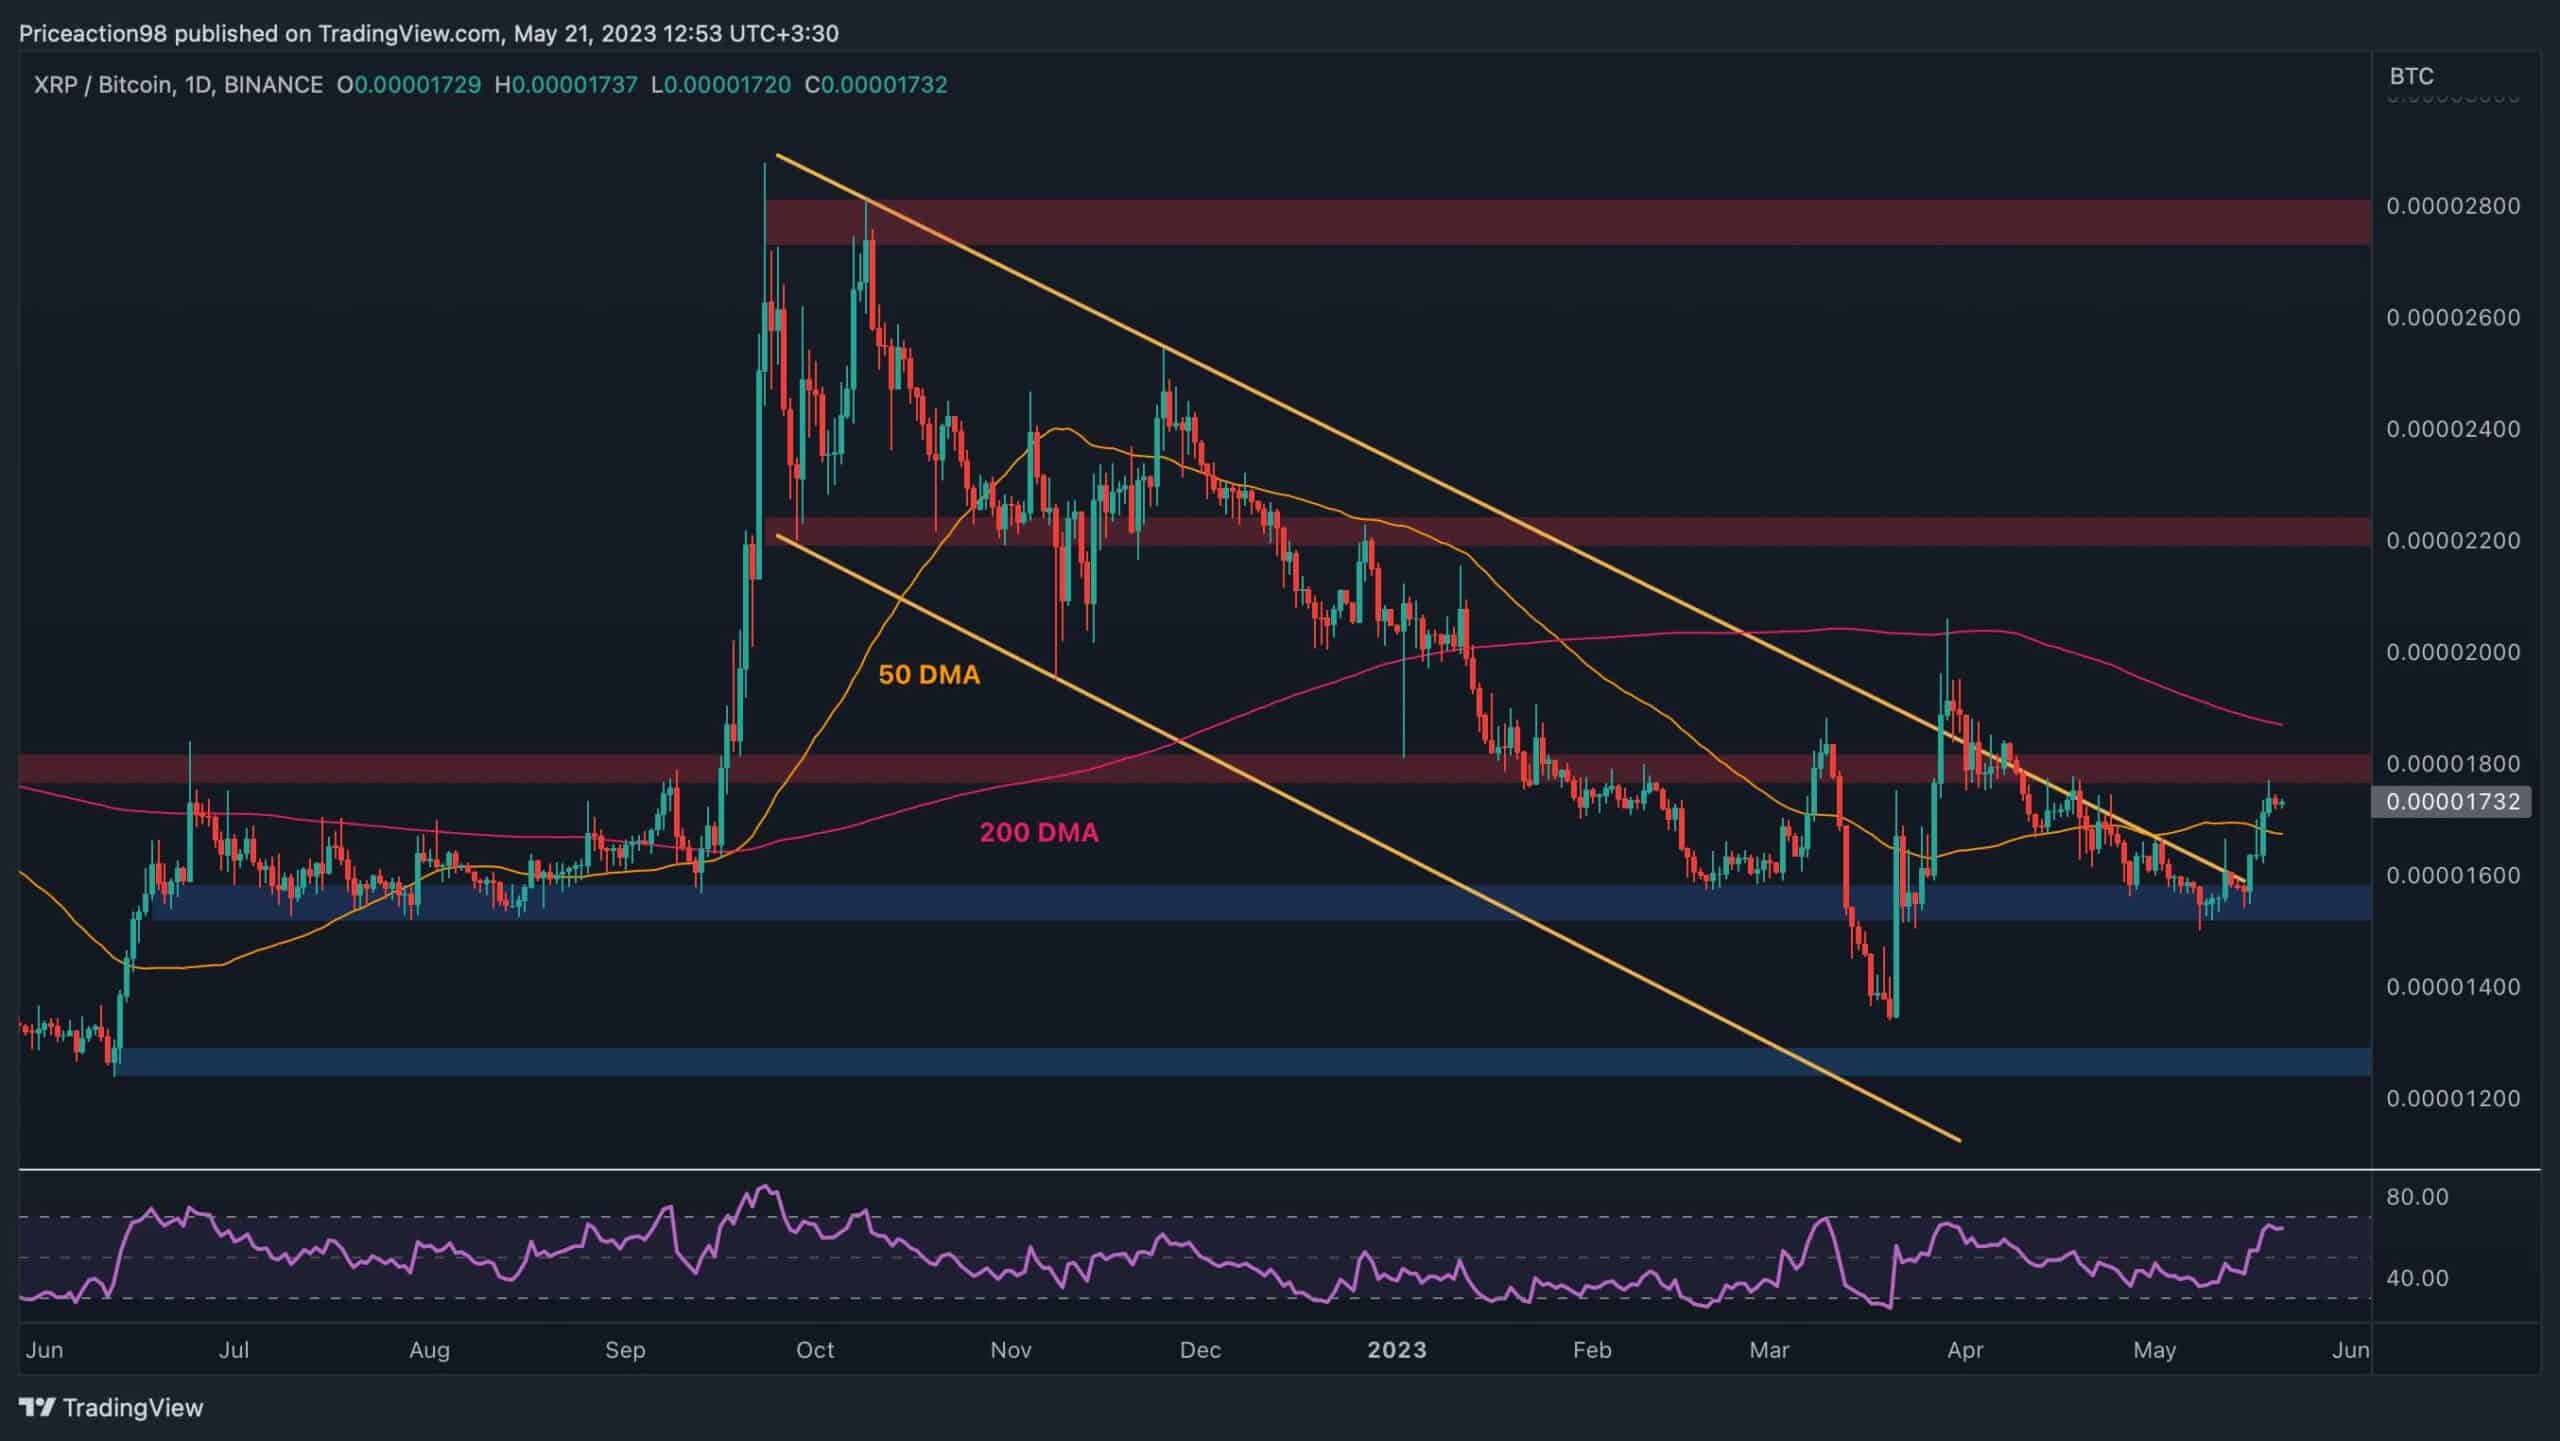
XRP/BTC Daily Chart
Against BTC, XRP has finally broken out of the large descending channel after more than 6 months. The price has surged above the 50-day moving average located around the 0.000017 mark and is currently attacking the 0.000018 resistance level.
The 200-day moving average trending around the 0.000019 price point could be the next target in case the price breaks through the 0.000018 level. On the other hand, a drop back inside the channel could lead to a crash toward the 0.000013 level.
Judging by the momentum signal by RSI, the bullish scenario seems more likely.