Ethereum has been struggling with the 100-day moving average, which stands at 72, for an extended period. However, the price action at this crucial level has not yet clearly indicated any upcoming direction. A breakout, on the other hand, has the potential to trigger an immediate cascade. Technical Analysis By Shayan The Daily Chart Following a short-term consolidation phase, the price experienced a decline toward the 100-day moving average of .7K. The recent PA of Ethereum has failed to deliver a definite direction, with the price consolidating and printing very small green and red candles. This has left the market in extreme uncertainty. Nonetheless, the cryptocurrency faces two critical support levels: the 100-day moving average at 72 and the substantial support
Topics:
CryptoVizArt considers the following as important: ETH Analysis, ETHBTC, Ethereum (ETH) Price, ethusd
This could be interesting, too:
Mandy Williams writes Ethereum Derivatives Metrics Signal Modest Downside Tail Risk Ahead: Nansen
Jordan Lyanchev writes Weekly Bitcoin, Ethereum ETF Recap: Light at the End of the Tunnel for BTC
CryptoVizArt writes Will Weak Momentum Drive ETH to .5K? (Ethereum Price Analysis)
Jordan Lyanchev writes Bybit Hack Fallout: Arthur Hayes, Samson Mow Push for Ethereum Rollback
Ethereum has been struggling with the 100-day moving average, which stands at $1772, for an extended period. However, the price action at this crucial level has not yet clearly indicated any upcoming direction. A breakout, on the other hand, has the potential to trigger an immediate cascade.
Technical Analysis
By Shayan
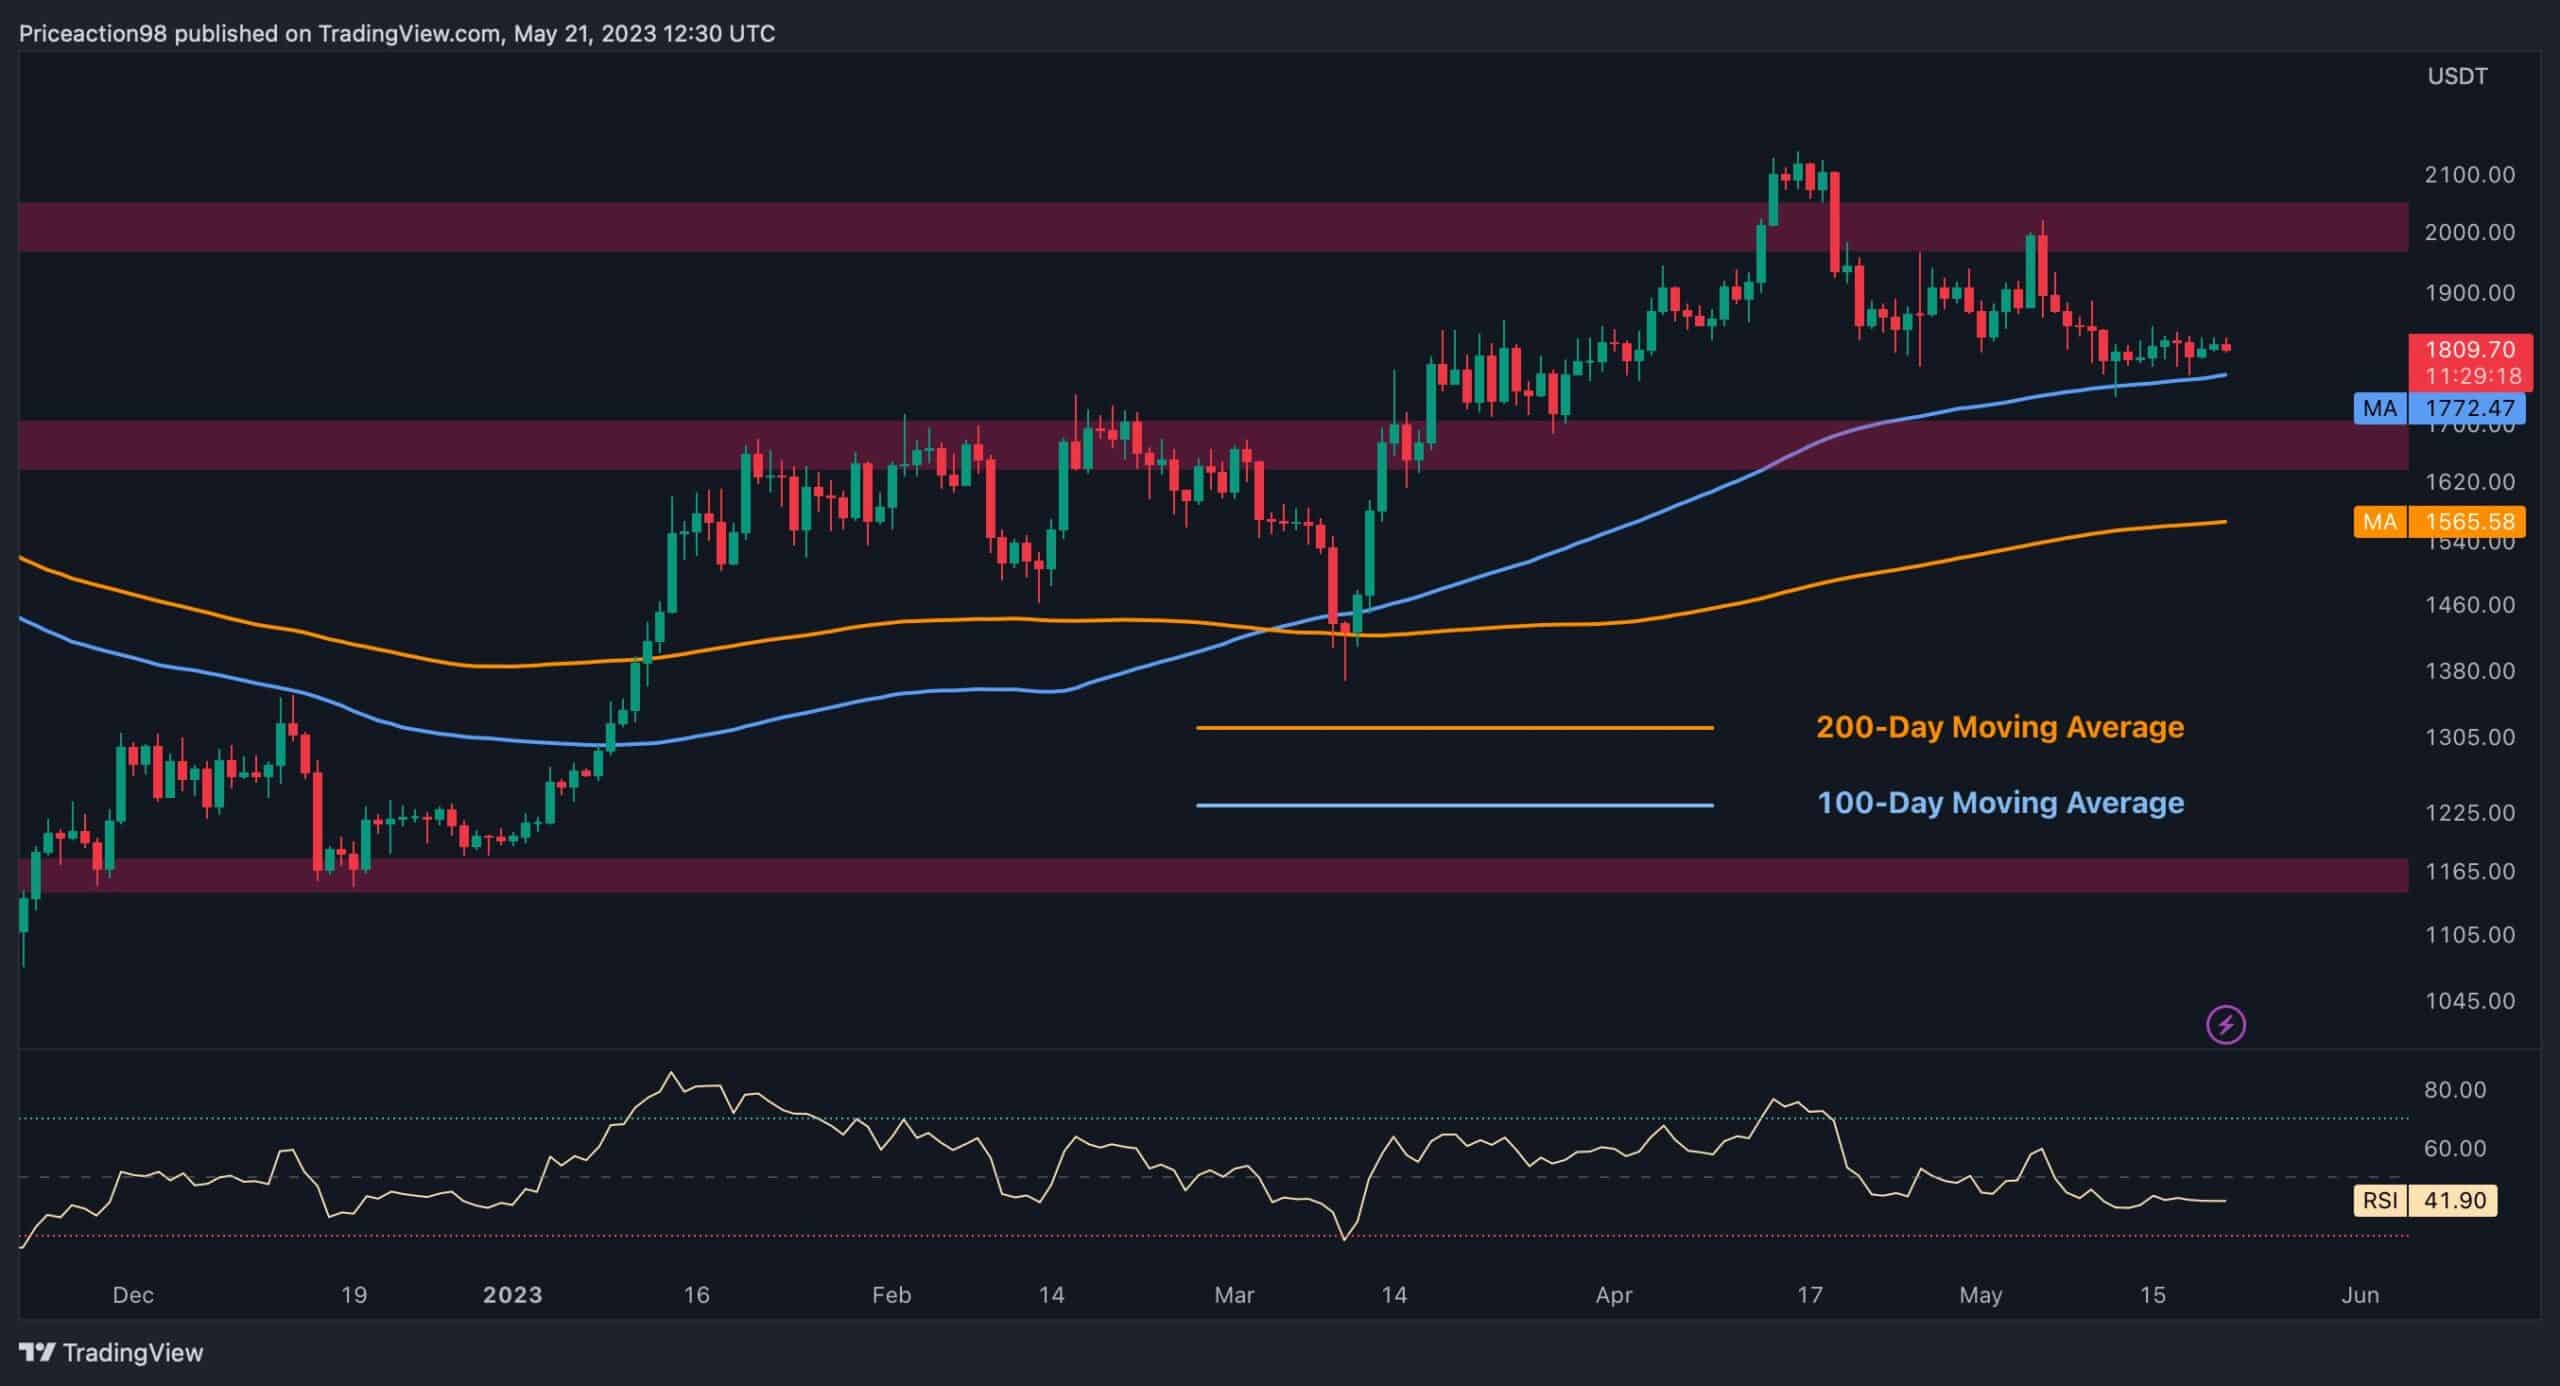
The Daily Chart
Following a short-term consolidation phase, the price experienced a decline toward the 100-day moving average of $1.7K. The recent PA of Ethereum has failed to deliver a definite direction, with the price consolidating and printing very small green and red candles. This has left the market in extreme uncertainty.
Nonetheless, the cryptocurrency faces two critical support levels: the 100-day moving average at $1772 and the substantial support region at $1.7K. Therefore, if $1.7K prevents a further decline, there is potential for a rally aiming for the resistance area at $2.1K.
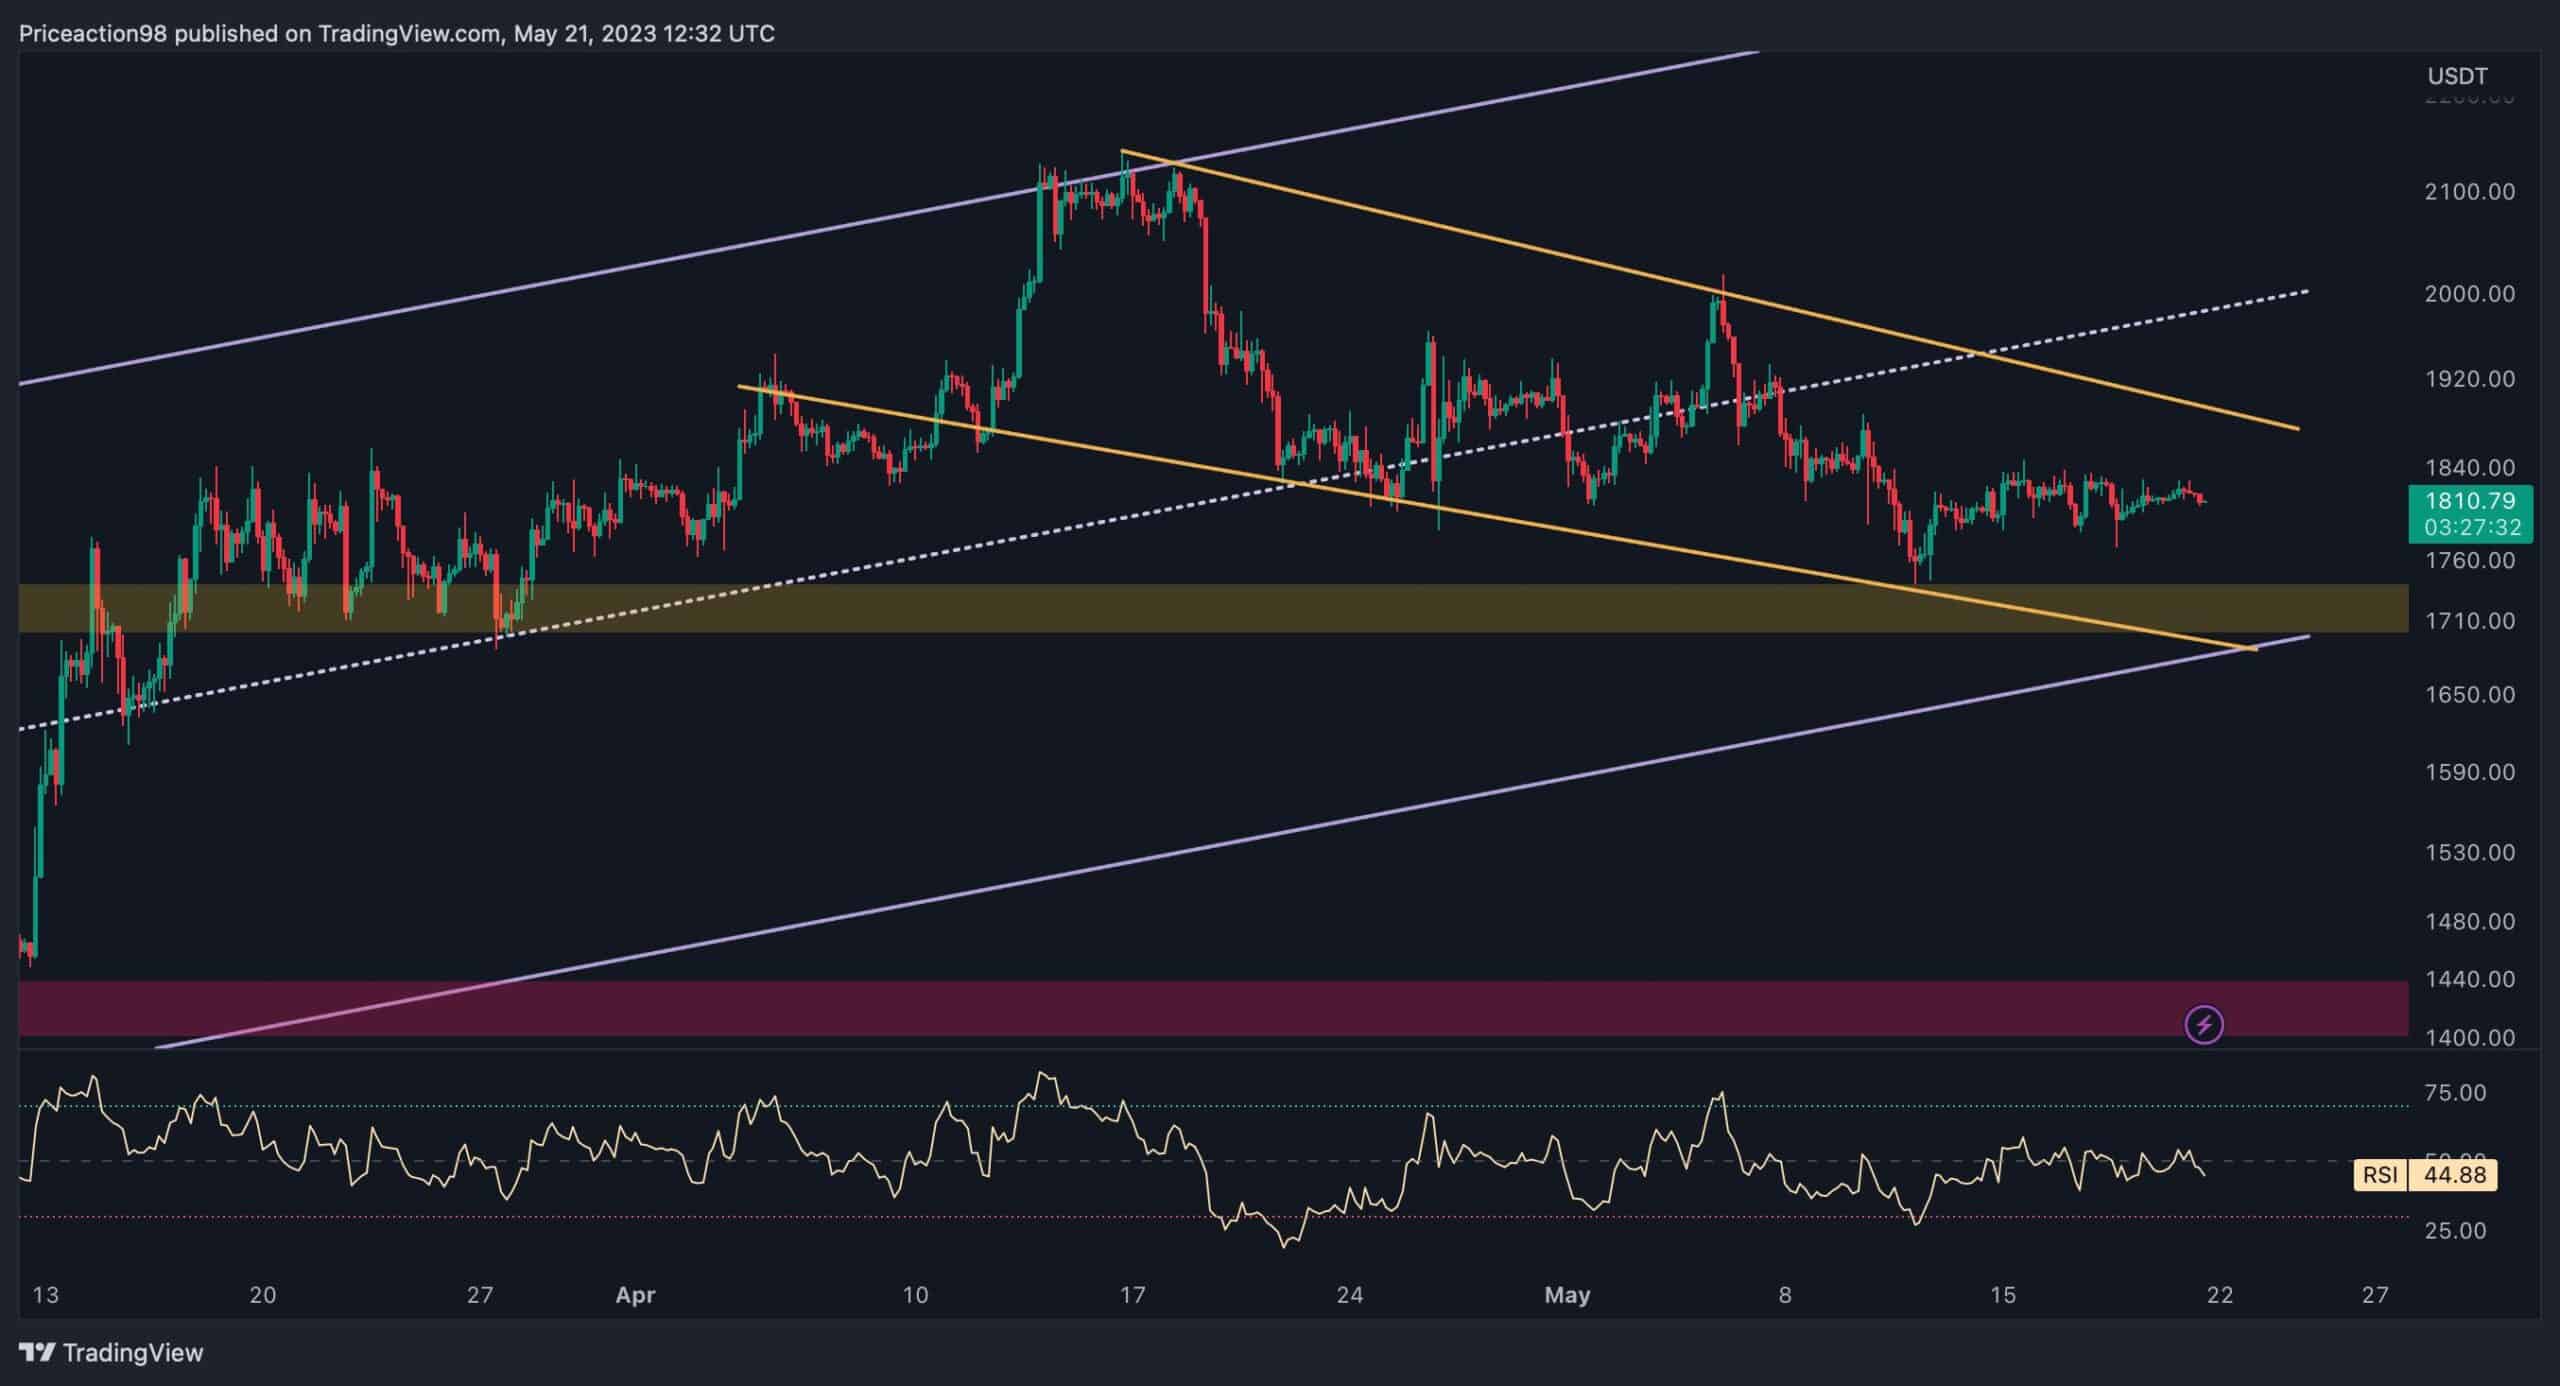
The 4-Hour Chart
On the 4-hour timeframe, the price has continued its bearish trend towards the support region at $1.7K. However, after reaching this level, it formed a slight bounce and entered a consolidation state characterized by very small candles.
Meanwhile, a descending wedge pattern can be observed in the 4-hour timeframe, with the price currently consolidating within the narrow range. The wedge’s lower trendline coincides with the significant support region at $1.7K, making it a powerful level.
Ultimately, a downward break of the support zone at $1.7K and the lower boundary of the descending wedge could trigger a cascade as long positions get liquidated and selling pressure soars. Conversely, if the price finds support, it could potentially aim for the mid-boundary of the channel and even the resistance region at $2.1K.