Ripple failed to breach the %excerpt%.55 resistance region and experienced a significant plunge of 26%, arriving at the crucial support level of the 100-day moving average. However, the price is likely to consolidate within this range, encountering significant support. Technical Analysis By Shayan The Daily Chart On the daily chart, following Ripple’s rejection from the %excerpt%.58 level, its price suffered a massive decline, experiencing a whopping 26% drop. However, XRP is currently confronting significant support regions consisting of the 100-day moving average at %excerpt%.43 and the 61.8% Fibonacci retracement level at %excerpt%.44. Considering the strength of these support levels, the price seems likely to enter a consolidation phase followed by high volatility. However, if selling pressure on
Topics:
CryptoVizArt considers the following as important: Ripple (XRP) Price, XRP Analysis, xrpbtc, xrpusd
This could be interesting, too:
Jordan Lyanchev writes Ripple’s (XRP) Surge to Triggers Over Million in Short Liquidations
Jordan Lyanchev writes Trump Confirms Work on Strategic Crypto Reserve: XRP, ADA, SOL Included
Dimitar Dzhondzhorov writes Is a Major Ripple v. SEC Lawsuit Development Expected This Week? Here’s Why
Mandy Williams writes Ripple Releases Institutional DeFi Roadmap for XRP Ledger in 2025
Ripple failed to breach the $0.55 resistance region and experienced a significant plunge of 26%, arriving at the crucial support level of the 100-day moving average. However, the price is likely to consolidate within this range, encountering significant support.
Technical Analysis
By Shayan
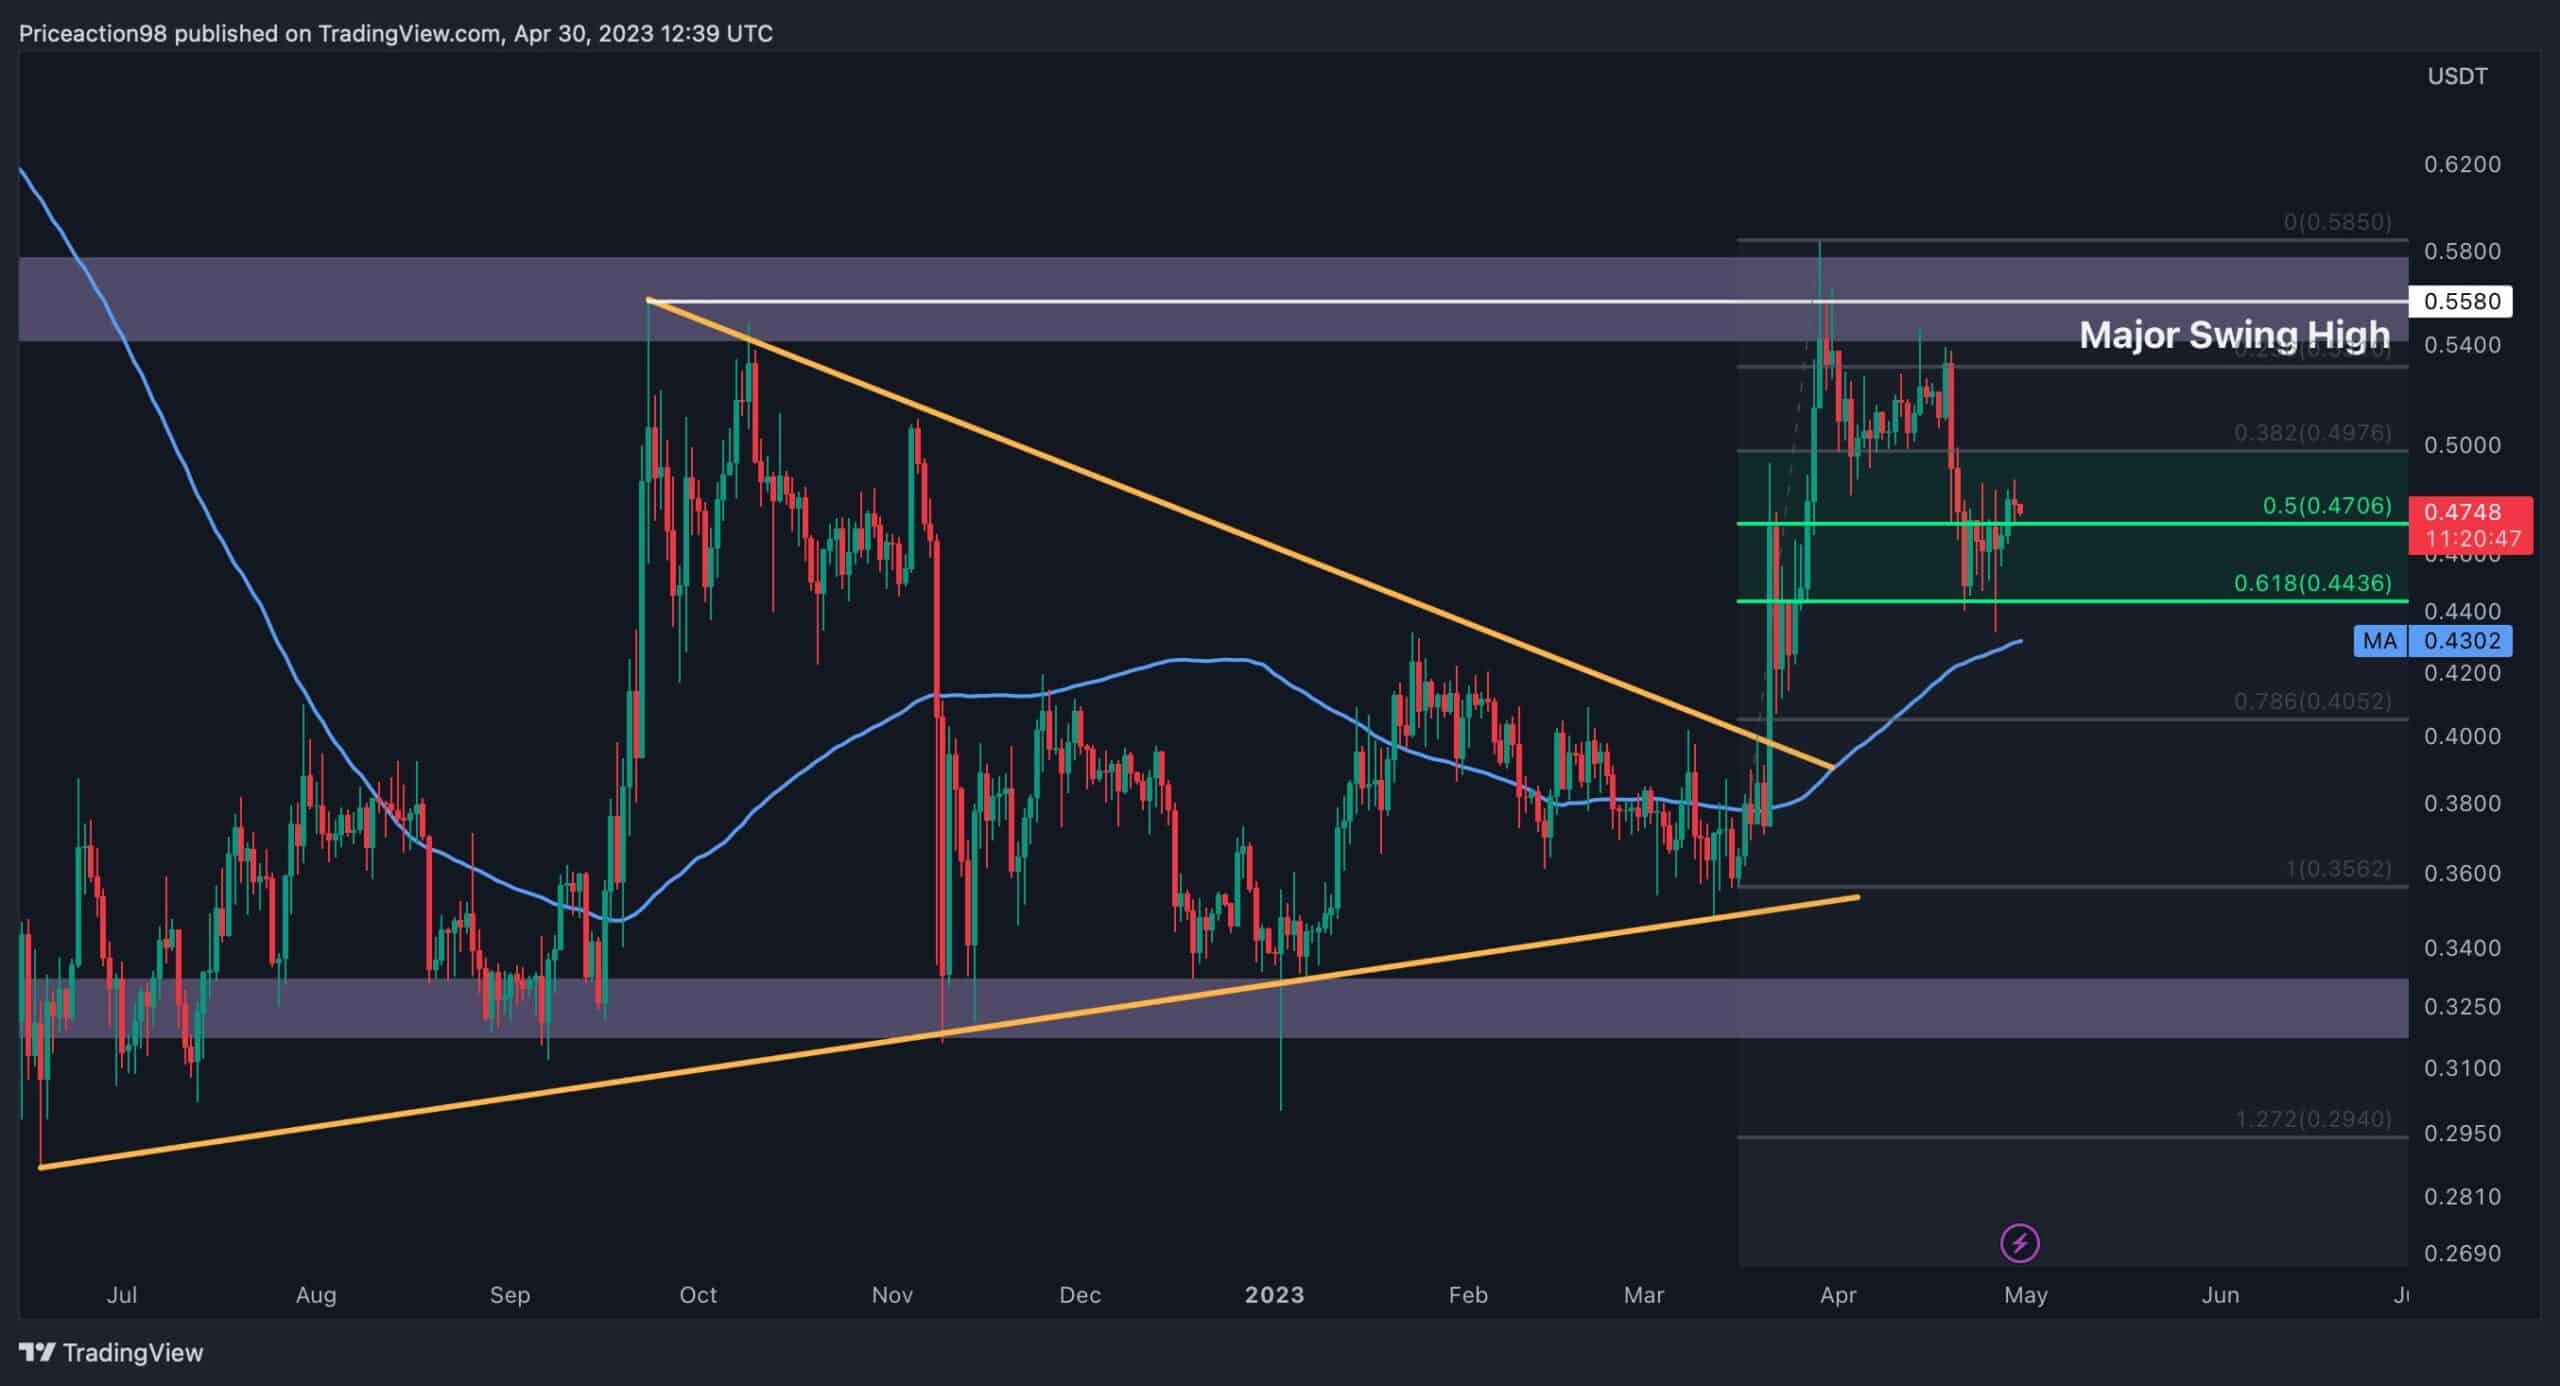
The Daily Chart
On the daily chart, following Ripple’s rejection from the $0.58 level, its price suffered a massive decline, experiencing a whopping 26% drop. However, XRP is currently confronting significant support regions consisting of the 100-day moving average at $0.43 and the 61.8% Fibonacci retracement level at $0.44.
Considering the strength of these support levels, the price seems likely to enter a consolidation phase followed by high volatility. However, if selling pressure on Ripple pushes the price below the 100-day moving average, another drop could occur, which may flush out many long positions from the derivatives market.
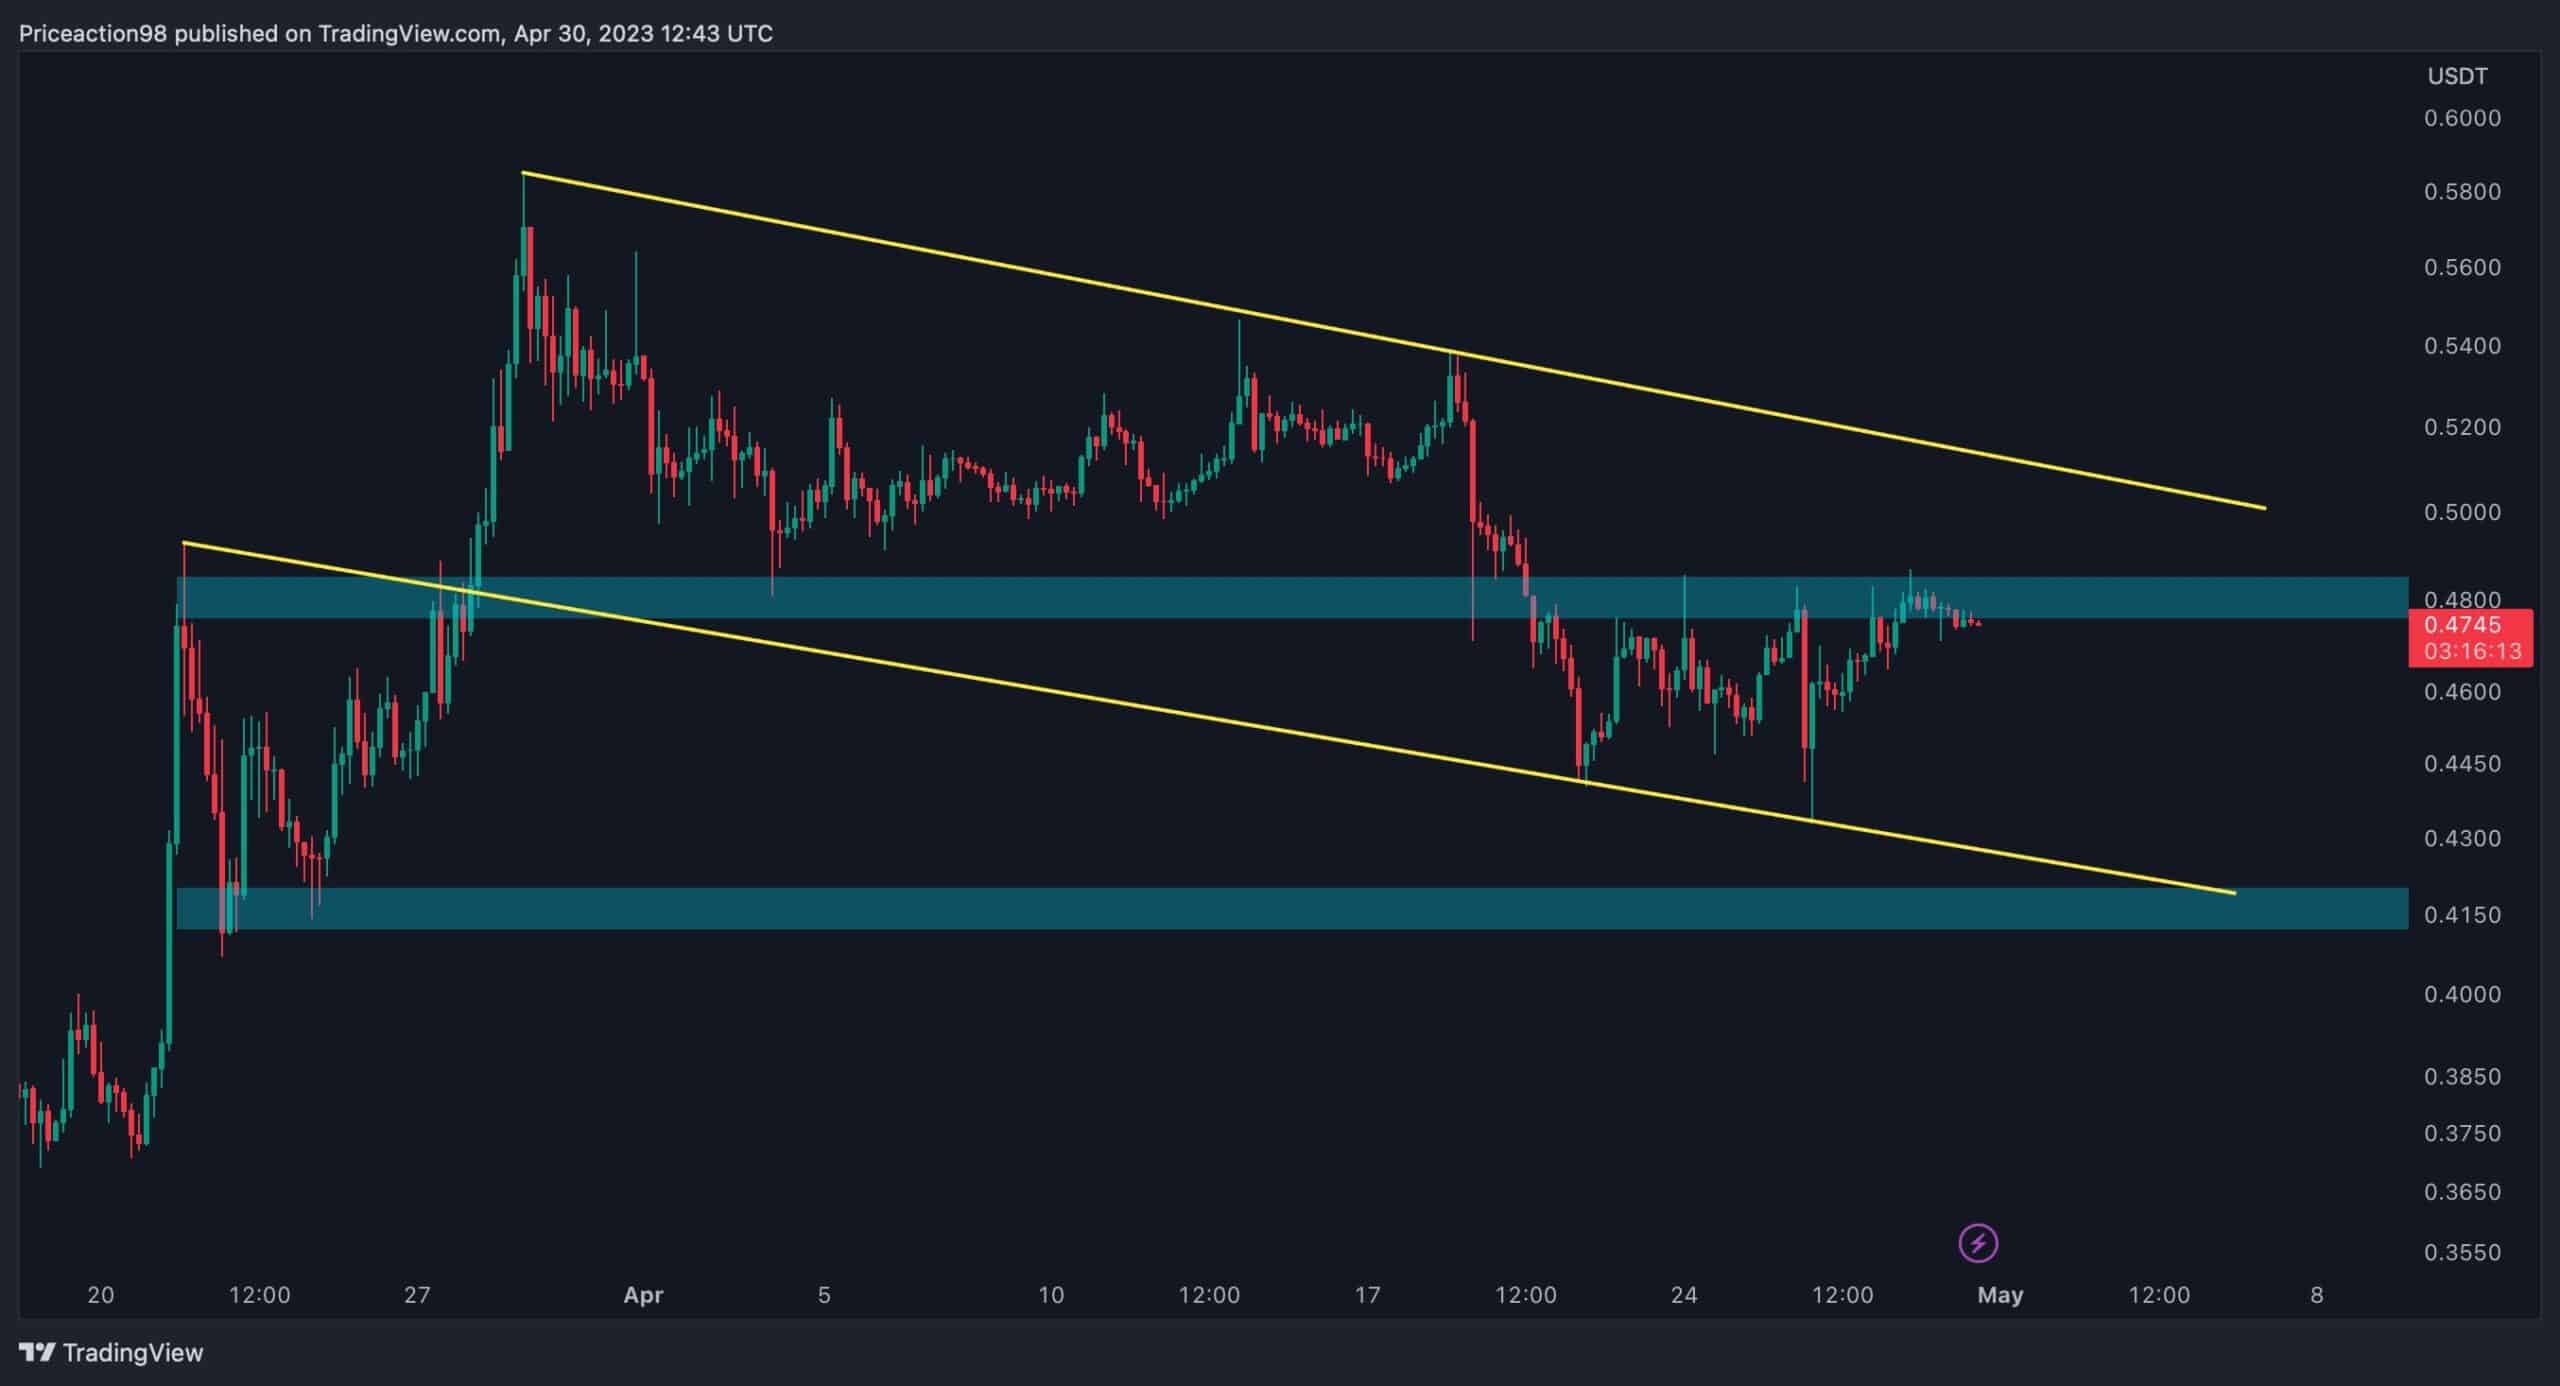
The 4-Hour Chart
On the 4-hour chart, the price has formed a descending price channel. The recent rejection caused XRP to drop below the minor support level of $0.48 and consolidate without a clear direction. Presently, it faces two crucial levels: the $0.48 minor resistance zone and the lower trendline of the channel, which is approximately $0.415.
Based on Ripple’s recent behavior, the market appears to have entered a consolidation stage between $0.415 and $0.48 until a breakout from this range occurs.