Ripple’s price has shown bullish movement in recent weeks. However, there is a notable resistance level that needs to be overcome before a more sustained rally can be anticipated. Technical Analysis By: Edris XRP/USDT Daily Chart: XRP has displayed a consistent upward trend after being rejected from the 200-day moving average of around %excerpt%.4. Additionally, it has surpassed the 50-day moving average of around %excerpt%.45 and appears to be targeting the resistance zone at %excerpt%.6 in the short term. A successful breakthrough of the %excerpt%.6 level would likely initiate a bullish phase, with the price potentially reaching as high as %excerpt%.9 in the mid-term. However, it is worth noting that the RSI has recently indicated an overbought condition, suggesting the possibility of a pullback or a
Topics:
CryptoVizArt considers the following as important: Ripple (XRP) Price, XRP Analysis, xrpbtc, xrpusd
This could be interesting, too:
Jordan Lyanchev writes Ripple’s (XRP) Surge to Triggers Over Million in Short Liquidations
Jordan Lyanchev writes Trump Confirms Work on Strategic Crypto Reserve: XRP, ADA, SOL Included
Dimitar Dzhondzhorov writes Is a Major Ripple v. SEC Lawsuit Development Expected This Week? Here’s Why
Mandy Williams writes Ripple Releases Institutional DeFi Roadmap for XRP Ledger in 2025
Ripple’s price has shown bullish movement in recent weeks. However, there is a notable resistance level that needs to be overcome before a more sustained rally can be anticipated.
Technical Analysis
By: Edris
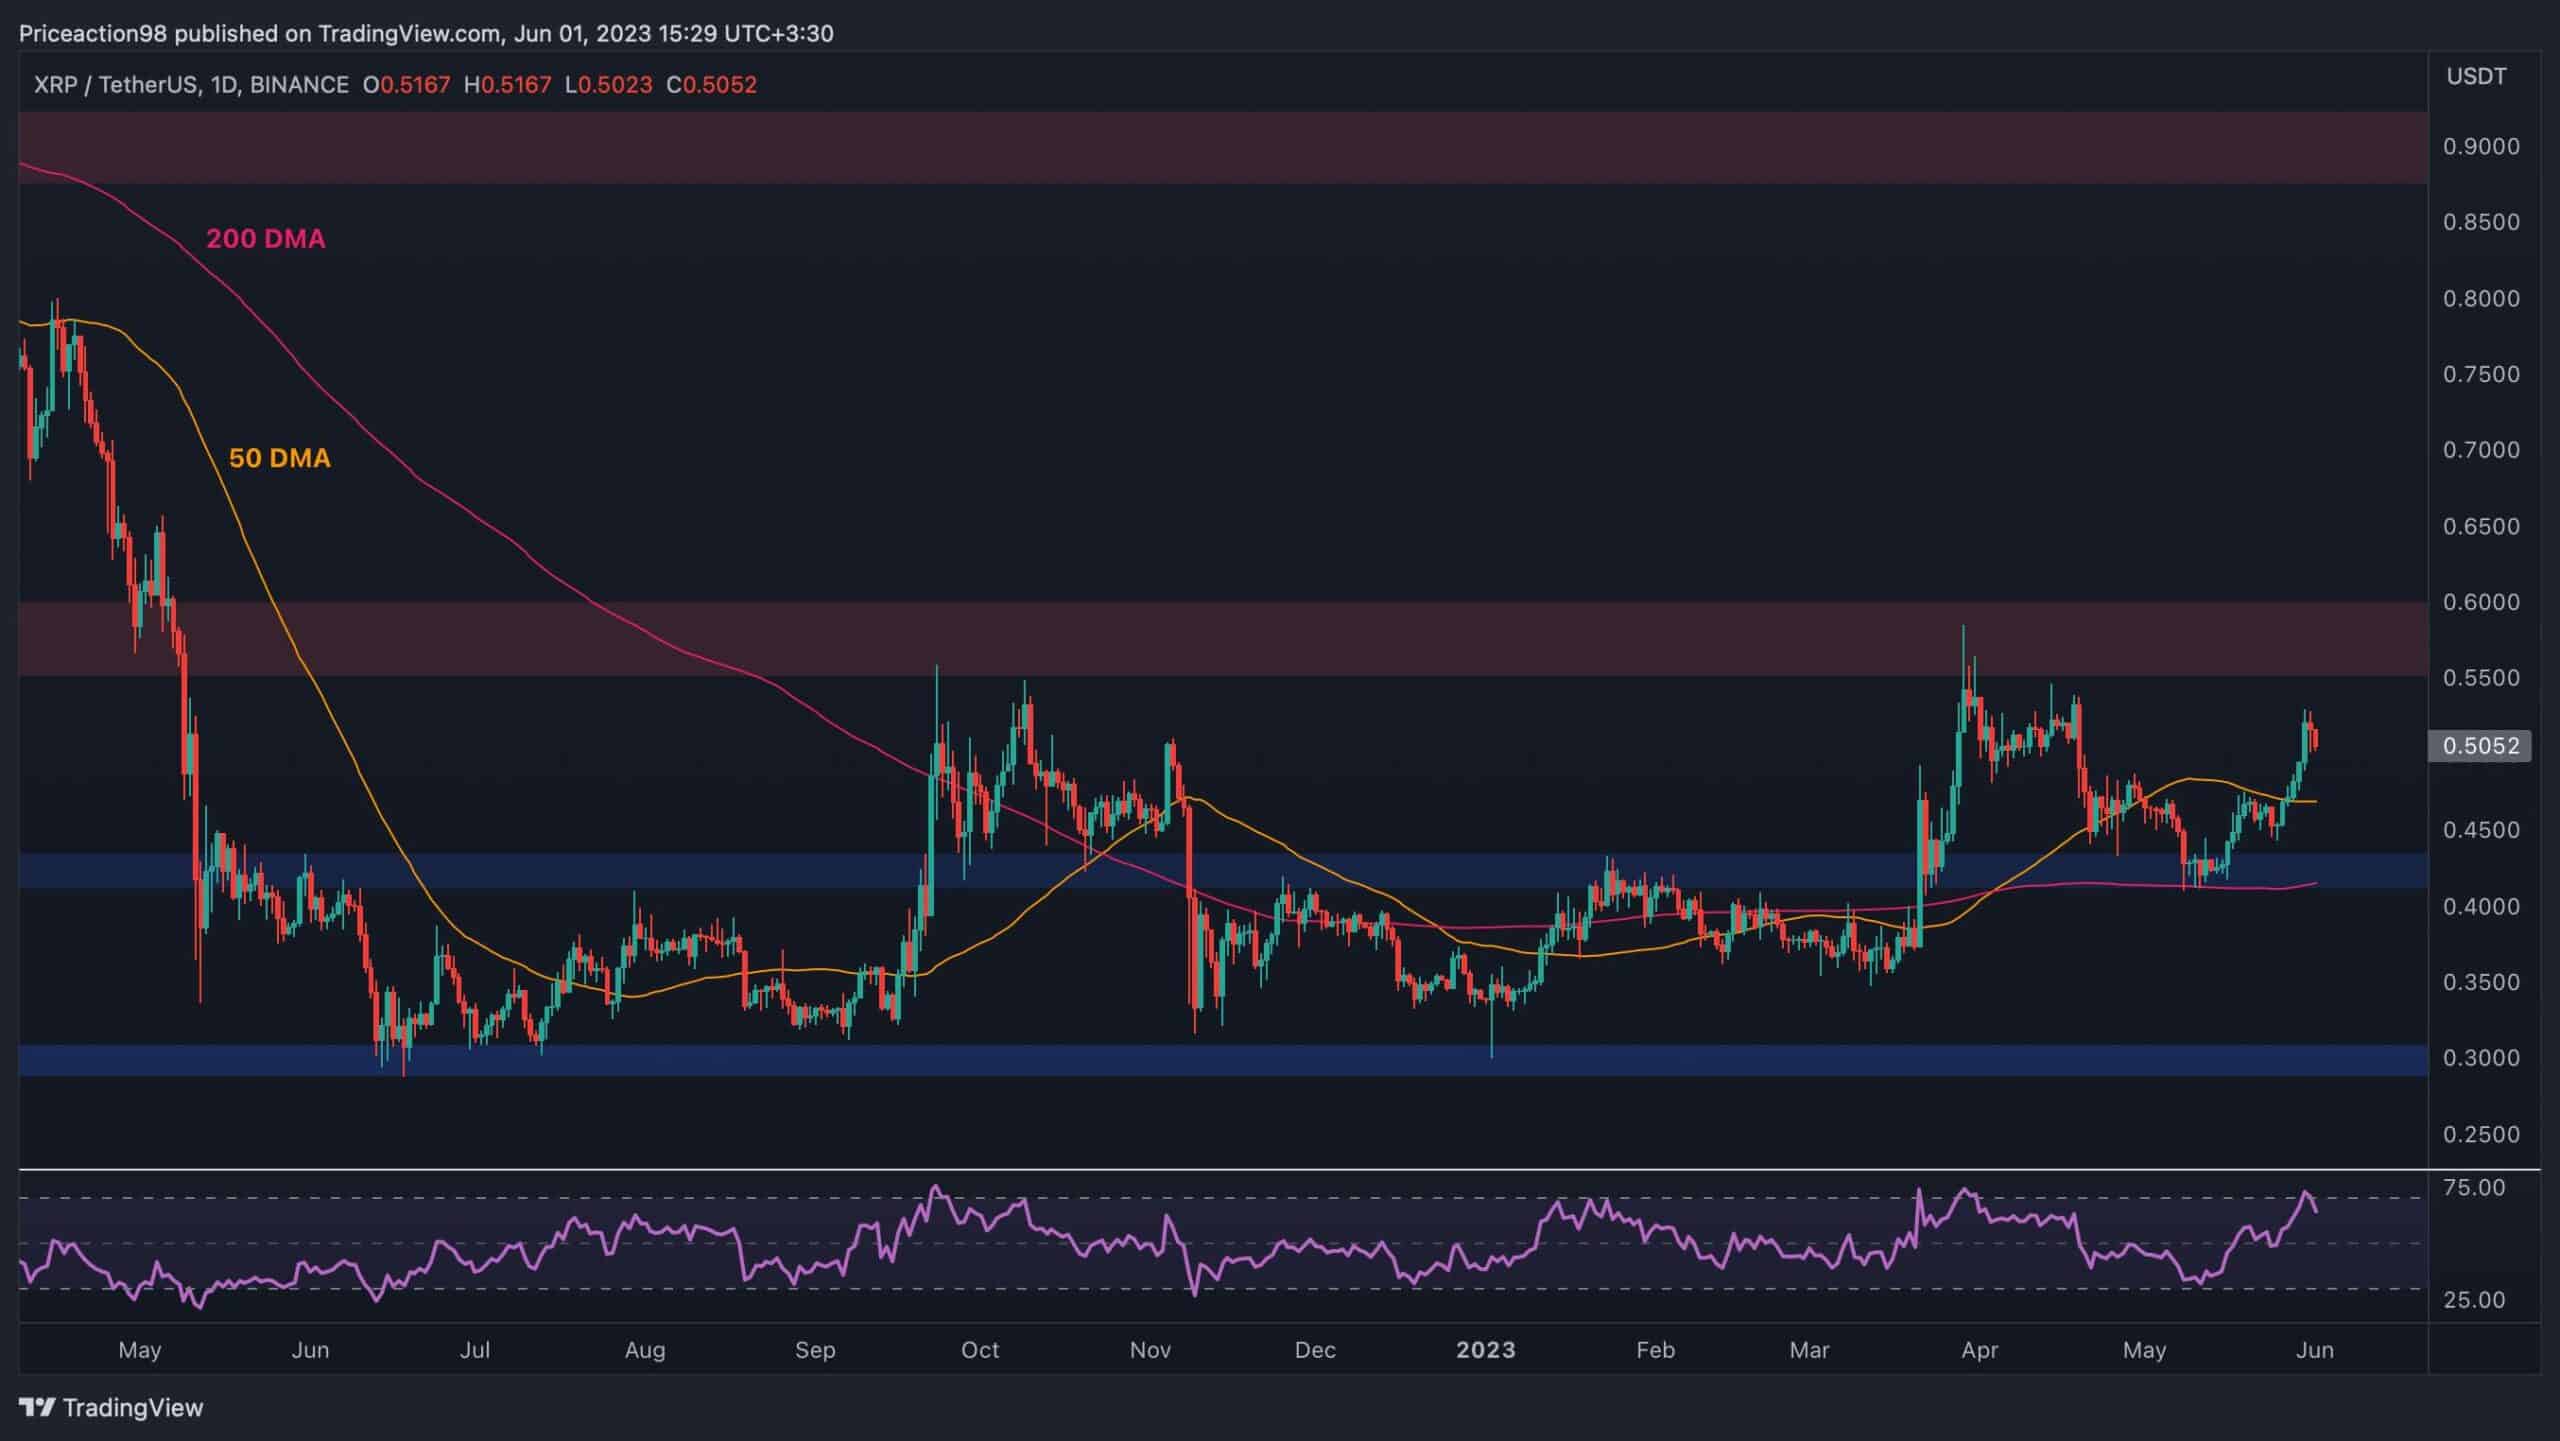
XRP/USDT Daily Chart:
XRP has displayed a consistent upward trend after being rejected from the 200-day moving average of around $0.4. Additionally, it has surpassed the 50-day moving average of around $0.45 and appears to be targeting the resistance zone at $0.6 in the short term.
A successful breakthrough of the $0.6 level would likely initiate a bullish phase, with the price potentially reaching as high as $0.9 in the mid-term. However, it is worth noting that the RSI has recently indicated an overbought condition, suggesting the possibility of a pullback or a period of consolidation in the upcoming days.
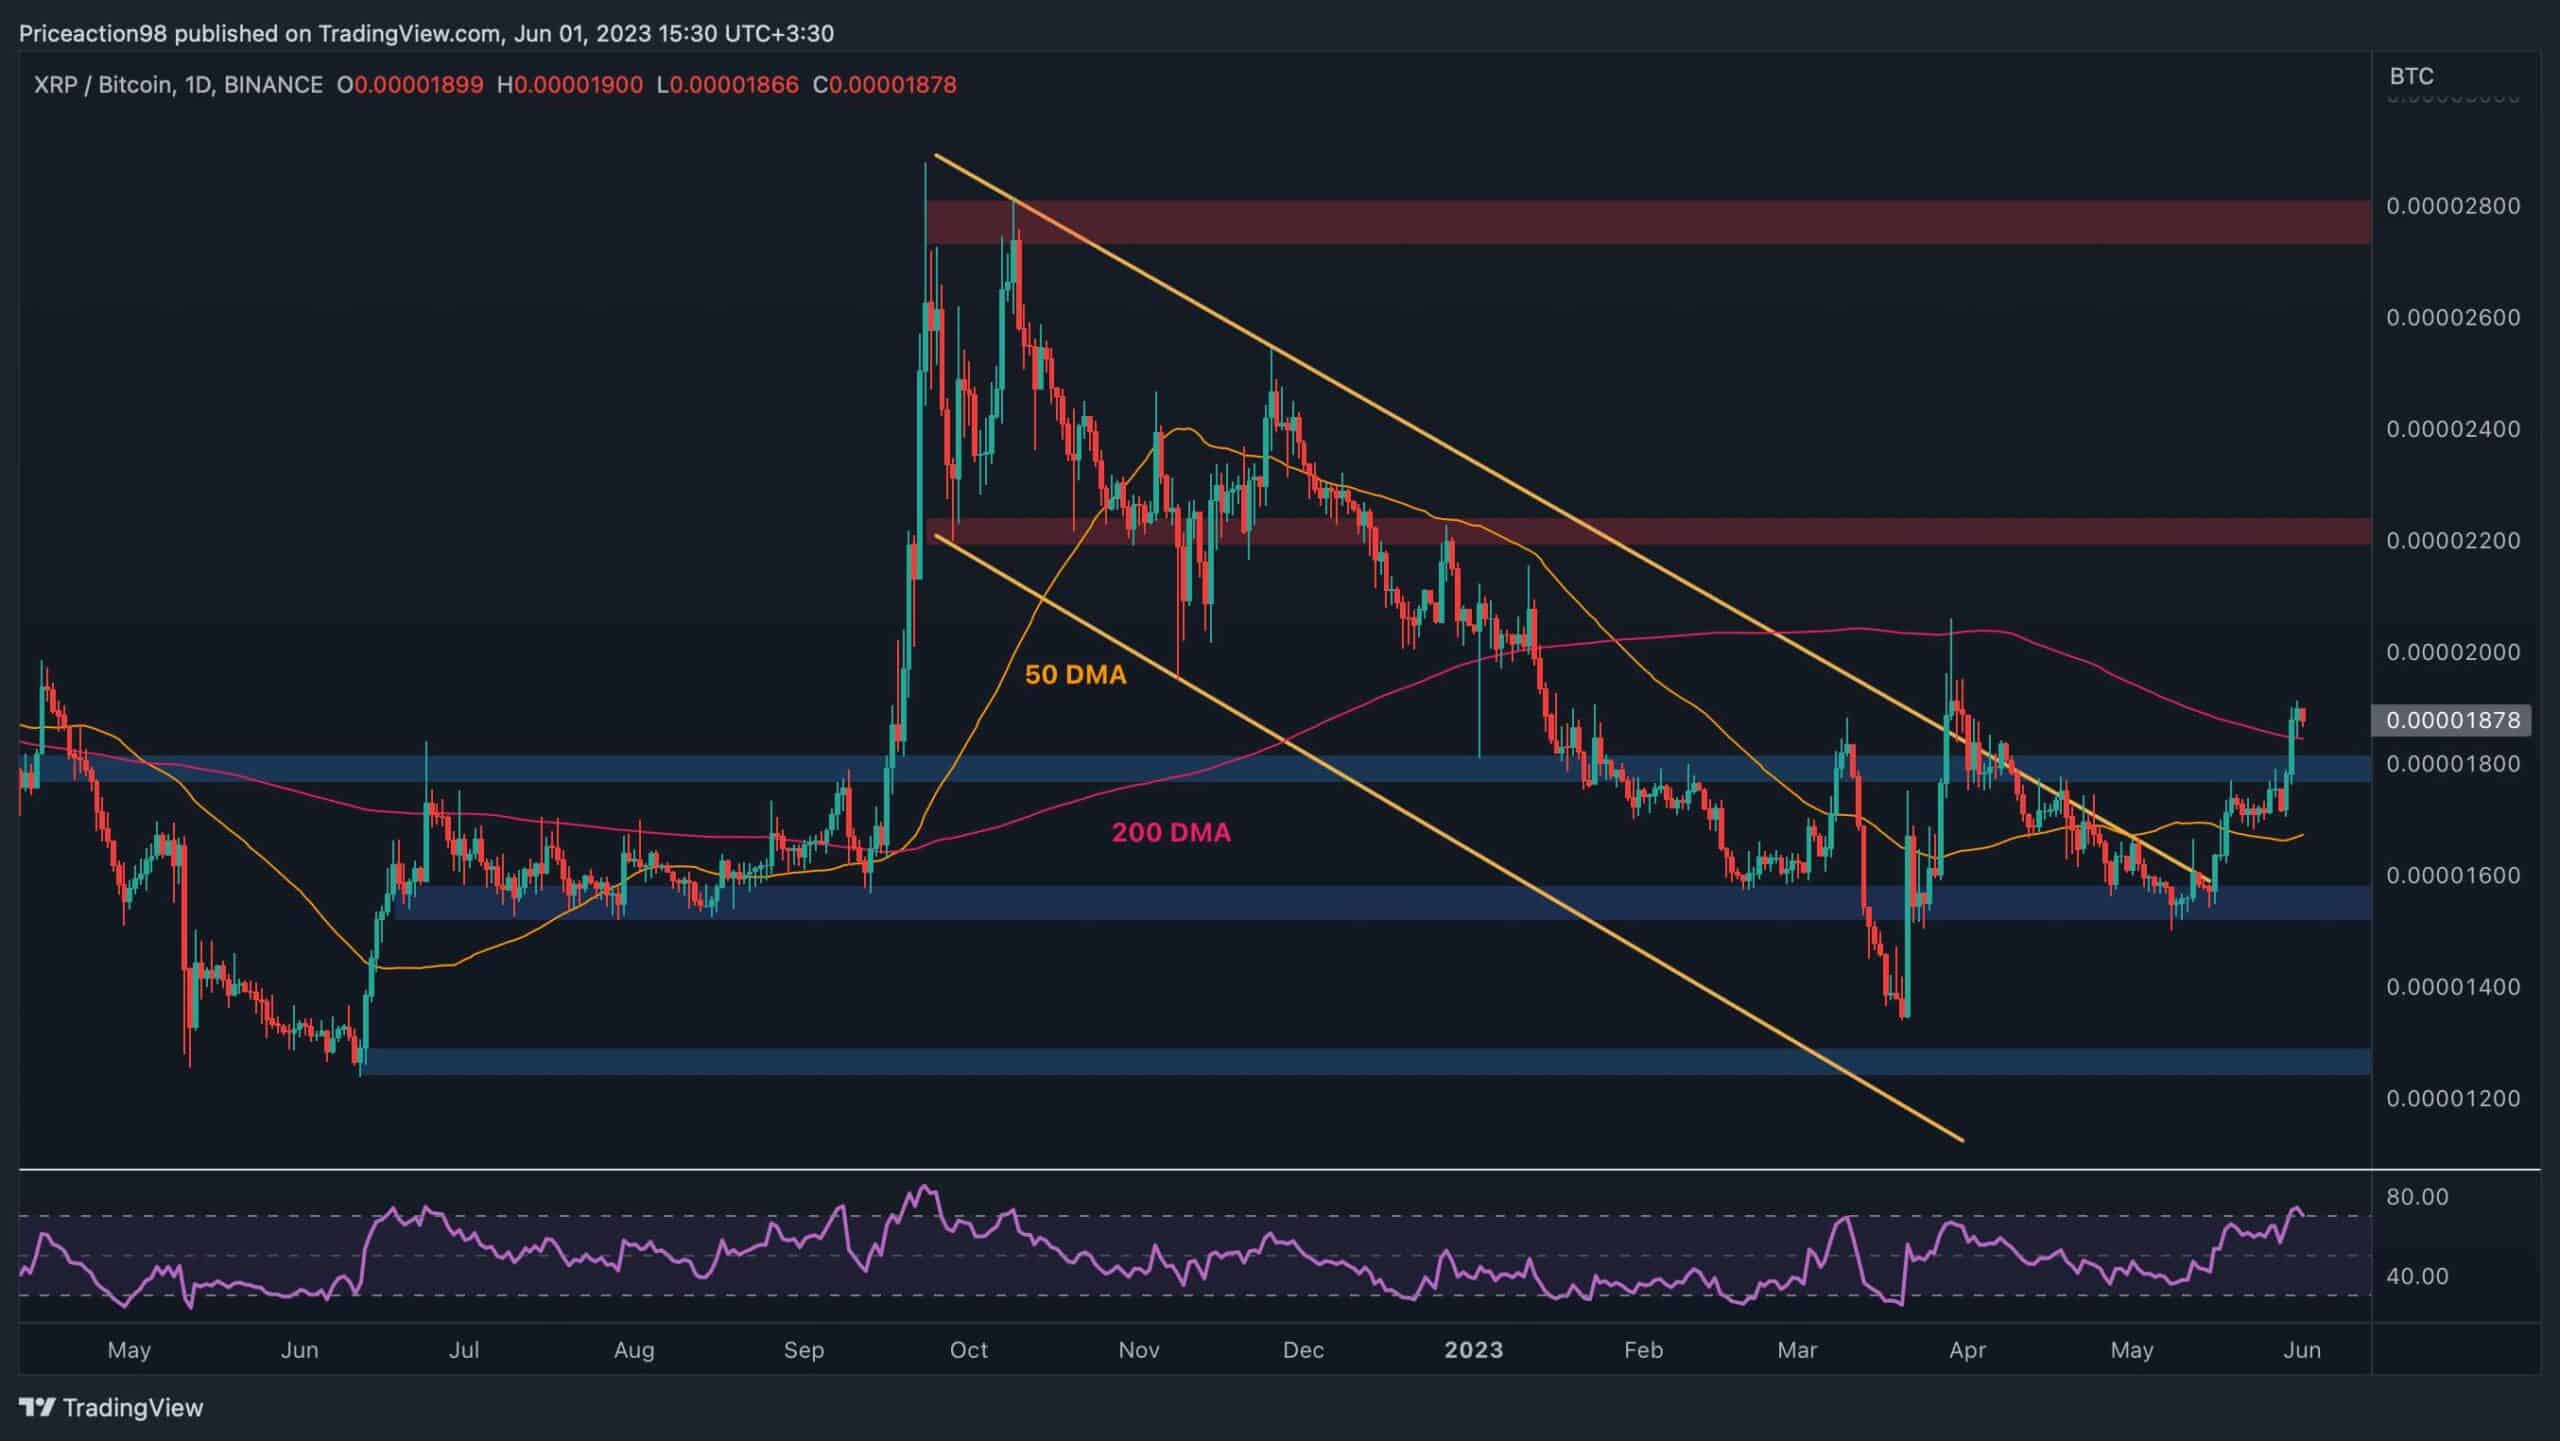
XRP/BTC Daily Chart
The price has successfully broken out of the significant descending channel after finding support near the 0.000016 SAT level. Furthermore, both the 50-day moving average, positioned around 0.000017 SAT, and the static resistance level at 0.000018 SAT have been surpassed.
The price is attempting to breach the 200-day moving average; however, the RSI’s overbought signal suggests the potential for a short-term correction. In such a scenario, both the 0.000018 SAT level and the 50-day moving average are likely to be retested, providing support to the market.