Ripple’s price has encountered significant resistance, which threatens the continuation of its recent rally. However, there seems to be a favorable probability for the cryptocurrency to advance further in the upcoming weeks, as several nearby support levels are in place – at least from a technical analysis standpoint. Ripple Price Technical Analysis By: Edris XRP/USDT Daily Chart: XRP’s price has been unable to surpass the %excerpt%.55 level, leading to a period of trading below this resistance level. The initial support level to watch is the 50-day moving average at approximately %excerpt%.48, followed by the %excerpt%.43 level and the 3200-day moving average in the same price range. If XRP manages to break above the %excerpt%.55 area, it could initiate a notable upward trend in the near future.
Topics:
CryptoVizArt considers the following as important: Ripple (XRP) Price, XRP Analysis, xrpbtc, xrpusd
This could be interesting, too:
Jordan Lyanchev writes Ripple’s (XRP) Surge to Triggers Over Million in Short Liquidations
Jordan Lyanchev writes Trump Confirms Work on Strategic Crypto Reserve: XRP, ADA, SOL Included
Dimitar Dzhondzhorov writes Is a Major Ripple v. SEC Lawsuit Development Expected This Week? Here’s Why
Mandy Williams writes Ripple Releases Institutional DeFi Roadmap for XRP Ledger in 2025
Ripple’s price has encountered significant resistance, which threatens the continuation of its recent rally.
However, there seems to be a favorable probability for the cryptocurrency to advance further in the upcoming weeks, as several nearby support levels are in place – at least from a technical analysis standpoint.
Ripple Price Technical Analysis
By: Edris
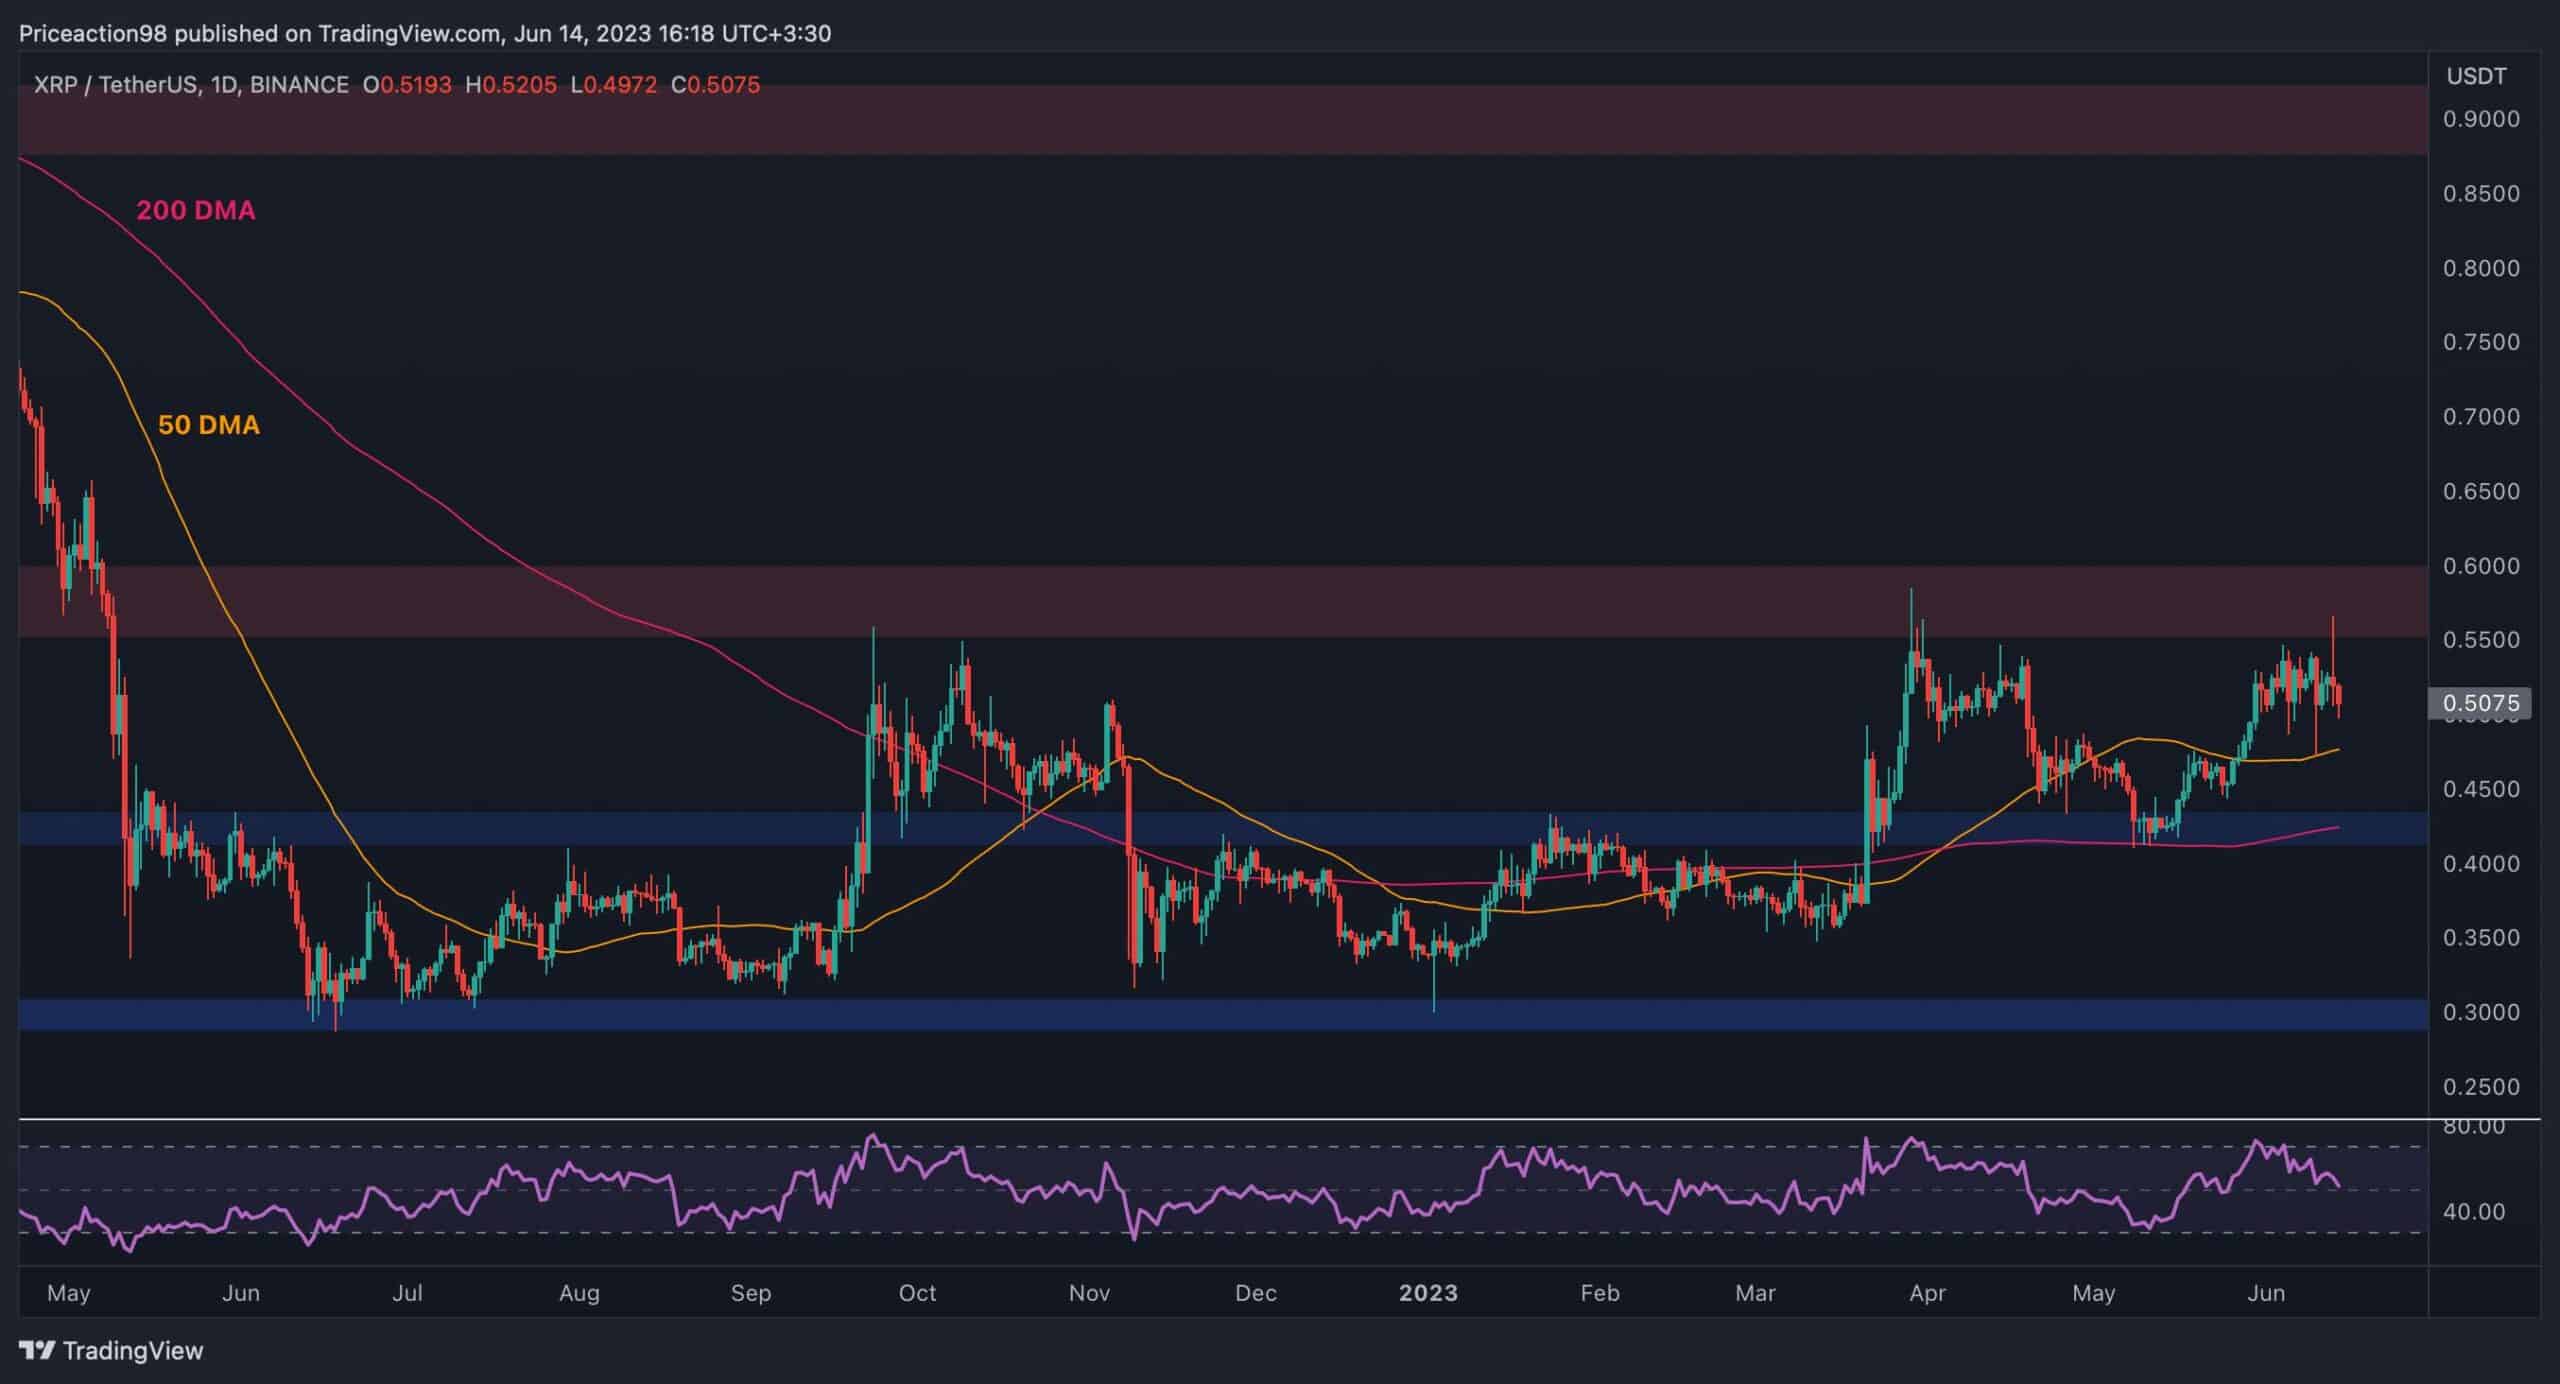
XRP/USDT Daily Chart:
XRP’s price has been unable to surpass the $0.55 level, leading to a period of trading below this resistance level.
The initial support level to watch is the 50-day moving average at approximately $0.48, followed by the $0.43 level and the 3200-day moving average in the same price range. If XRP manages to break above the $0.55 area, it could initiate a notable upward trend in the near future.
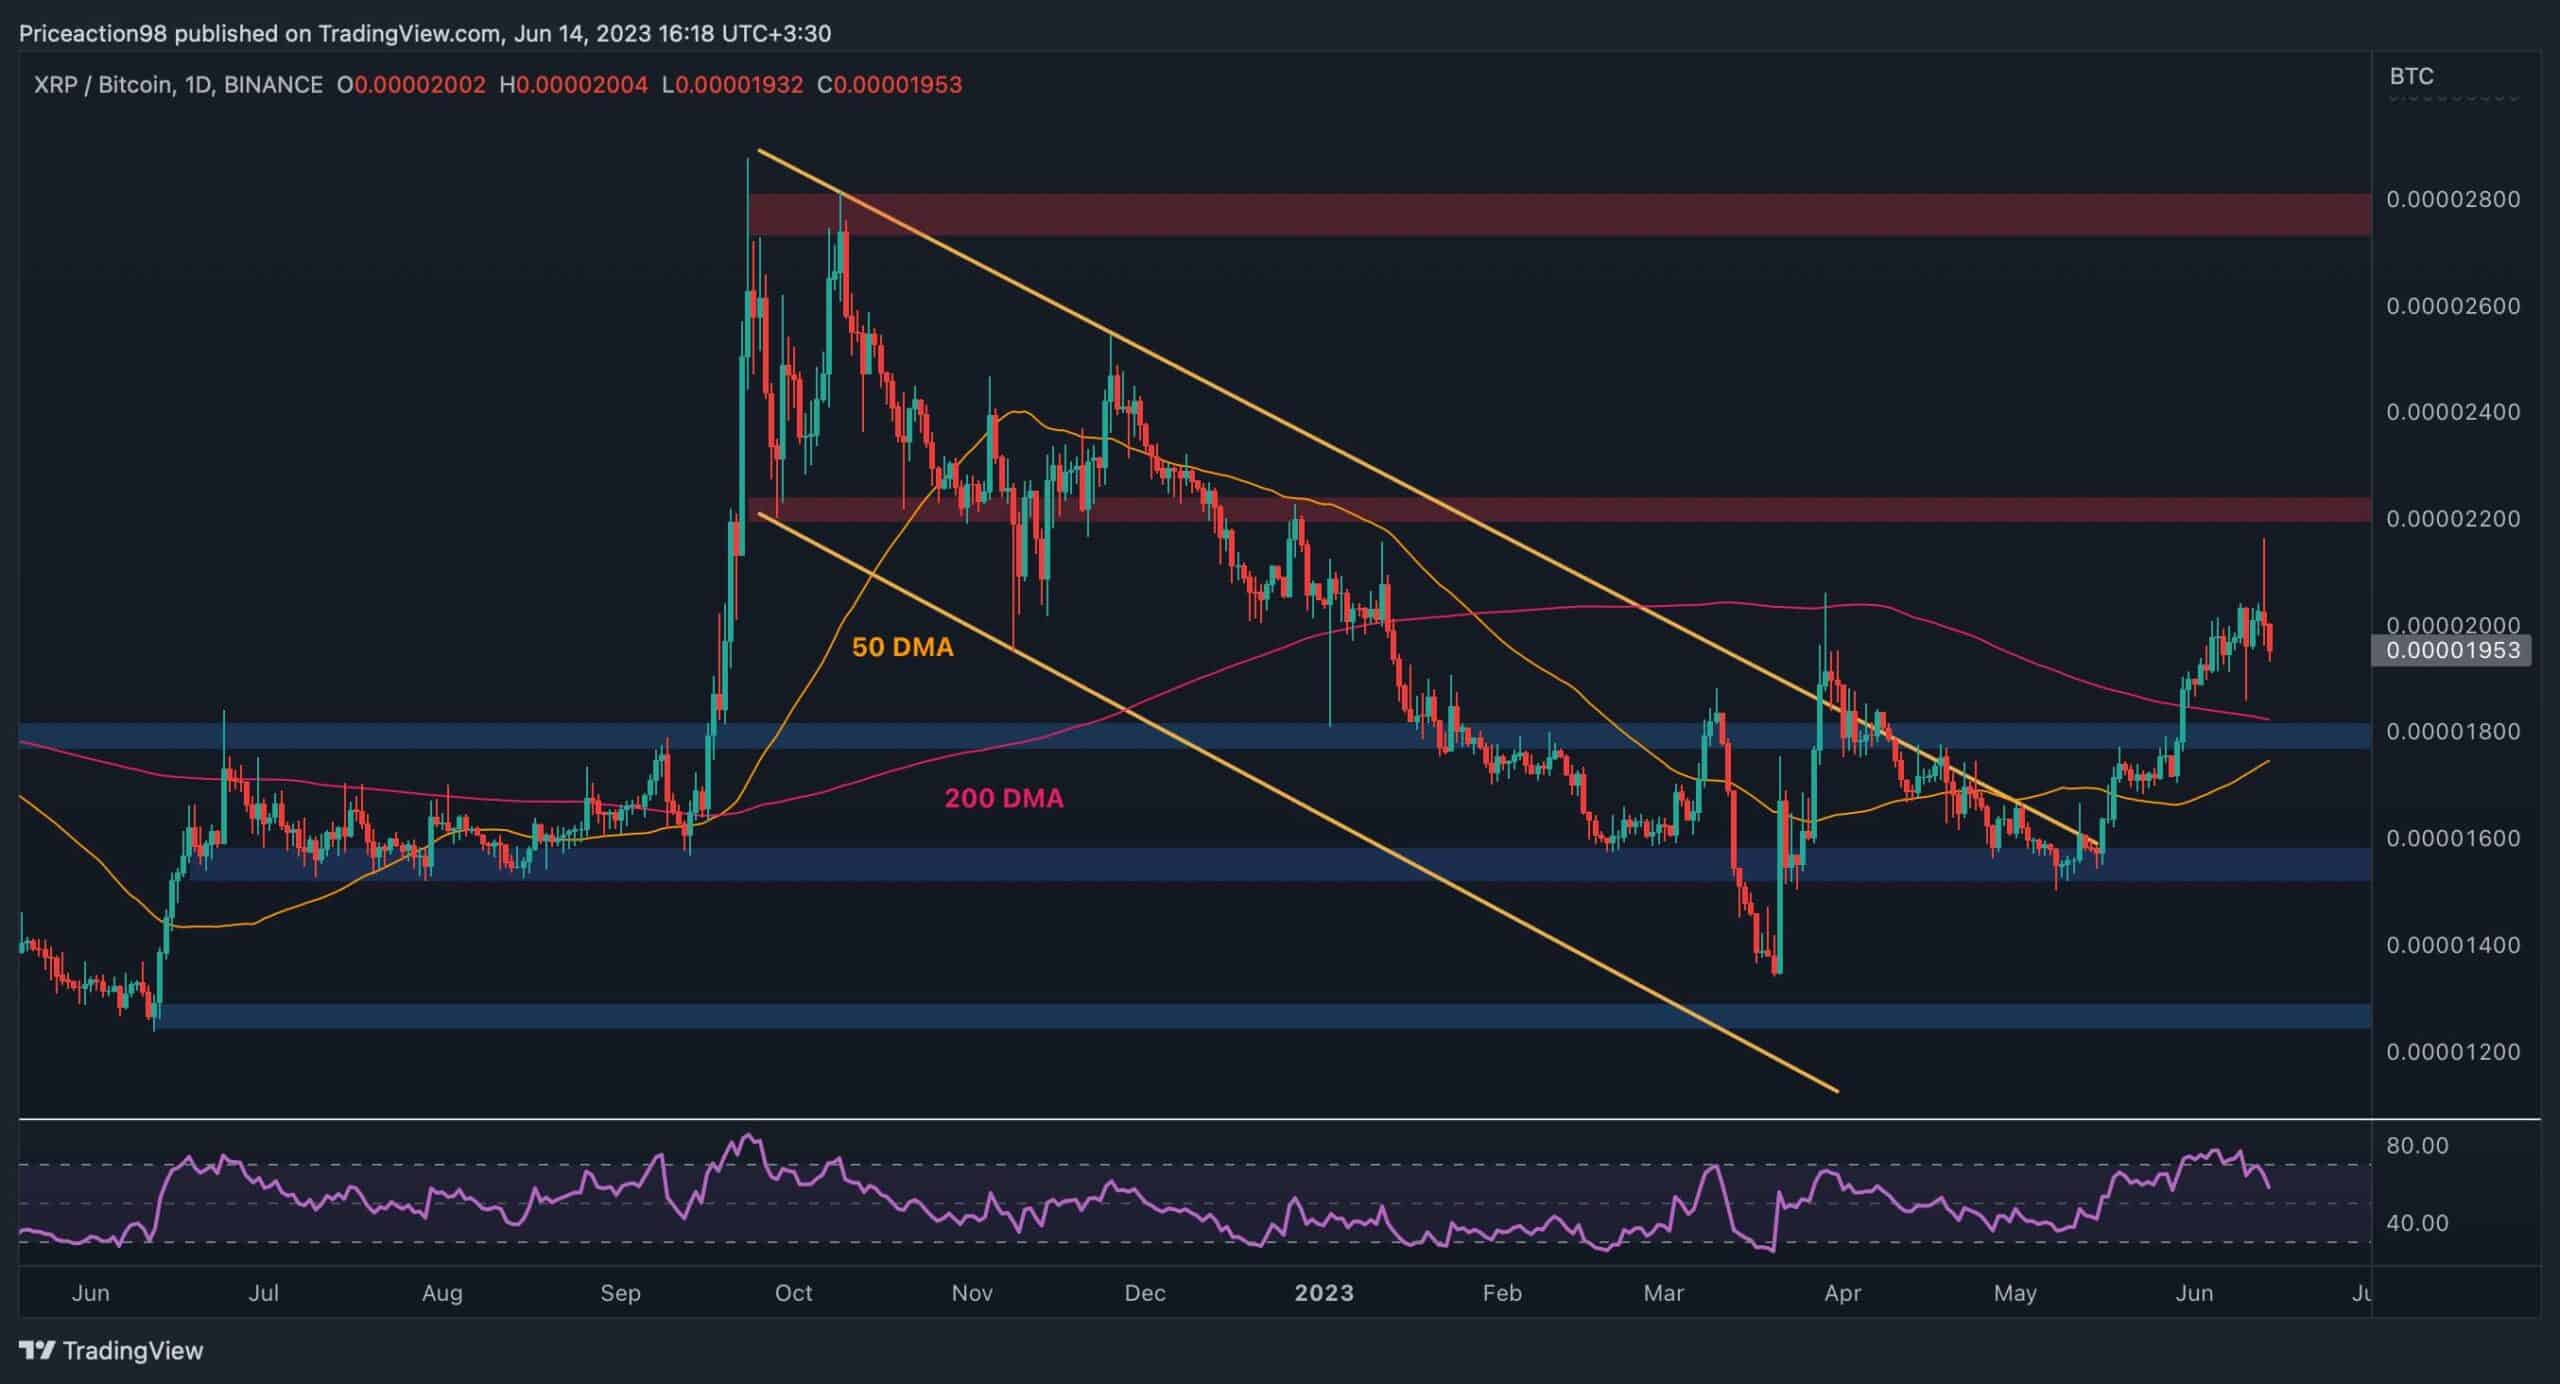
XRP/BTC Daily Chart
Against BTC, the chart presents a similar scenario, where the XRP price experienced a rally in recent months before facing rejection at the 2200 SAT resistance level.
The cryptocurrency is in a consolidation phase around the 2000 SAT level. The 200-day and 50-day moving averages converge around 1800 SAT, which provides solid static support. Given the cluster of nearby support levels, it is highly probable that the price might revisit and potentially rechallenge the 2200 SAT level in the near future.