Ripple’s price is currently hovering near a crucial support region which consists of both the 200-day moving average and the %excerpt%.41 price zone. A breach below this critical level could potentially trigger a significant downturn toward the descending trendline. Technical Analysis By Shayan The Daily Chart On the daily chart, it’s apparent that after the recent weeks of rejection, the price has arrived at a strong support area at the 200-day moving average of %excerpt%.41. Considering the power of this moving average, XRP may enter a consolidation phase. However, if the price fails to hold above this crucial support zone, it could trigger a cascade leading to bearish sentiment over the market. Conversely, if the cryptocurrency finds support at the 200-day moving average, buyers can
Topics:
CryptoVizArt considers the following as important: Ripple (XRP) Price, XRP Analysis, xrpbtc, xrpusd
This could be interesting, too:
Jordan Lyanchev writes Ripple’s (XRP) Surge to Triggers Over Million in Short Liquidations
Jordan Lyanchev writes Trump Confirms Work on Strategic Crypto Reserve: XRP, ADA, SOL Included
Dimitar Dzhondzhorov writes Is a Major Ripple v. SEC Lawsuit Development Expected This Week? Here’s Why
Mandy Williams writes Ripple Releases Institutional DeFi Roadmap for XRP Ledger in 2025
Ripple’s price is currently hovering near a crucial support region which consists of both the 200-day moving average and the $0.41 price zone. A breach below this critical level could potentially trigger a significant downturn toward the descending trendline.
Technical Analysis
By Shayan
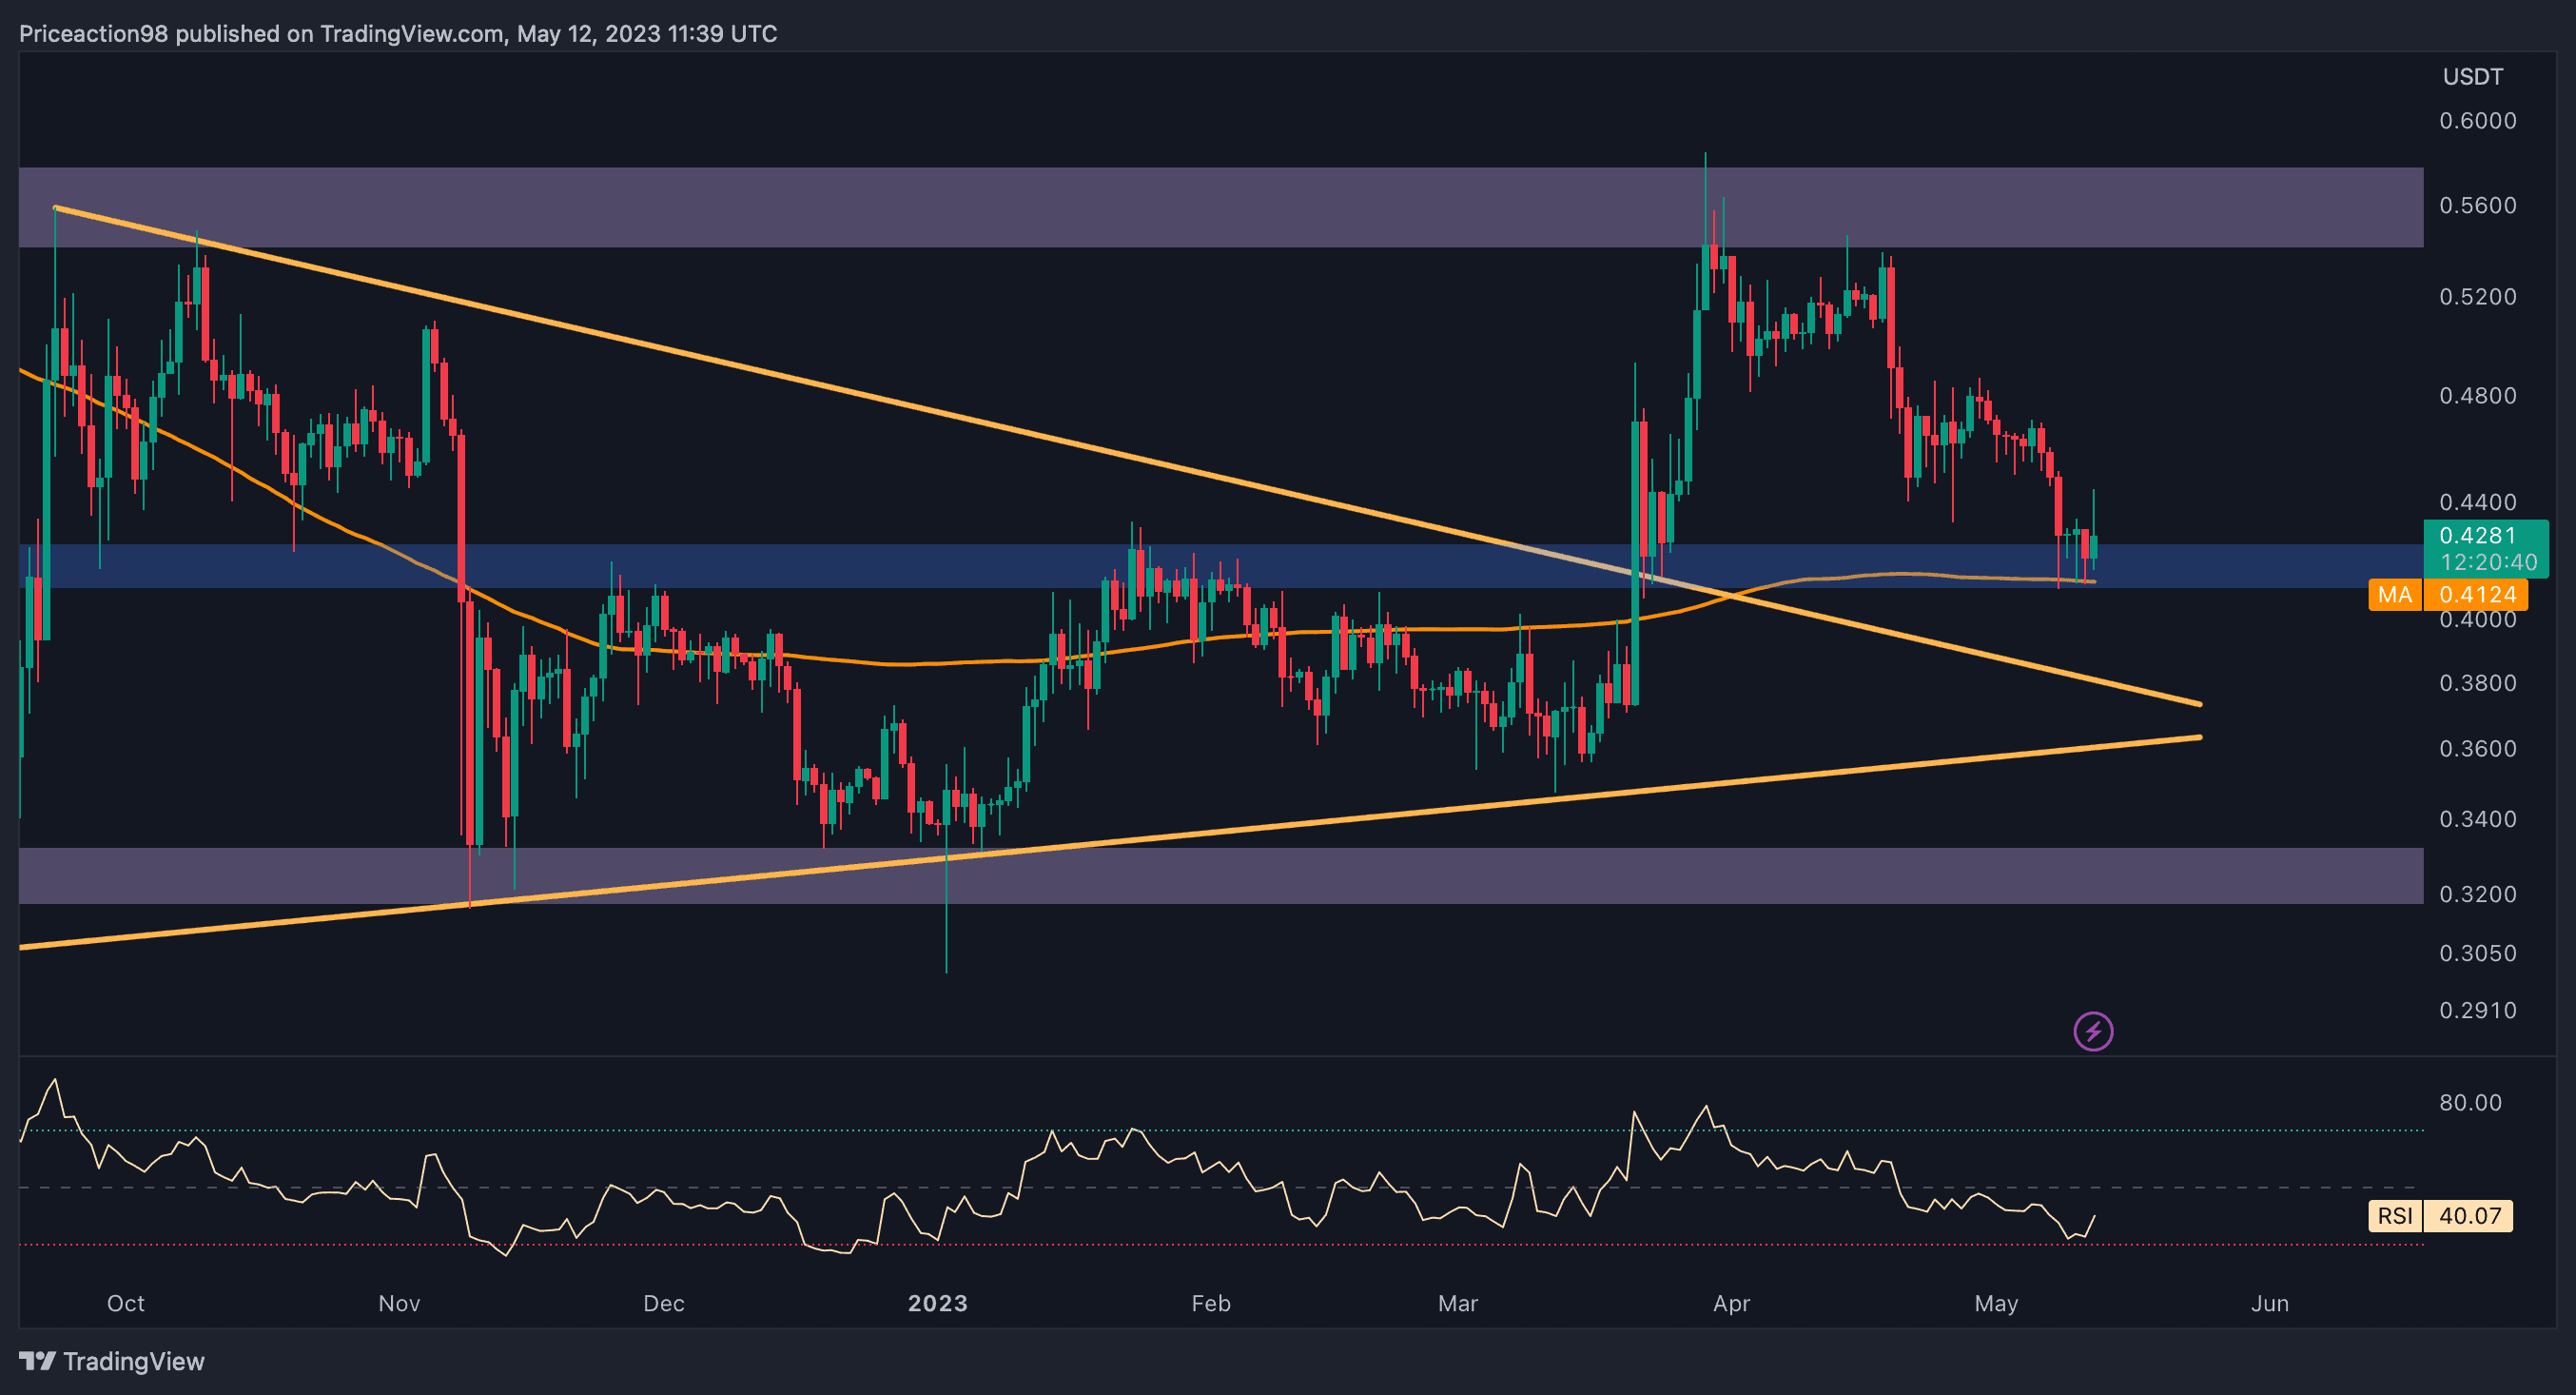
The Daily Chart
On the daily chart, it’s apparent that after the recent weeks of rejection, the price has arrived at a strong support area at the 200-day moving average of $0.41. Considering the power of this moving average, XRP may enter a consolidation phase.
However, if the price fails to hold above this crucial support zone, it could trigger a cascade leading to bearish sentiment over the market. Conversely, if the cryptocurrency finds support at the 200-day moving average, buyers can hope for a mid-term uptrend toward the $0.56 resistance level.
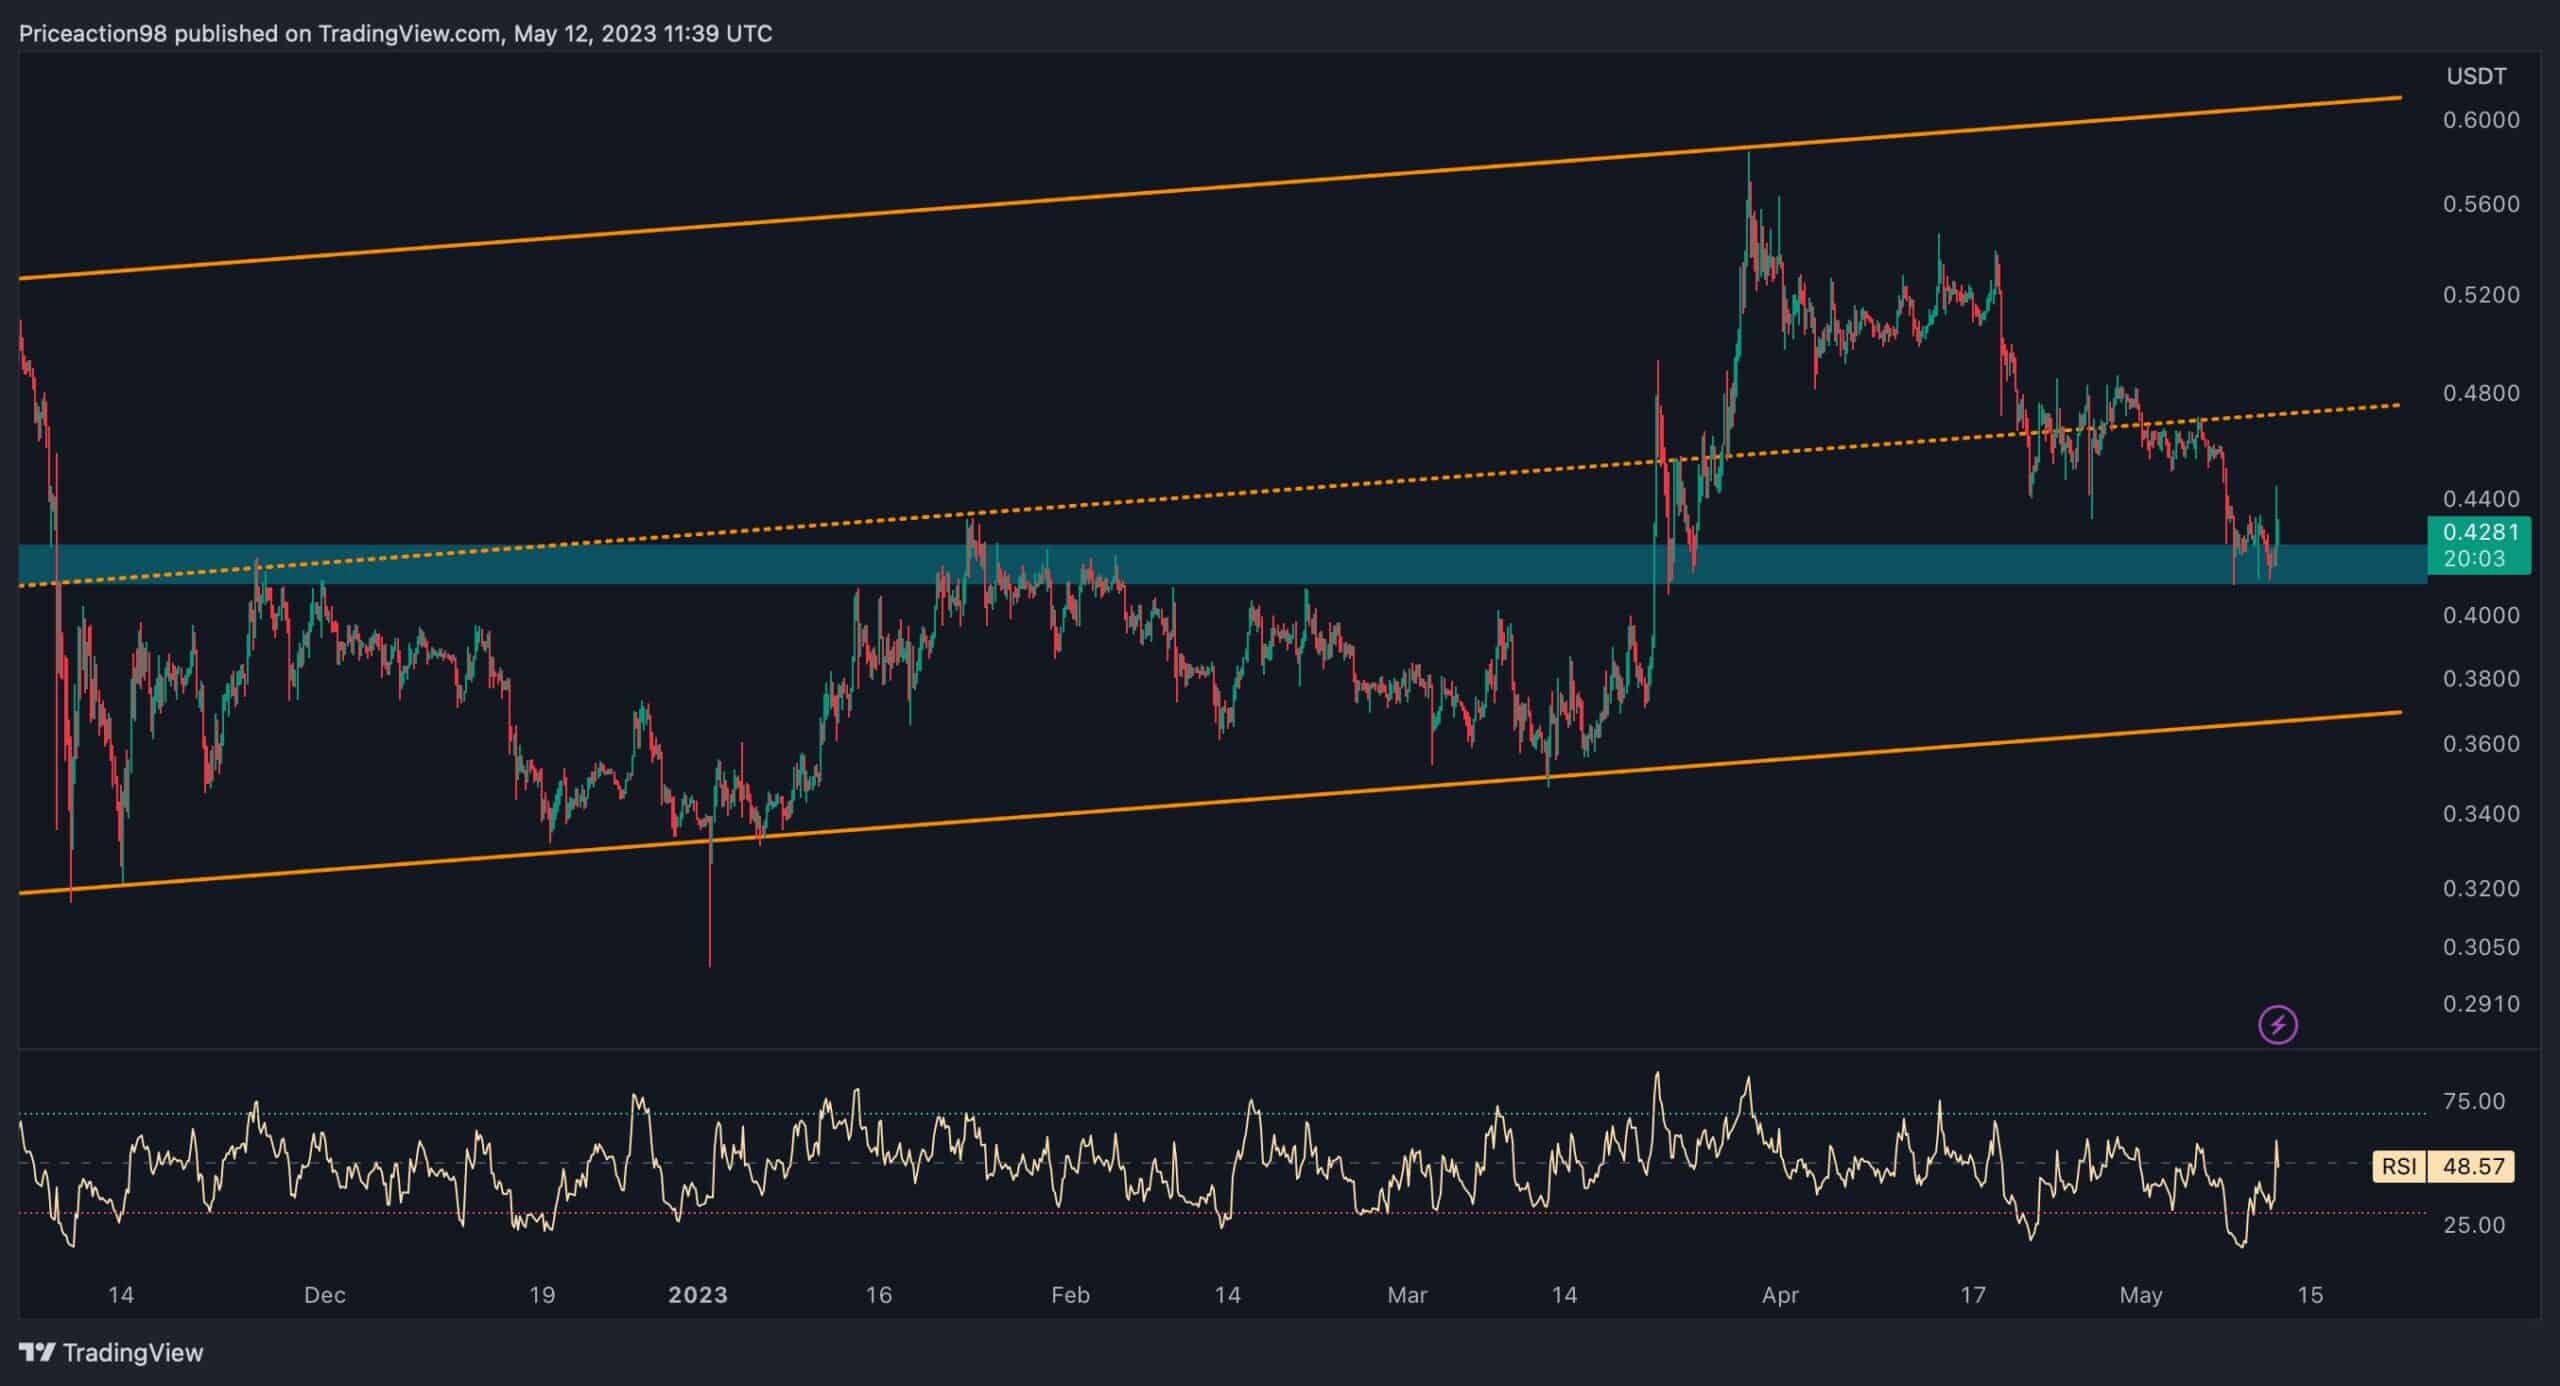
The 4-Hour Chart
On the 4-Hour Chart, Ripple’s price has formed an ascending channel. The recent rejection has caused it to drop below the minor support level of $0.48 and the channel’s mid-trend line. Currently, the price faces a crucial support level at $0.41.
In summary, this PA is supportive of a potential consolidation stage around the mentioned support area until a breakout occurs. However, it’s important to see how the price will actually react, as this would probably give us a clue about the short-term trend.