Ripples price has been sinking over the last few months following a clear rejection from a key resistance level. It is currently within a decisive area, and the outcome would likely determine the mid-term trend of the market. Technical Analysis By: Edris XRP/USDT Daily Chart The price has been making lower highs and lows recently, following the significant rally in early May. The bearish reversal at the %excerpt%.6 area has initiated the current downtrend, but the cryptocurrency is currently testing a key support level around both the %excerpt%.42 mark and the 200-day moving average. A break below these levels would be catastrophic for Ripple, as the market could rapidly plunge toward %excerpt%.3, and potentially even lower, in the short term. On the other hand, if a rebound occurs, the 50-day
Topics:
CryptoVizArt considers the following as important: Ripple (XRP) Price, XRP Analysis, xrpbtc, xrpusd
This could be interesting, too:
Jordan Lyanchev writes Ripple’s (XRP) Surge to Triggers Over Million in Short Liquidations
Jordan Lyanchev writes Trump Confirms Work on Strategic Crypto Reserve: XRP, ADA, SOL Included
Dimitar Dzhondzhorov writes Is a Major Ripple v. SEC Lawsuit Development Expected This Week? Here’s Why
Mandy Williams writes Ripple Releases Institutional DeFi Roadmap for XRP Ledger in 2025
Ripples price has been sinking over the last few months following a clear rejection from a key resistance level. It is currently within a decisive area, and the outcome would likely determine the mid-term trend of the market.
Technical Analysis
By: Edris
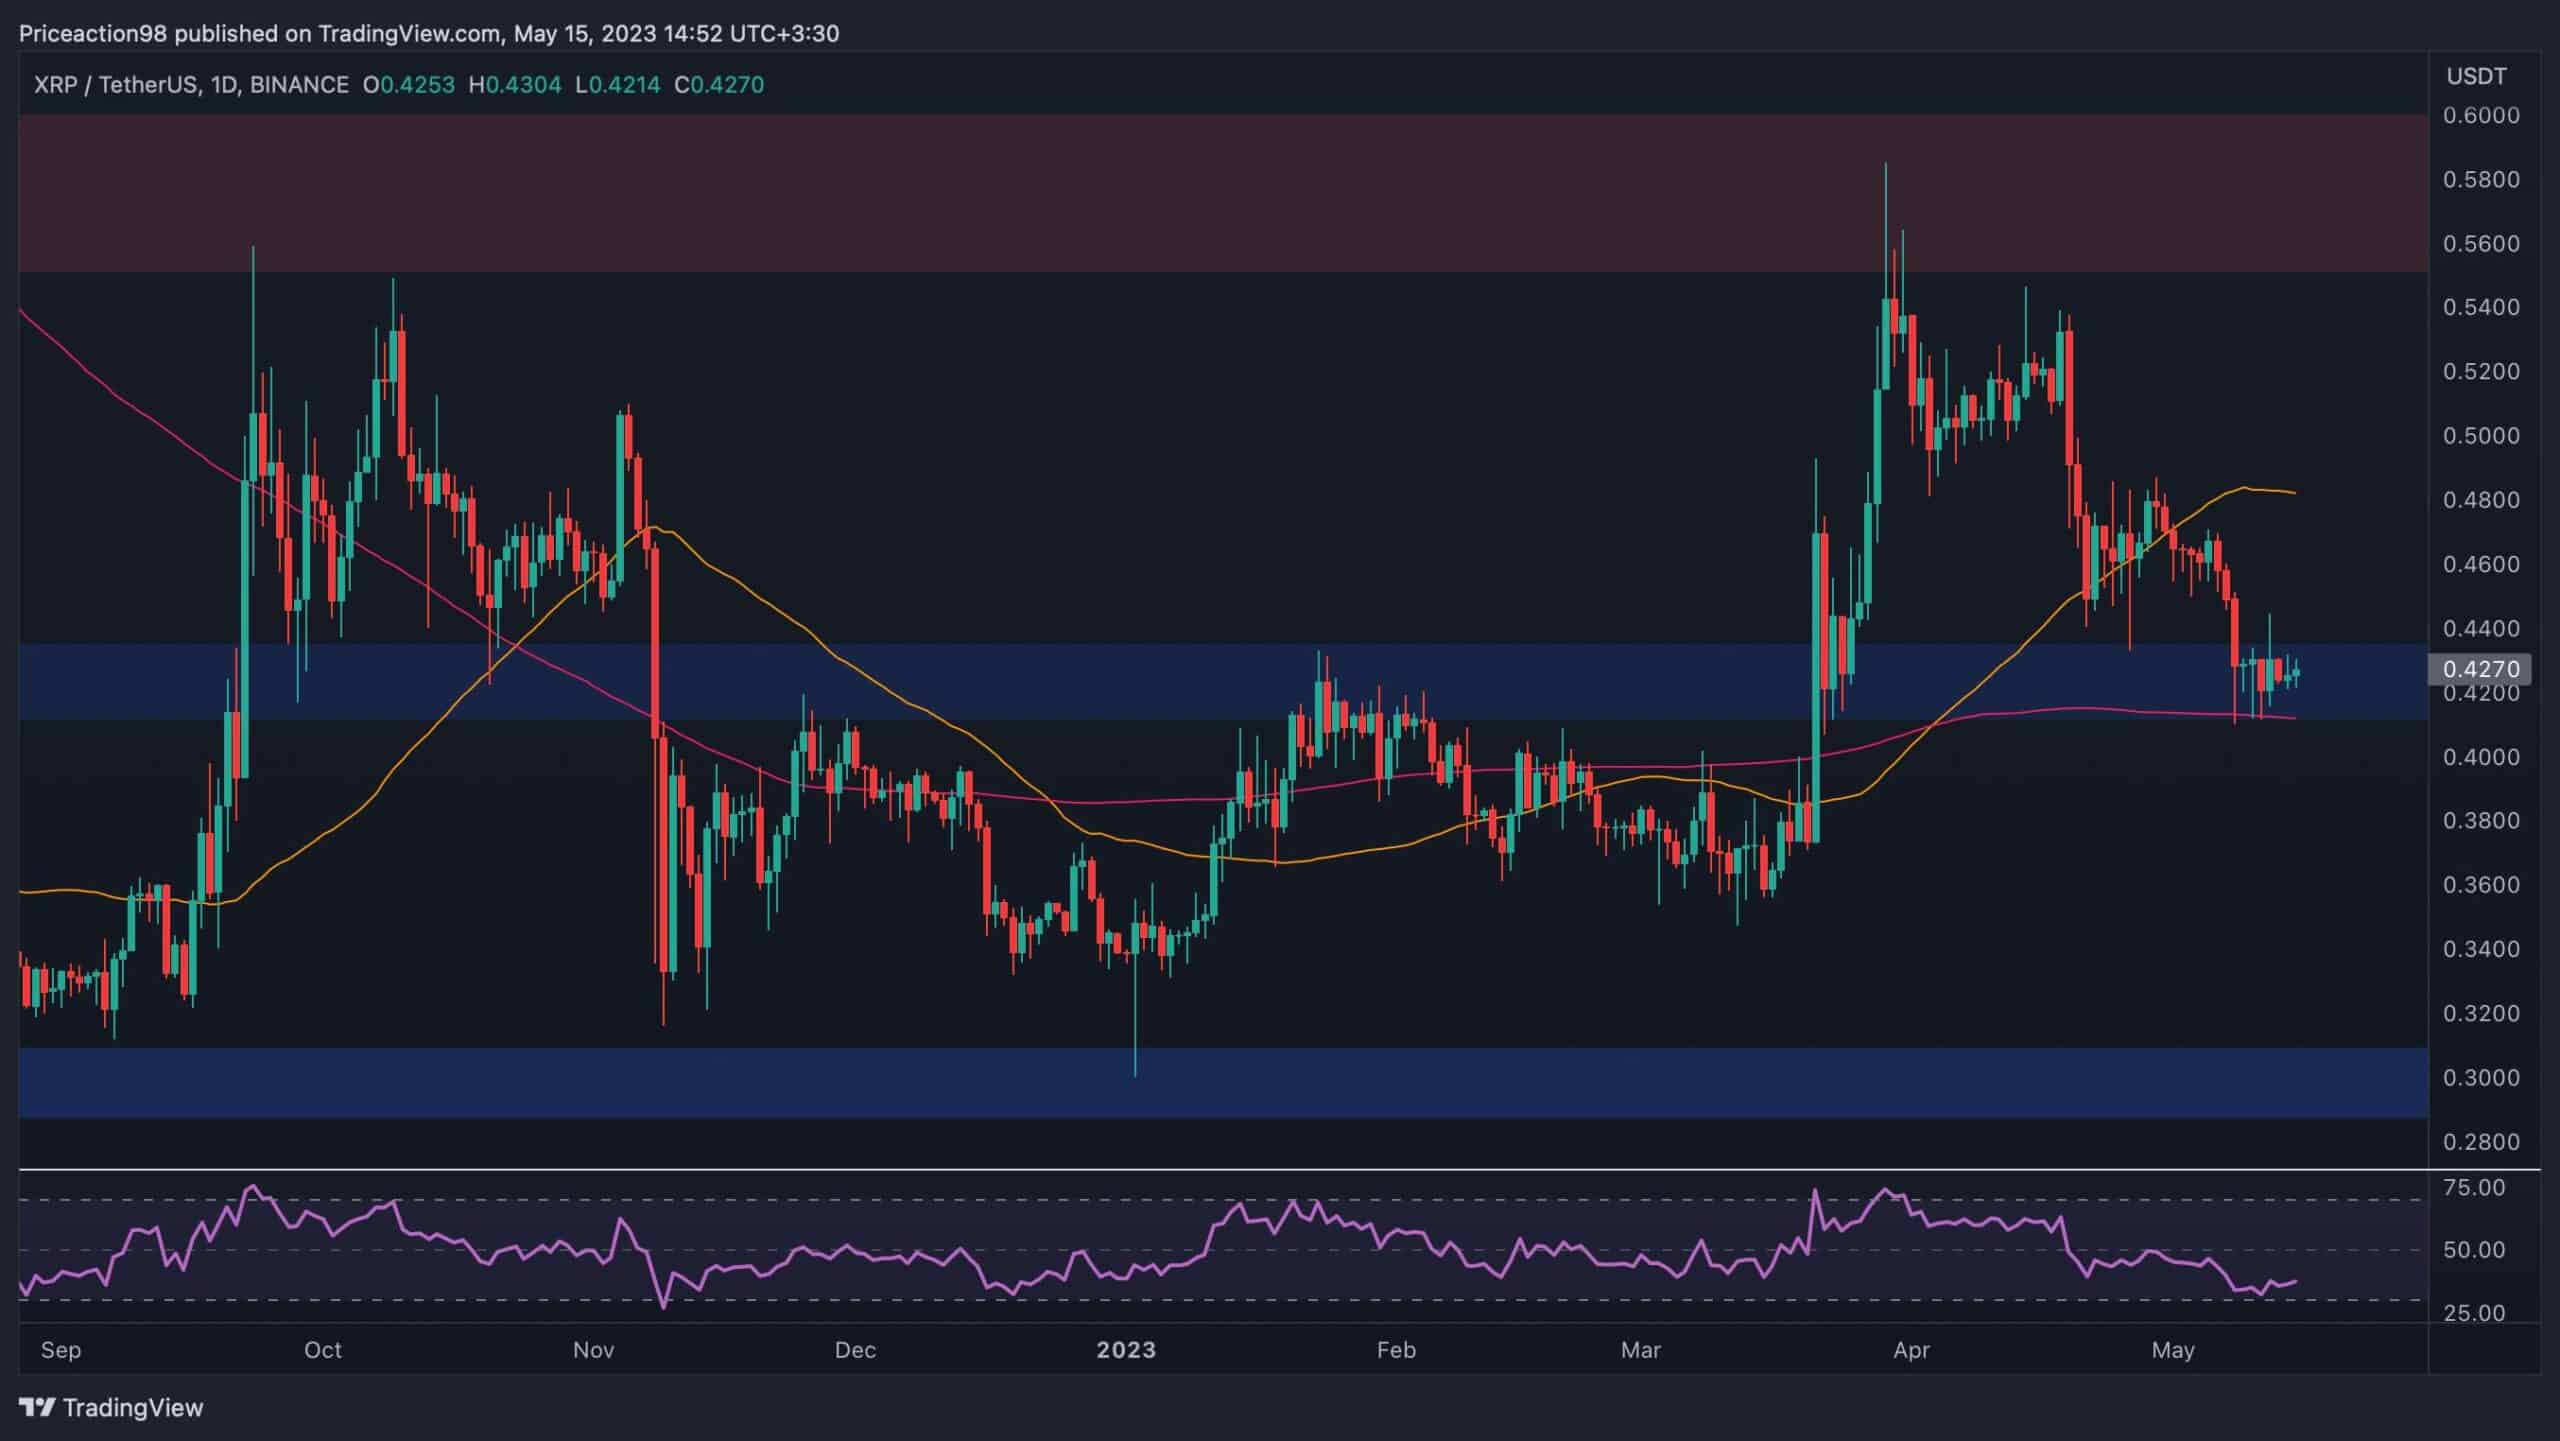
XRP/USDT Daily Chart
The price has been making lower highs and lows recently, following the significant rally in early May. The bearish reversal at the $0.6 area has initiated the current downtrend, but the cryptocurrency is currently testing a key support level around both the $0.42 mark and the 200-day moving average.
A break below these levels would be catastrophic for Ripple, as the market could rapidly plunge toward $0.3, and potentially even lower, in the short term.
On the other hand, if a rebound occurs, the 50-day moving average, located near the $0.48 mark, would be the first likely target in the coming days.
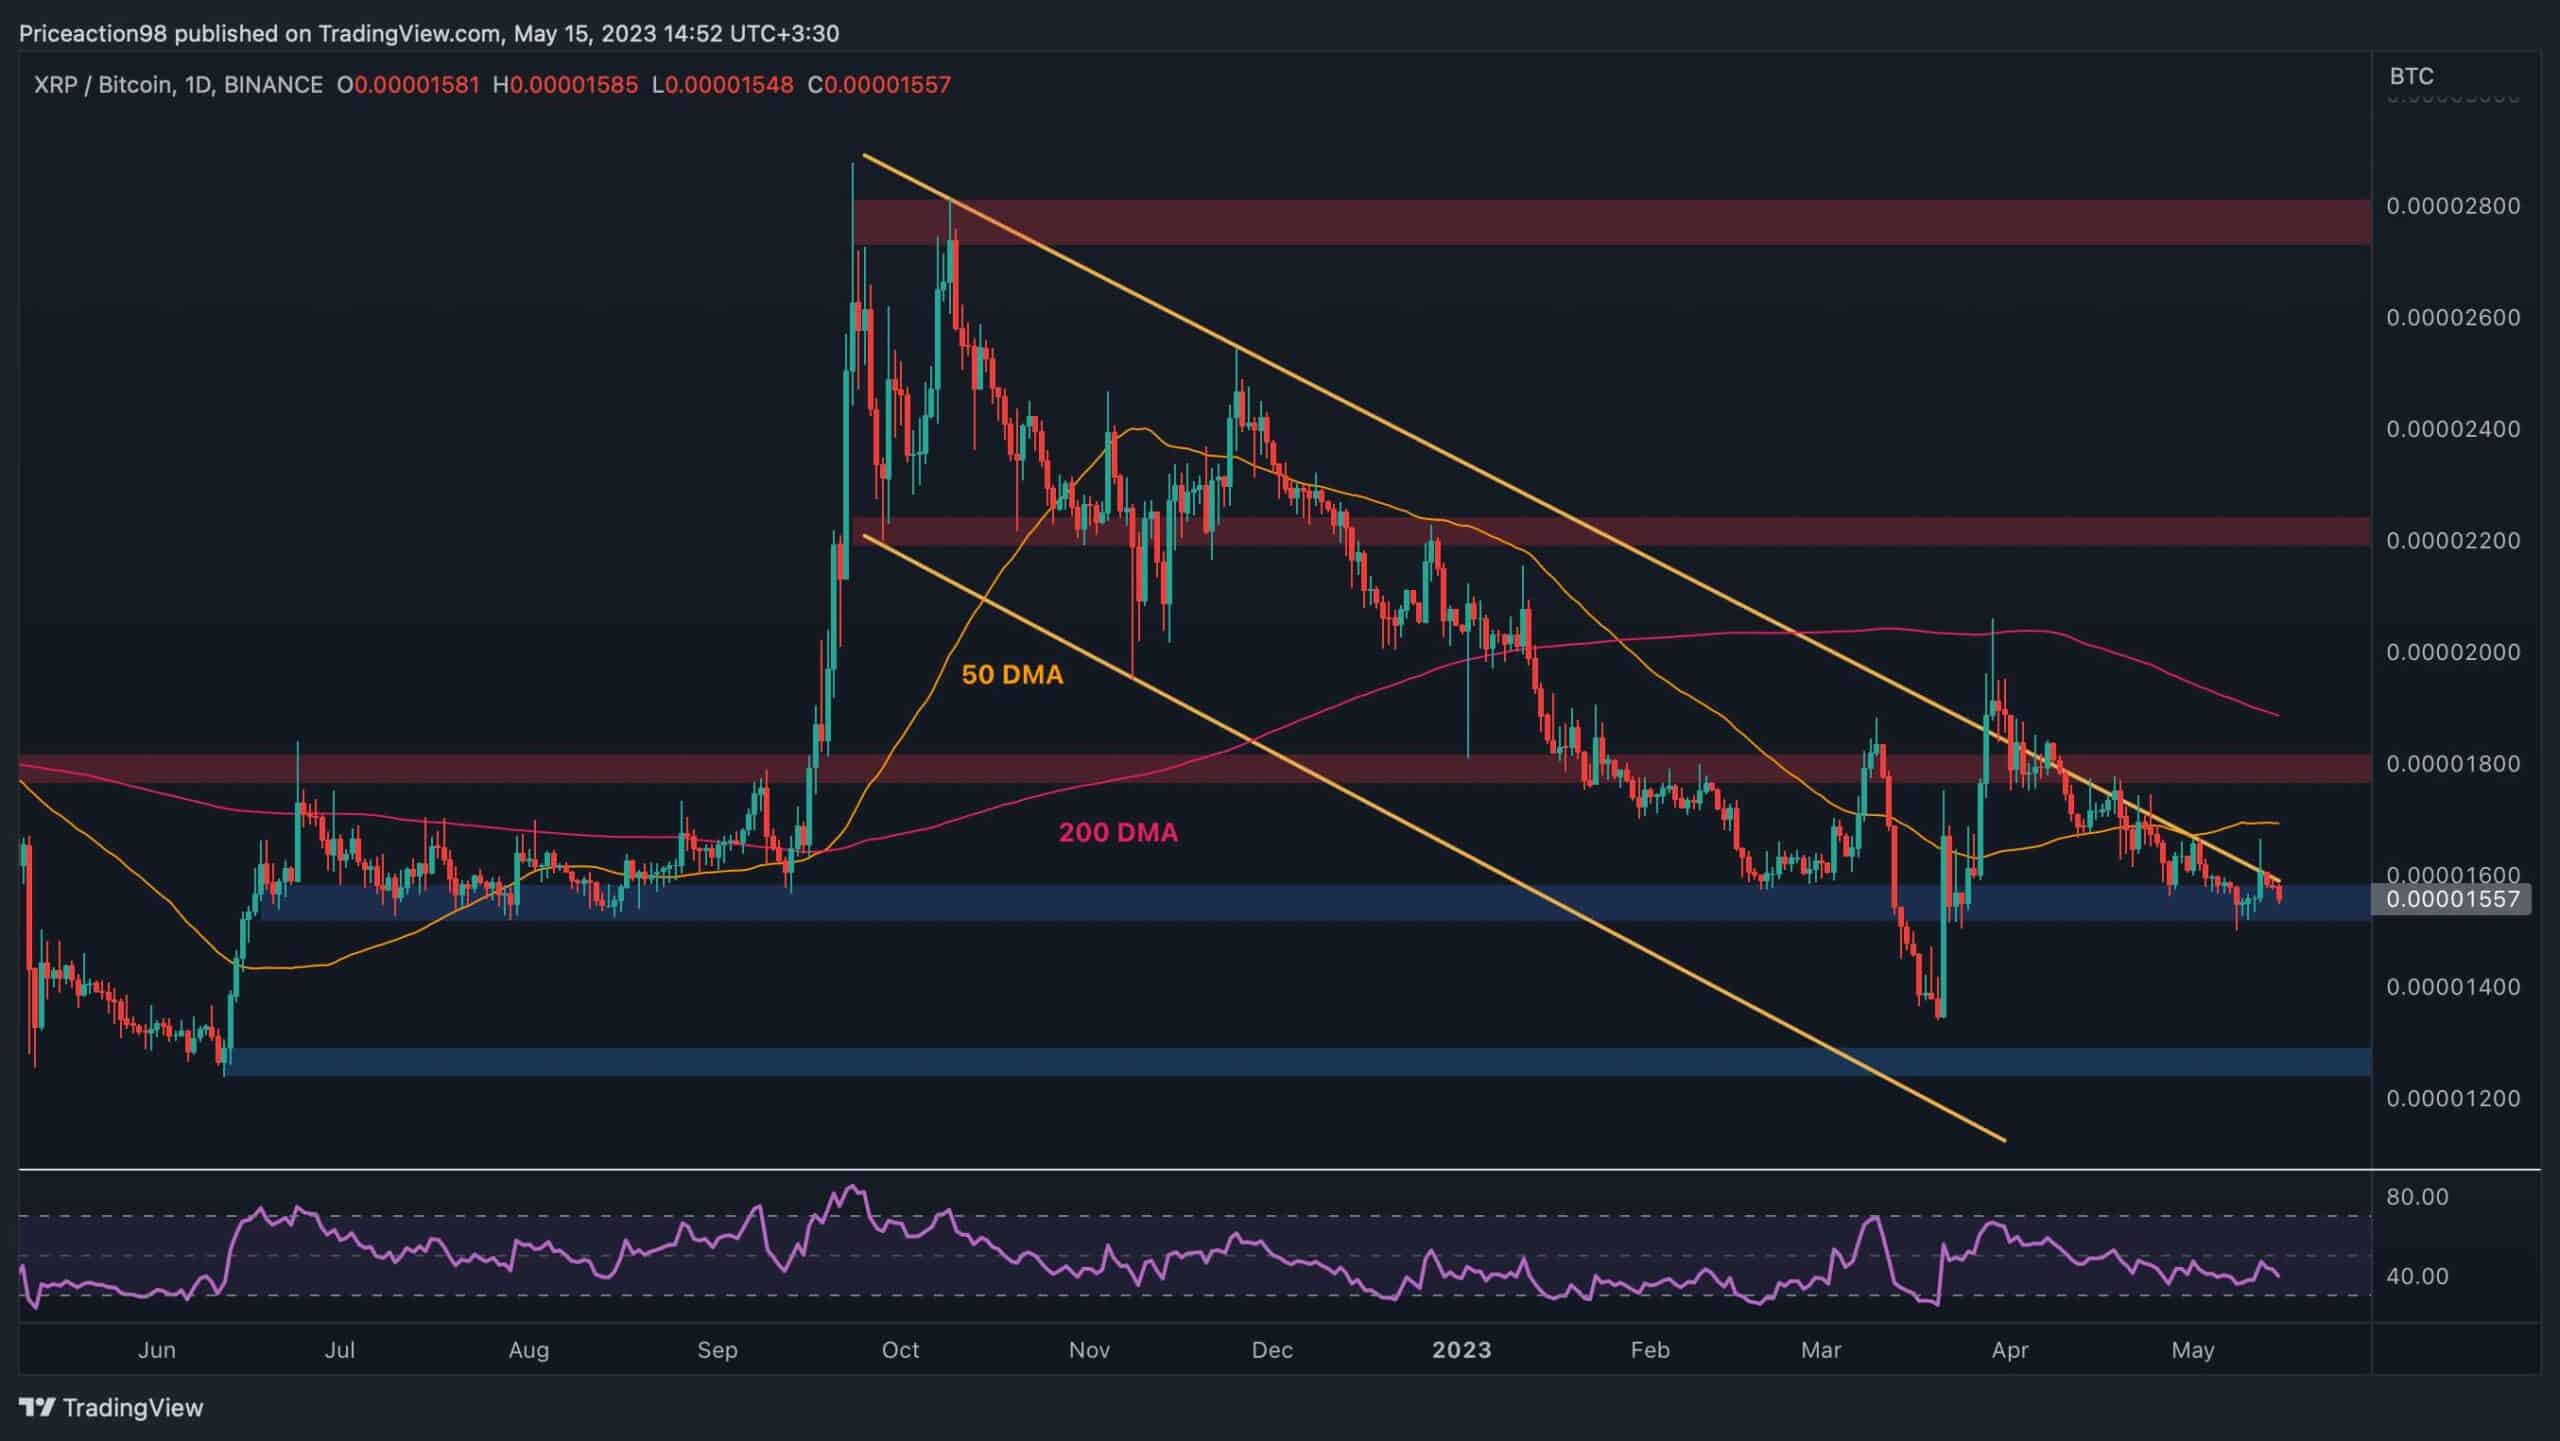
XRP/BTC Daily Chart
Against BTC, the price is still trapped inside a large descending channel after failing to break above it on numerous occasions. The 50-day moving average near the 0.000017 level has also been broken to the downside, and the 0.000015 support is currently being penetrated.
A breakdown of this level would likely result in a deeper decline toward the 0.000013 level. The RSI is also showing values below 50%, as momentum is clearly in favor of the bulls.