Ripple has found strong support within a critical price range, defined by the 100-day and 200-day moving averages, experiencing a significant bullish rebound. However, the asset is anticipated to continue rising toward the key resistance level at %excerpt%.64, where selling pressure may temporarily slow the upward momentum. XRP Analysis By Shayan The Daily Chart An in-depth analysis of Ripple’s daily chart reveals that it encountered substantial buying pressure at a key support zone between the 100-day (%excerpt%.53) and 200-day (%excerpt%.55) moving averages. This surge in demand triggered a notable price recovery from the %excerpt%.53-%excerpt%.55 range, pushing XRP higher. The price is now trending toward the critical resistance level of %excerpt%.64, a zone that has repeatedly challenged Ripple’s buyers in
Topics:
CryptoVizArt considers the following as important: Ripple (XRP) Price, XRP Analysis, xrpbtc, xrpusd
This could be interesting, too:
Jordan Lyanchev writes Ripple’s (XRP) Surge to Triggers Over Million in Short Liquidations
Jordan Lyanchev writes Trump Confirms Work on Strategic Crypto Reserve: XRP, ADA, SOL Included
Dimitar Dzhondzhorov writes Is a Major Ripple v. SEC Lawsuit Development Expected This Week? Here’s Why
Mandy Williams writes Ripple Releases Institutional DeFi Roadmap for XRP Ledger in 2025
Ripple has found strong support within a critical price range, defined by the 100-day and 200-day moving averages, experiencing a significant bullish rebound.
However, the asset is anticipated to continue rising toward the key resistance level at $0.64, where selling pressure may temporarily slow the upward momentum.
XRP Analysis
By Shayan
The Daily Chart
An in-depth analysis of Ripple’s daily chart reveals that it encountered substantial buying pressure at a key support zone between the 100-day ($0.53) and 200-day ($0.55) moving averages. This surge in demand triggered a notable price recovery from the $0.53-$0.55 range, pushing XRP higher. The price is now trending toward the critical resistance level of $0.64, a zone that has repeatedly challenged Ripple’s buyers in recent months.
If sellers reassert control at this level, the asset could reverse and decline back to the $0.55 support area. On the other hand, if buyers manage to break through this resistance, a bullish continuation and a shift in market sentiment are likely.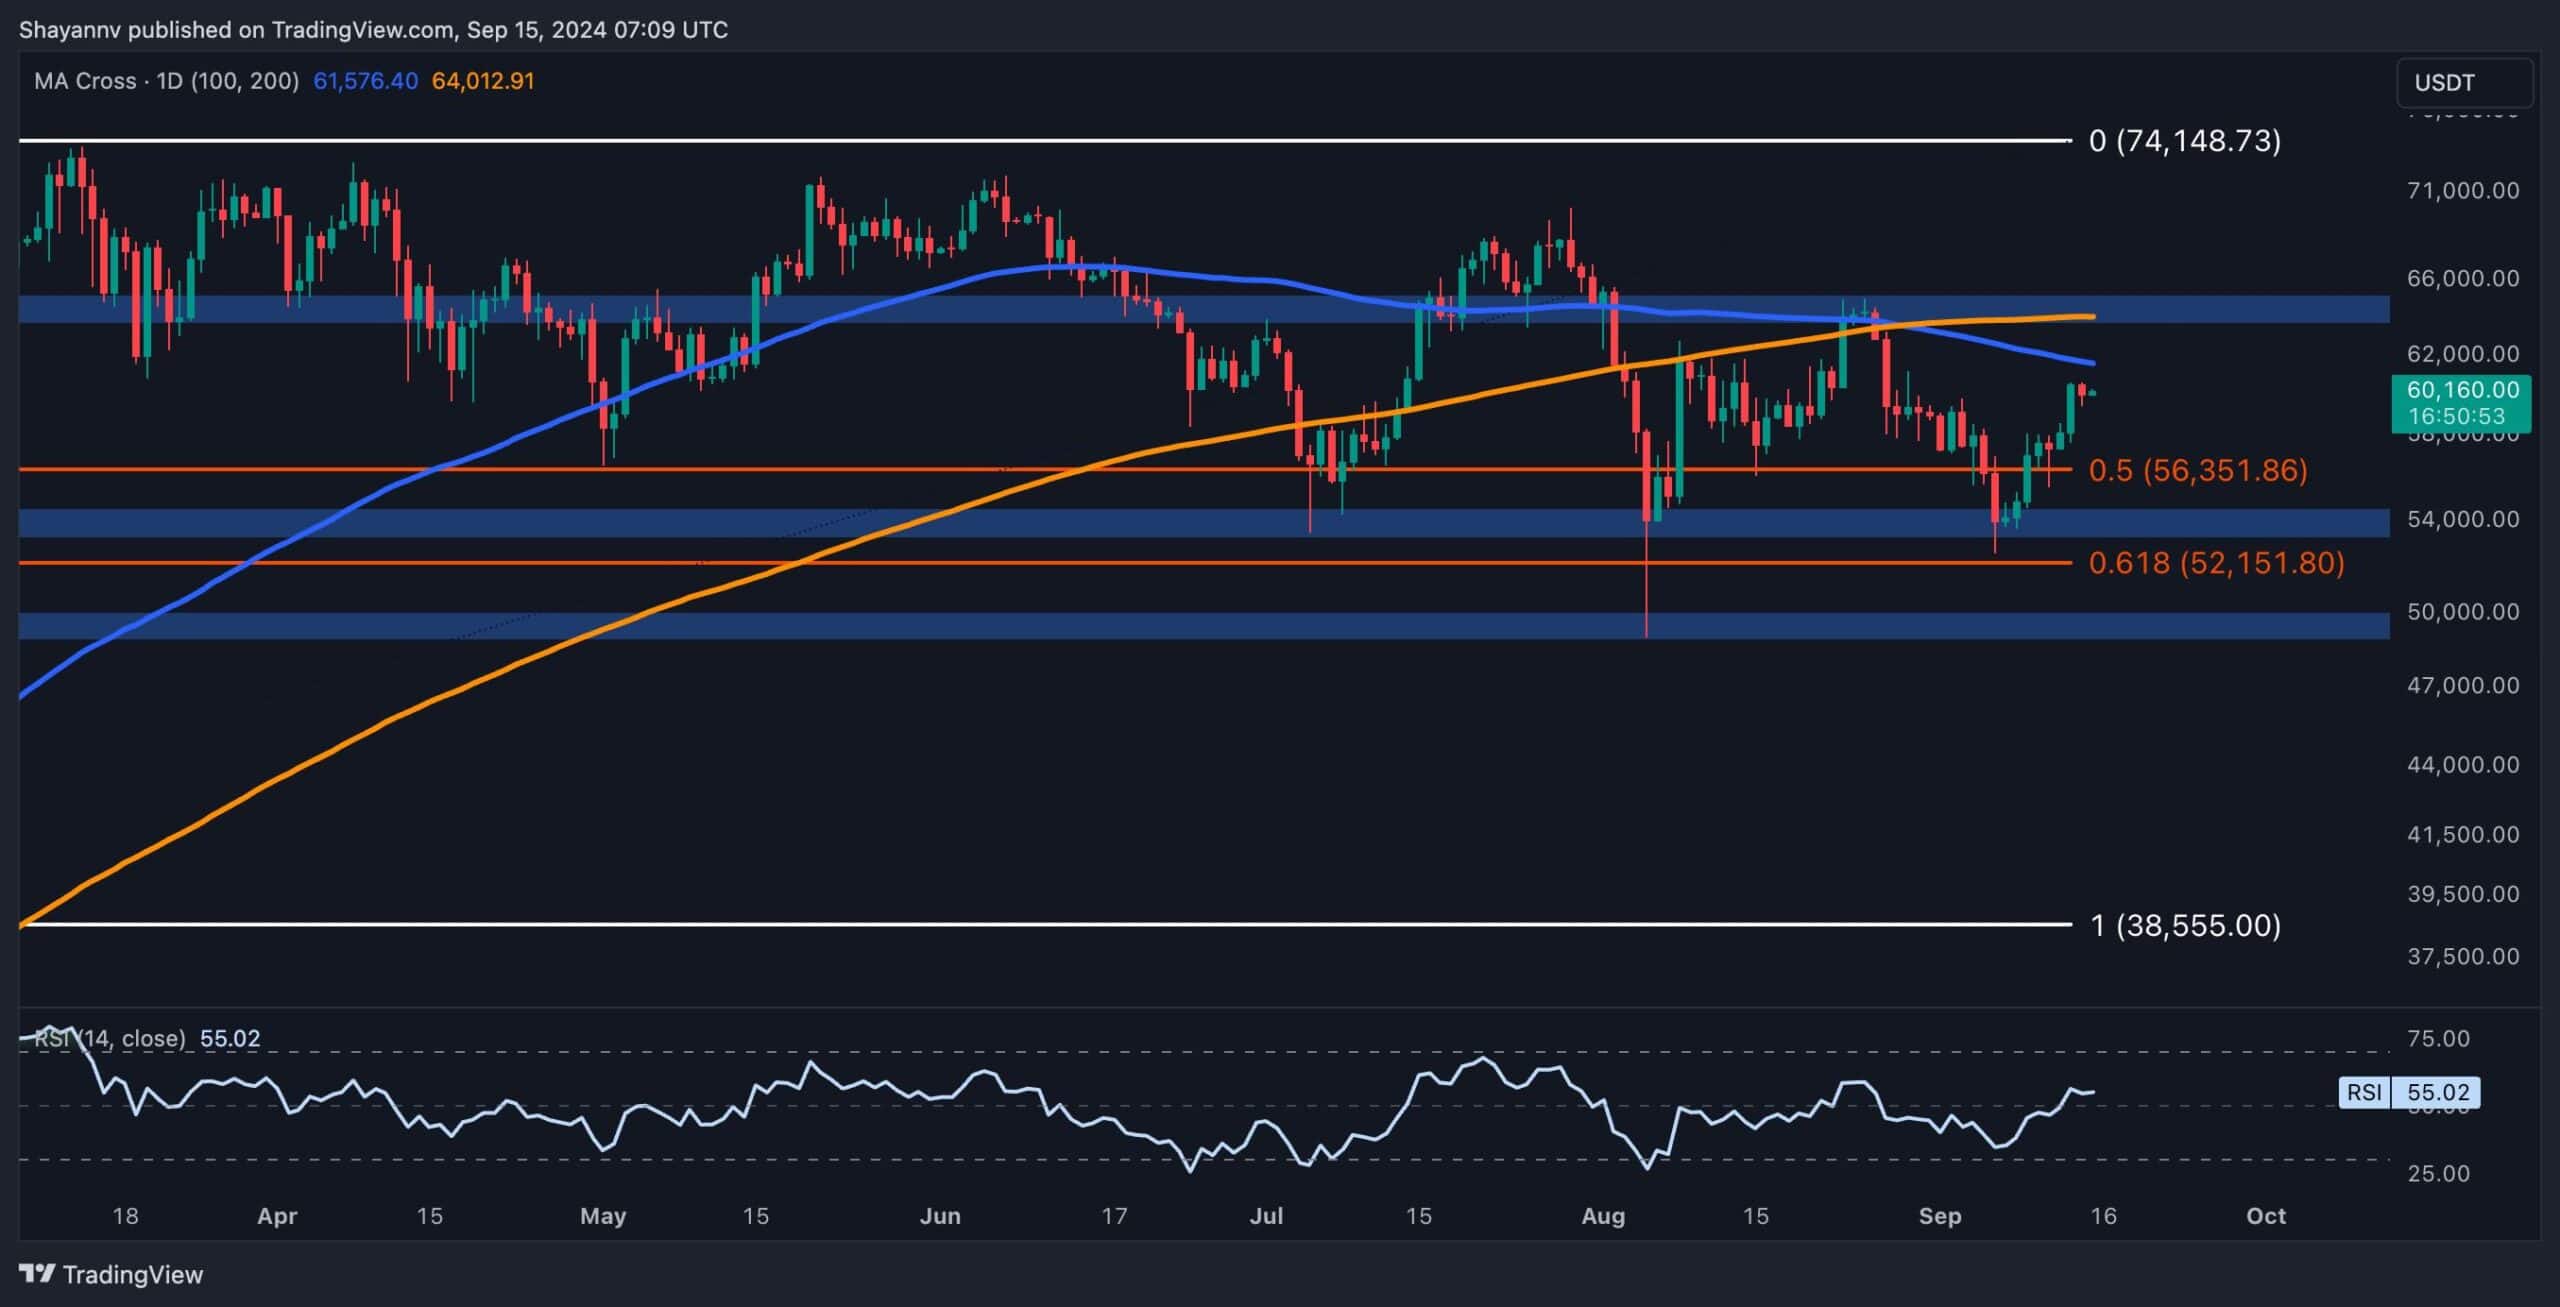
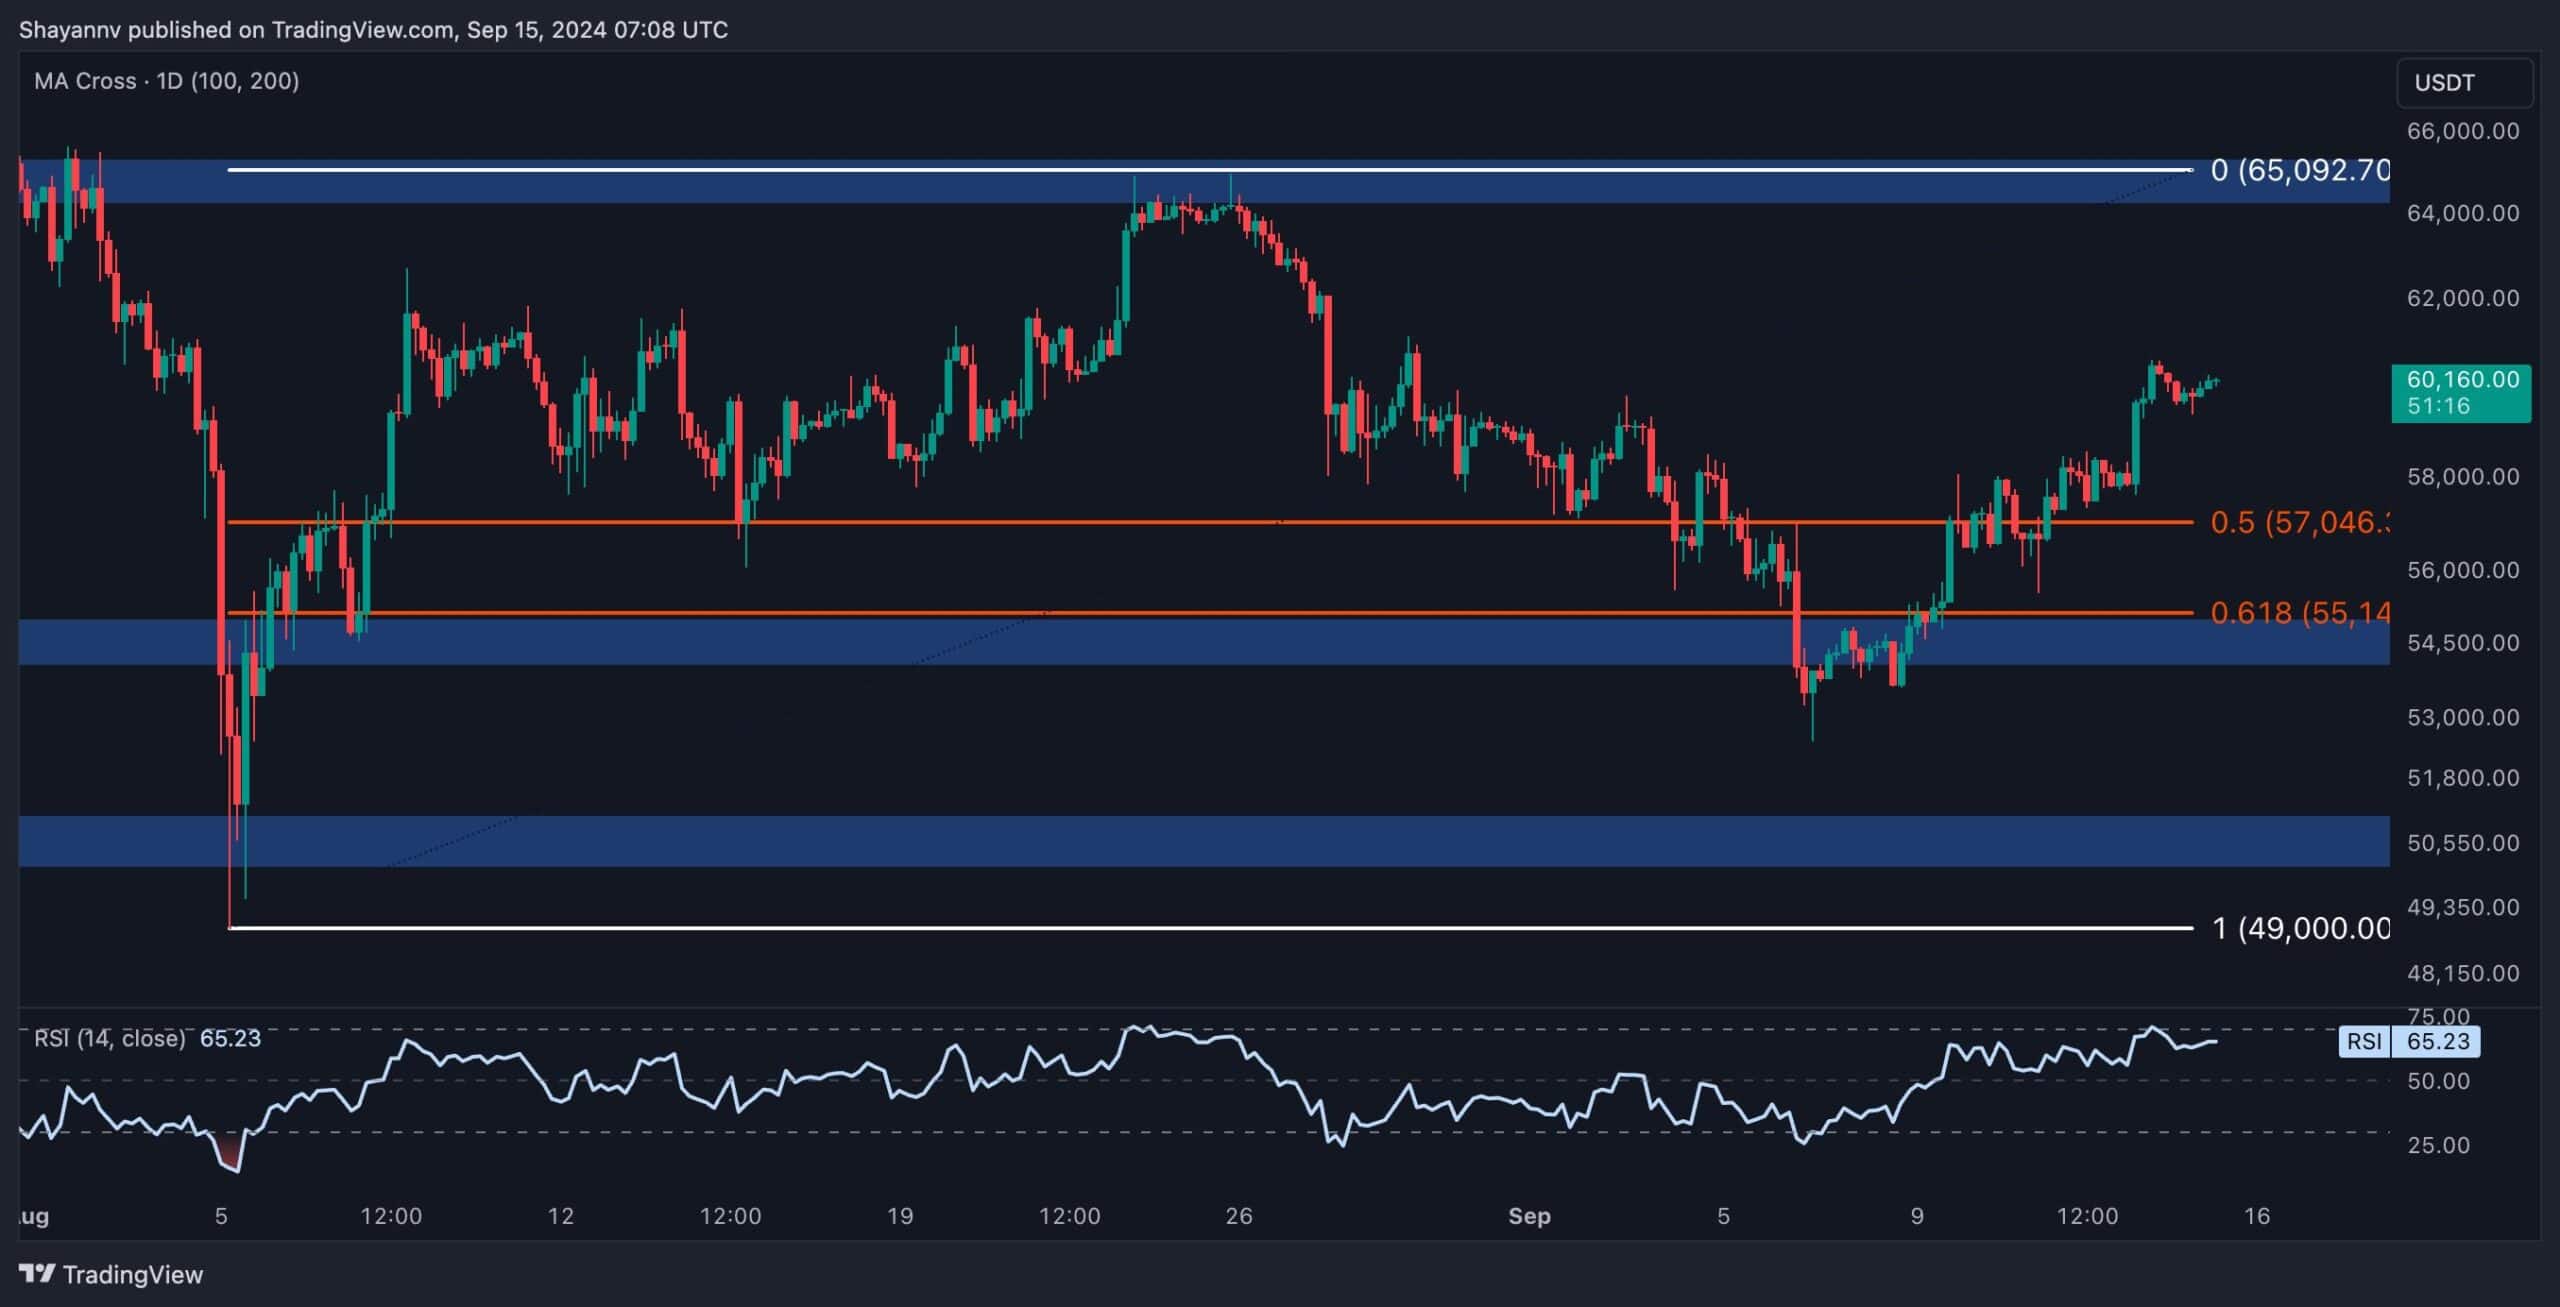
The 4-Hour Chart
On the 4-hour chart, Ripple found strong support within the 0.5 ($0.52) and 0.618 ($0.48) Fibonacci retracement levels, as well as the lower boundary of the descending flag pattern. This demand zone halted the previous bearish trend and triggered a strong bullish reversal.
Ripple is now climbing toward the upper boundary of the flag at $0.62, a key level in this pattern. The descending flag pattern is a well-known bullish continuation movement if it is breached from its upper boundary.
If the price breaks above $0.62, further bullish momentum is likely. Conversely, failure to overcome this resistance could result in a bearish pullback, with the price potentially falling back toward the flag’s lower trendline around the crucial $0.53 support.