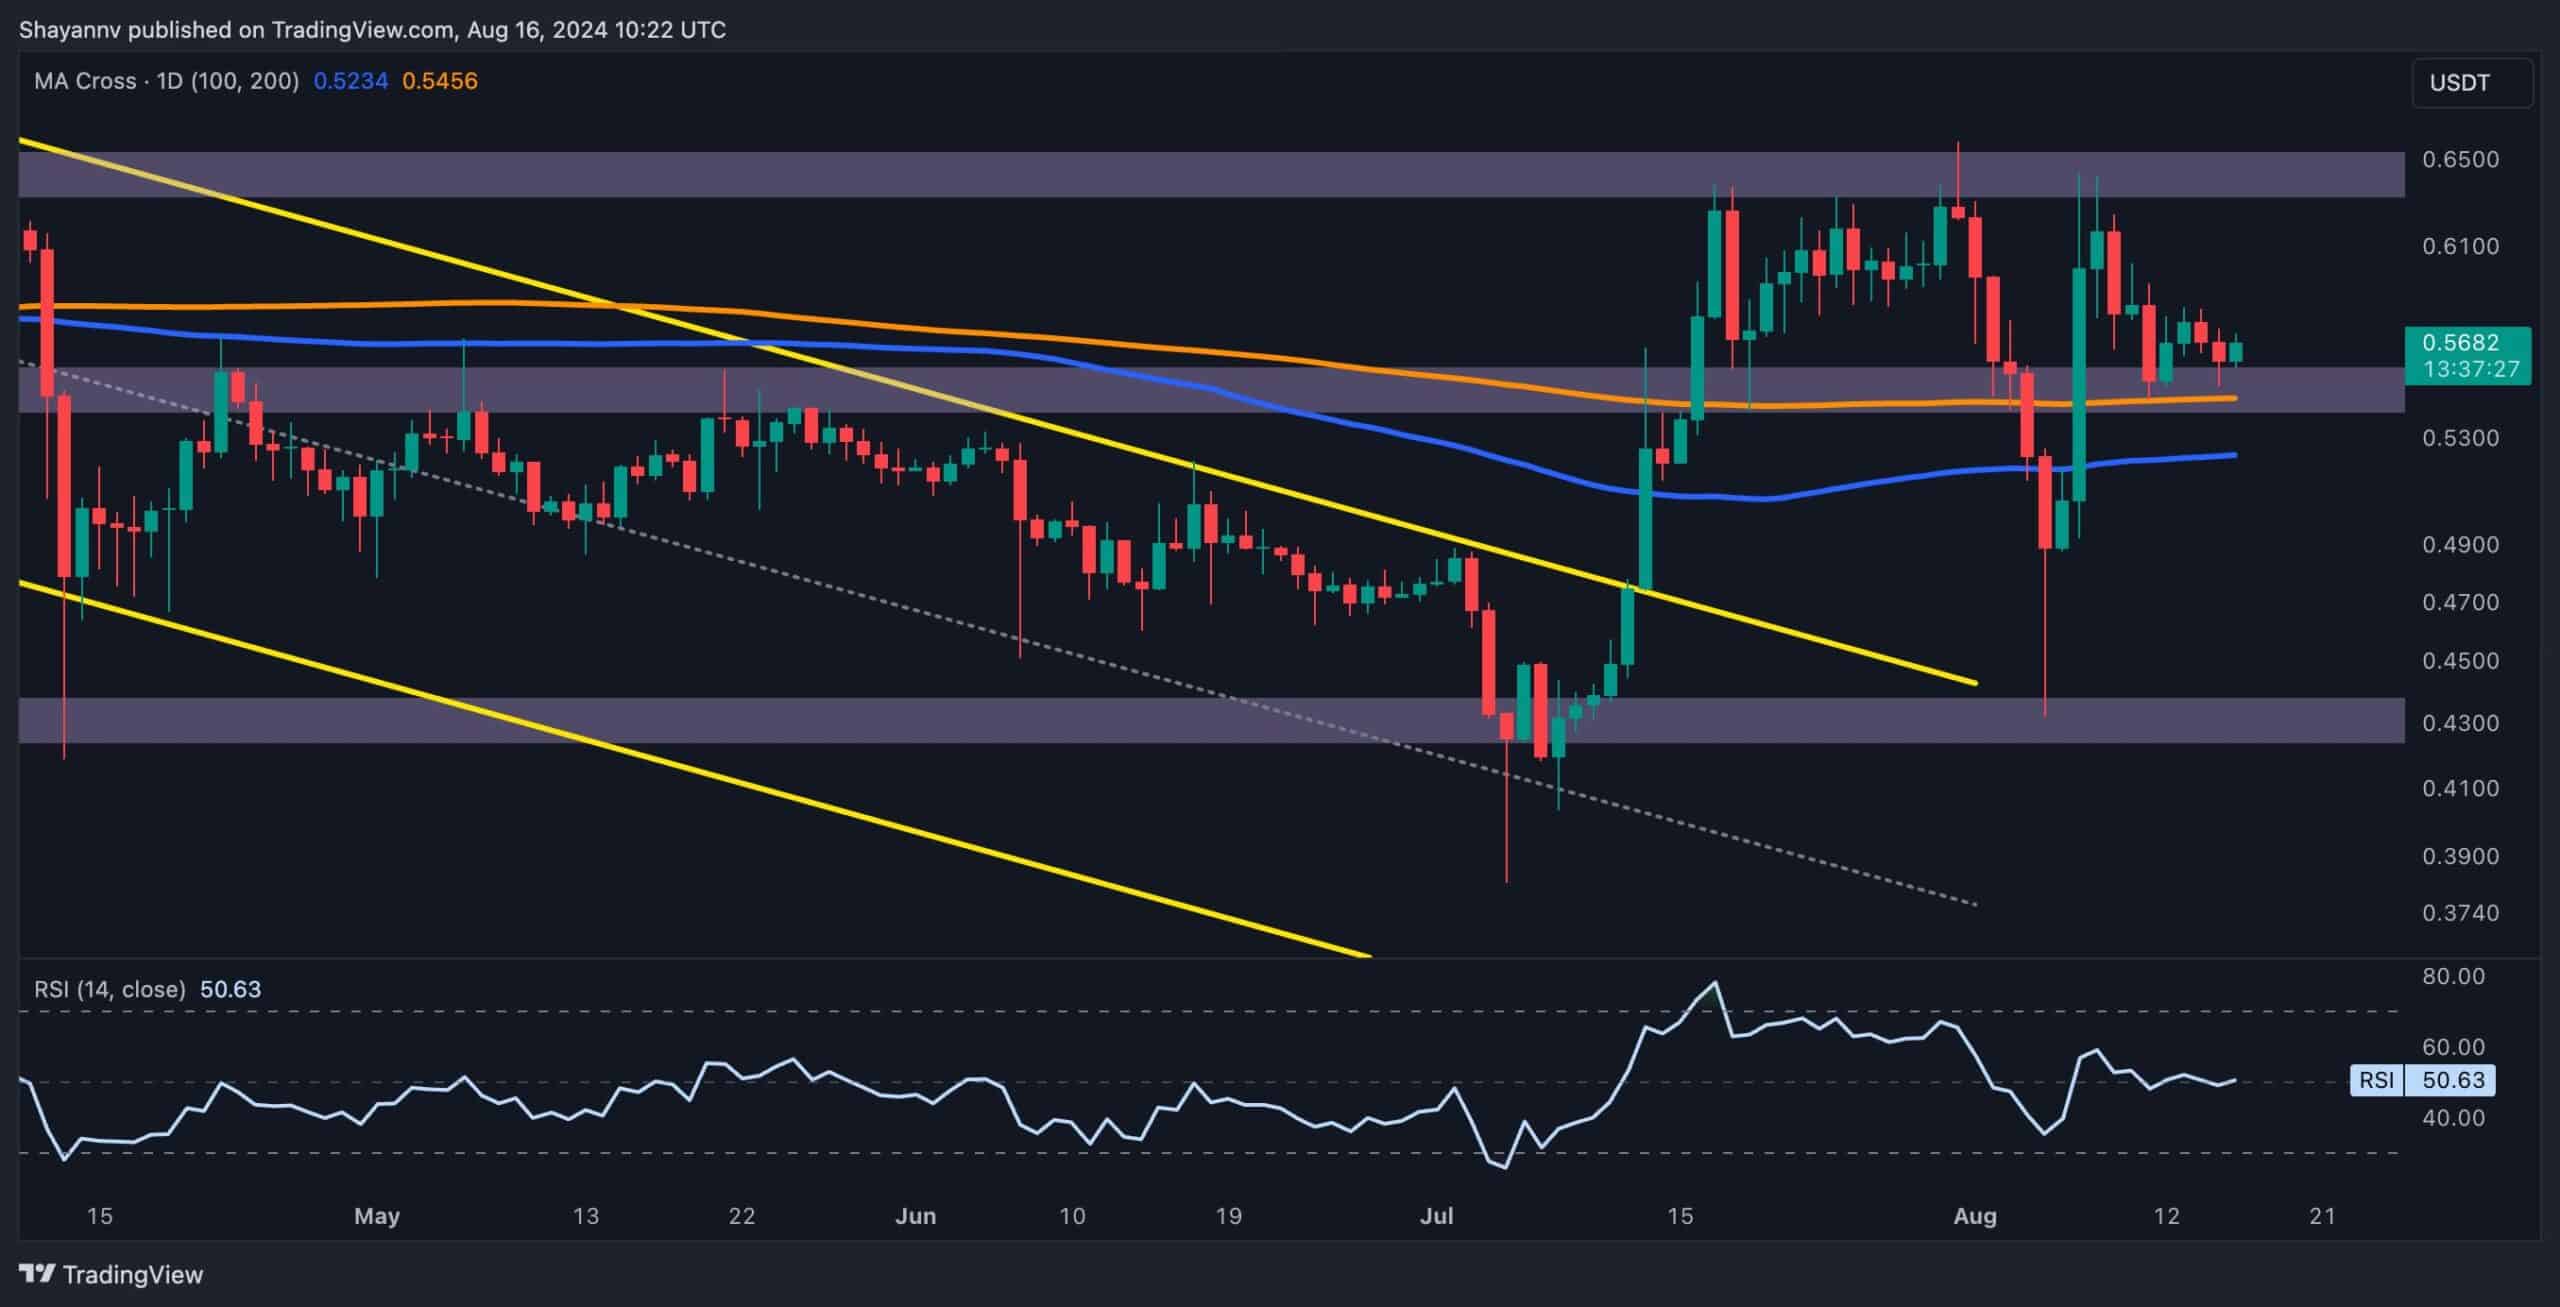
XRP’s price has seen minimal volatility near the significant support region of the 200-day moving average at %excerpt%.54. Given the potential demand at this crucial juncture, a period of sideways consolidation is expected, with Ripple likely moving toward the %excerpt%.64 resistance region in the short term. By Shayan The Daily Chart Ripple’s price is showing minimal volatility near the crucial support level of the 200-day moving average at %excerpt%.54. After a slight rejection from the significant %excerpt%.63 resistance zone, it retraced toward the support of around %excerpt%.55. This aligns with the 200-day moving average, offering a strong foundation for the price. Currently, the cryptocurrency seems to be consolidating with little indication of its next direction. The price remains confined within a
Topics:
CryptoVizArt considers the following as important: Ripple (XRP) Price, XRP Analysis, xrpbtc, xrpusd
This could be interesting, too:
Jordan Lyanchev writes Ripple’s (XRP) Surge to Triggers Over Million in Short Liquidations
Jordan Lyanchev writes Trump Confirms Work on Strategic Crypto Reserve: XRP, ADA, SOL Included
Dimitar Dzhondzhorov writes Is a Major Ripple v. SEC Lawsuit Development Expected This Week? Here’s Why
Mandy Williams writes Ripple Releases Institutional DeFi Roadmap for XRP Ledger in 2025
XRP’s price has seen minimal volatility near the significant support region of the 200-day moving average at $0.54.
Given the potential demand at this crucial juncture, a period of sideways consolidation is expected, with Ripple likely moving toward the $0.64 resistance region in the short term.
By Shayan
The Daily Chart
Ripple’s price is showing minimal volatility near the crucial support level of the 200-day moving average at $0.54. After a slight rejection from the significant $0.63 resistance zone, it retraced toward the support of around $0.55. This aligns with the 200-day moving average, offering a strong foundation for the price.
Currently, the cryptocurrency seems to be consolidating with little indication of its next direction. The price remains confined within a decisive range, bound by the $0.63 resistance and $0.55 support levels.
Given the current conditions, a period of sideways consolidation within this range is expected in the short term. The eventual breakout in either direction will likely dictate Ripple’s next significant move.
The 4-Hour Chart
The 4-hour chart further highlights Ripple’s recent retracement phase, showing a bearish corrective movement characterized by weak momentum.
The price has now settled on a crucial support region around the $0.55 level, which has historically provided stability. XRP is also within a descending flag pattern, suggesting the potential for a continuation of the bullish trend if the price breaks above the pattern’s upper boundary.
Currently, a tug-of-war between buyers and sellers is unfolding near the $0.55 mark. The price action indicates a possible resurgence in buying pressure in the coming days, potentially leading to a rally targeting the key $0.64 resistance level.
However, if the price unexpectedly breaks below this support, the next target would likely be within the 0.5-0.618 Fibonacci retracement range.
