After a solid bullish rebound, Ripple’s price surged to the %excerpt%.60 level. However, it has since entered a brief consolidation phase, which may pave the way for further upward movement toward the significant %excerpt%.64 resistance. By Shayan The Daily Chart A closer look at Ripple’s daily chart reveals that following an increase in demand around the key 100-day (%excerpt%.53) and 200-day (%excerpt%.55) moving averages, buying activity intensified, leading to a sharp price surge toward the %excerpt%.60 mark. Although Ripple’s upward momentum has temporarily paused, the price has now entered a short-term consolidation at this level. This phase is likely to be followed by a continuation of the bullish trend, with XRP targeting the critical %excerpt%.64 resistance level, a zone that has consistently challenged
Topics:
CryptoVizArt considers the following as important: Ripple (XRP) Price, XRP Analysis, xrpbtc, xrpusd
This could be interesting, too:
Jordan Lyanchev writes Ripple’s (XRP) Surge to Triggers Over Million in Short Liquidations
Jordan Lyanchev writes Trump Confirms Work on Strategic Crypto Reserve: XRP, ADA, SOL Included
Dimitar Dzhondzhorov writes Is a Major Ripple v. SEC Lawsuit Development Expected This Week? Here’s Why
Mandy Williams writes Ripple Releases Institutional DeFi Roadmap for XRP Ledger in 2025
After a solid bullish rebound, Ripple’s price surged to the $0.60 level. However, it has since entered a brief consolidation phase, which may pave the way for further upward movement toward the significant $0.64 resistance.
By Shayan
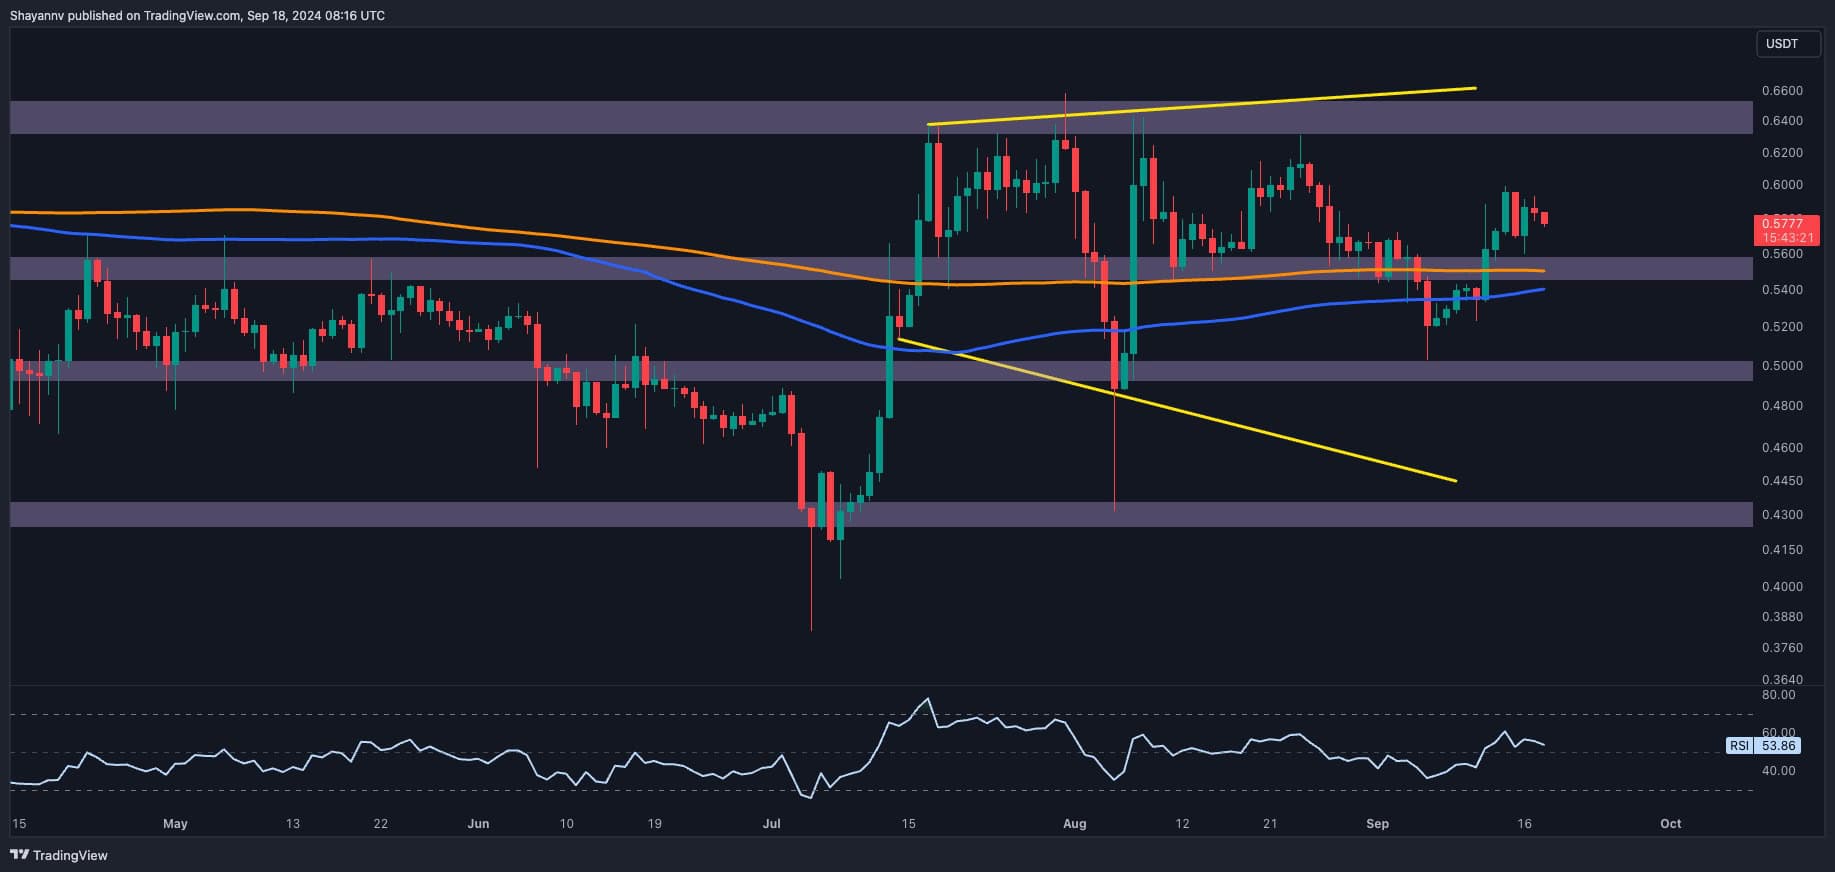
The Daily Chart
A closer look at Ripple’s daily chart reveals that following an increase in demand around the key 100-day ($0.53) and 200-day ($0.55) moving averages, buying activity intensified, leading to a sharp price surge toward the $0.60 mark.
Although Ripple’s upward momentum has temporarily paused, the price has now entered a short-term consolidation at this level. This phase is likely to be followed by a continuation of the bullish trend, with XRP targeting the critical $0.64 resistance level, a zone that has consistently challenged buyers in recent months.
Should sellers regain control of this resistance, XRP’s price could face a reversal, potentially declining back toward the $0.55 support region. On the other hand, if buyers manage to break through the $0.64 resistance, the bullish trend is expected to continue, signaling a shift in market sentiment.
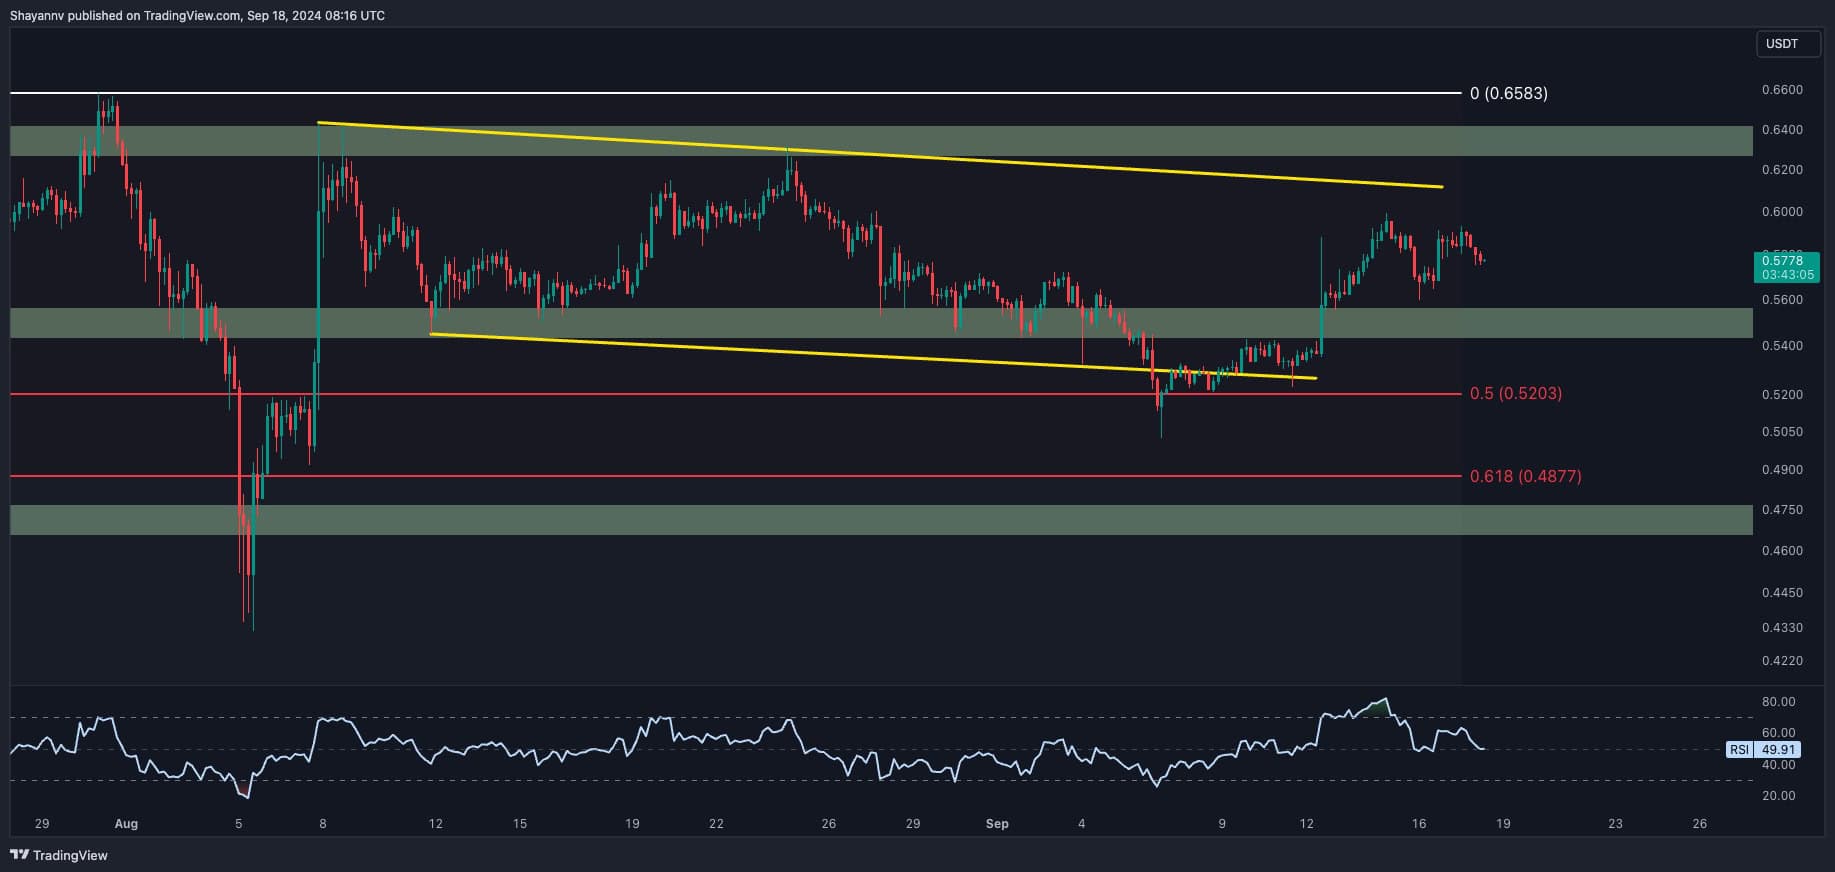
The 4-Hour Chart
On the 4-hour chart, XRP saw increased buying interest at the 0.5 Fibonacci retracement level ($0.52), which coincides with the lower boundary of a descending flag pattern. This triggered a strong bullish reversal, pushing the price toward the upper boundary of the flag at $0.62, a key resistance level in this formation.
If the cryptocurrency successfully breaks above $0.62, the bullish trend is likely to continue, with the price targeting the $0.64 threshold. However, failure to break through this resistance could lead to a bearish rejection, with the price potentially retracing back to the $0.55 static support area.