After a notable surge, Ripple’s price has successfully broken above the upper trendline of a multi-month triangle pattern, indicating a bullish signal. However, the recent retracement suggests a potential pullback to the broken level. By Shayan The Daily Chart A detailed analysis of the daily chart highlights Ripple’s surge as it surpassed a crucial resistance area represented by the dynamic upper boundary of the triangle pattern, reaching a significant resistance level at %excerpt%.74. This breakout underscores the presence of buyers in the market. However, the price encountered a notable rejection near the %excerpt%.74 resistance, leading to a consolidation correction stage toward the triangle’s broken threshold. Many participants view this retracement as a temporary pullback to the
Topics:
CryptoVizArt considers the following as important: Ripple (XRP) Price, XRP Analysis, xrpbtc, xrpusd
This could be interesting, too:
Jordan Lyanchev writes Ripple’s (XRP) Surge to Triggers Over Million in Short Liquidations
Jordan Lyanchev writes Trump Confirms Work on Strategic Crypto Reserve: XRP, ADA, SOL Included
Dimitar Dzhondzhorov writes Is a Major Ripple v. SEC Lawsuit Development Expected This Week? Here’s Why
Mandy Williams writes Ripple Releases Institutional DeFi Roadmap for XRP Ledger in 2025
After a notable surge, Ripple’s price has successfully broken above the upper trendline of a multi-month triangle pattern, indicating a bullish signal. However, the recent retracement suggests a potential pullback to the broken level.
By Shayan
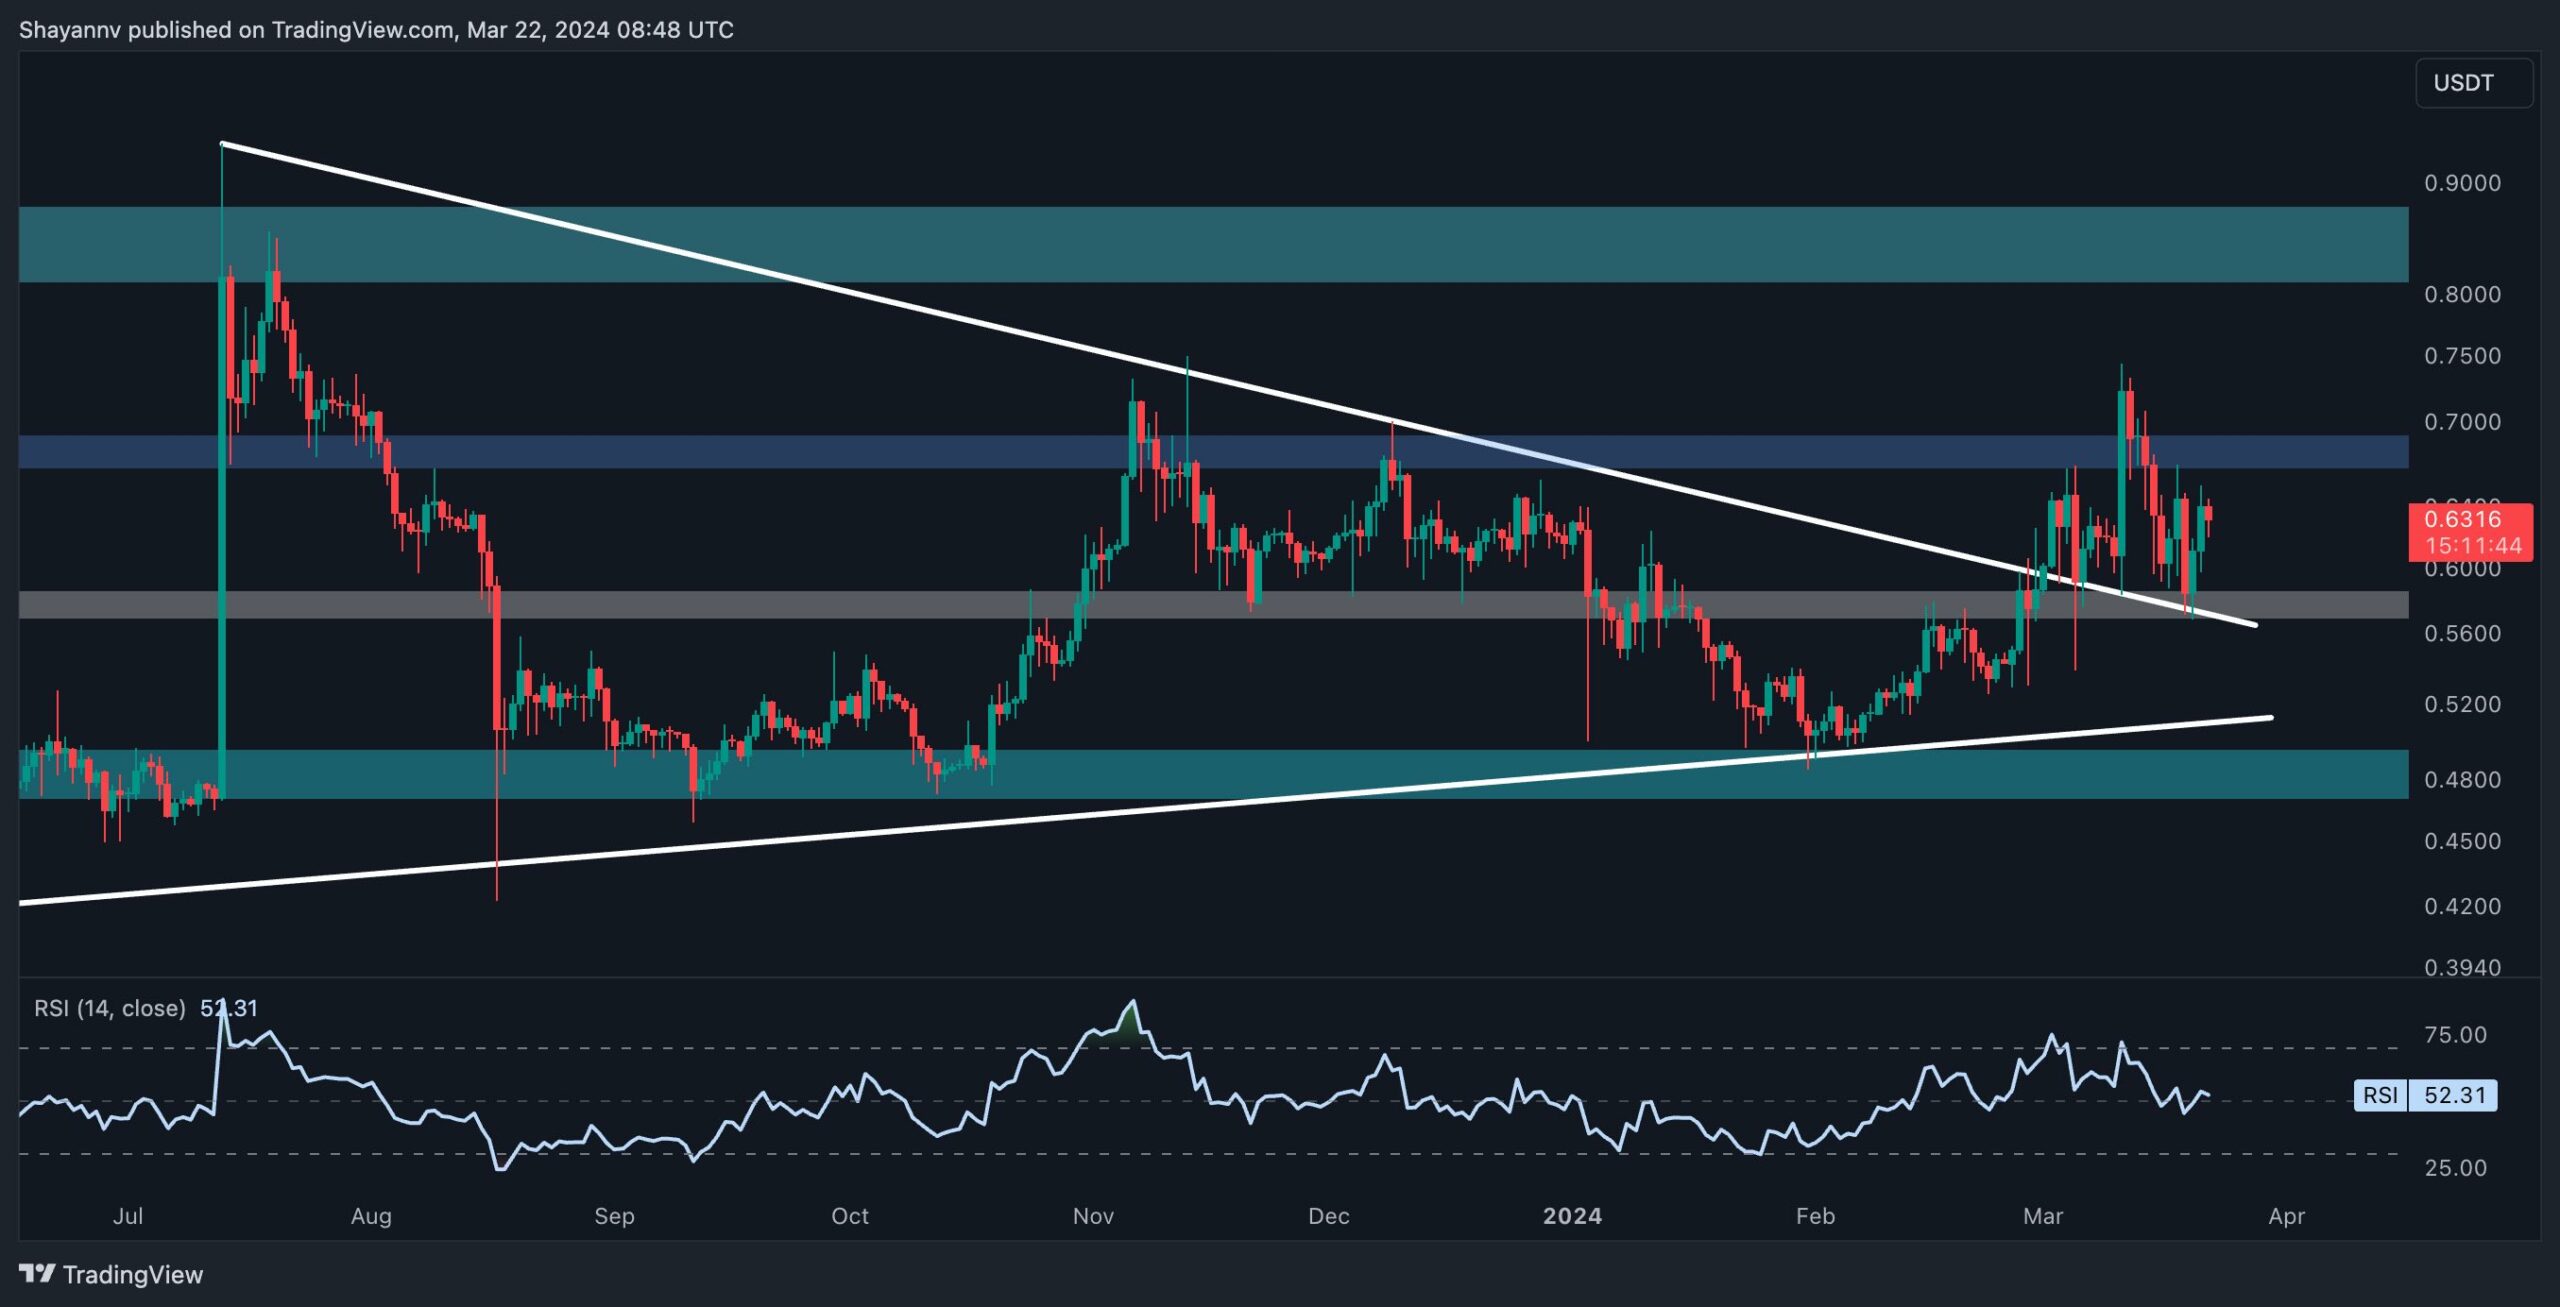
The Daily Chart
A detailed analysis of the daily chart highlights Ripple’s surge as it surpassed a crucial resistance area represented by the dynamic upper boundary of the triangle pattern, reaching a significant resistance level at $0.74. This breakout underscores the presence of buyers in the market.
However, the price encountered a notable rejection near the $0.74 resistance, leading to a consolidation correction stage toward the triangle’s broken threshold. Many participants view this retracement as a temporary pullback to the triangle’s upper boundary. Should the price complete this pullback, Ripple is expected to initiate a fresh rally, targeting a new yearly high above $0.74.
Nevertheless, Ripple’s price appears to be confined within a critical range, delineated by the $0.74 crucial resistance and the $0.56 significant support region in the mid term until a breakout occurs.
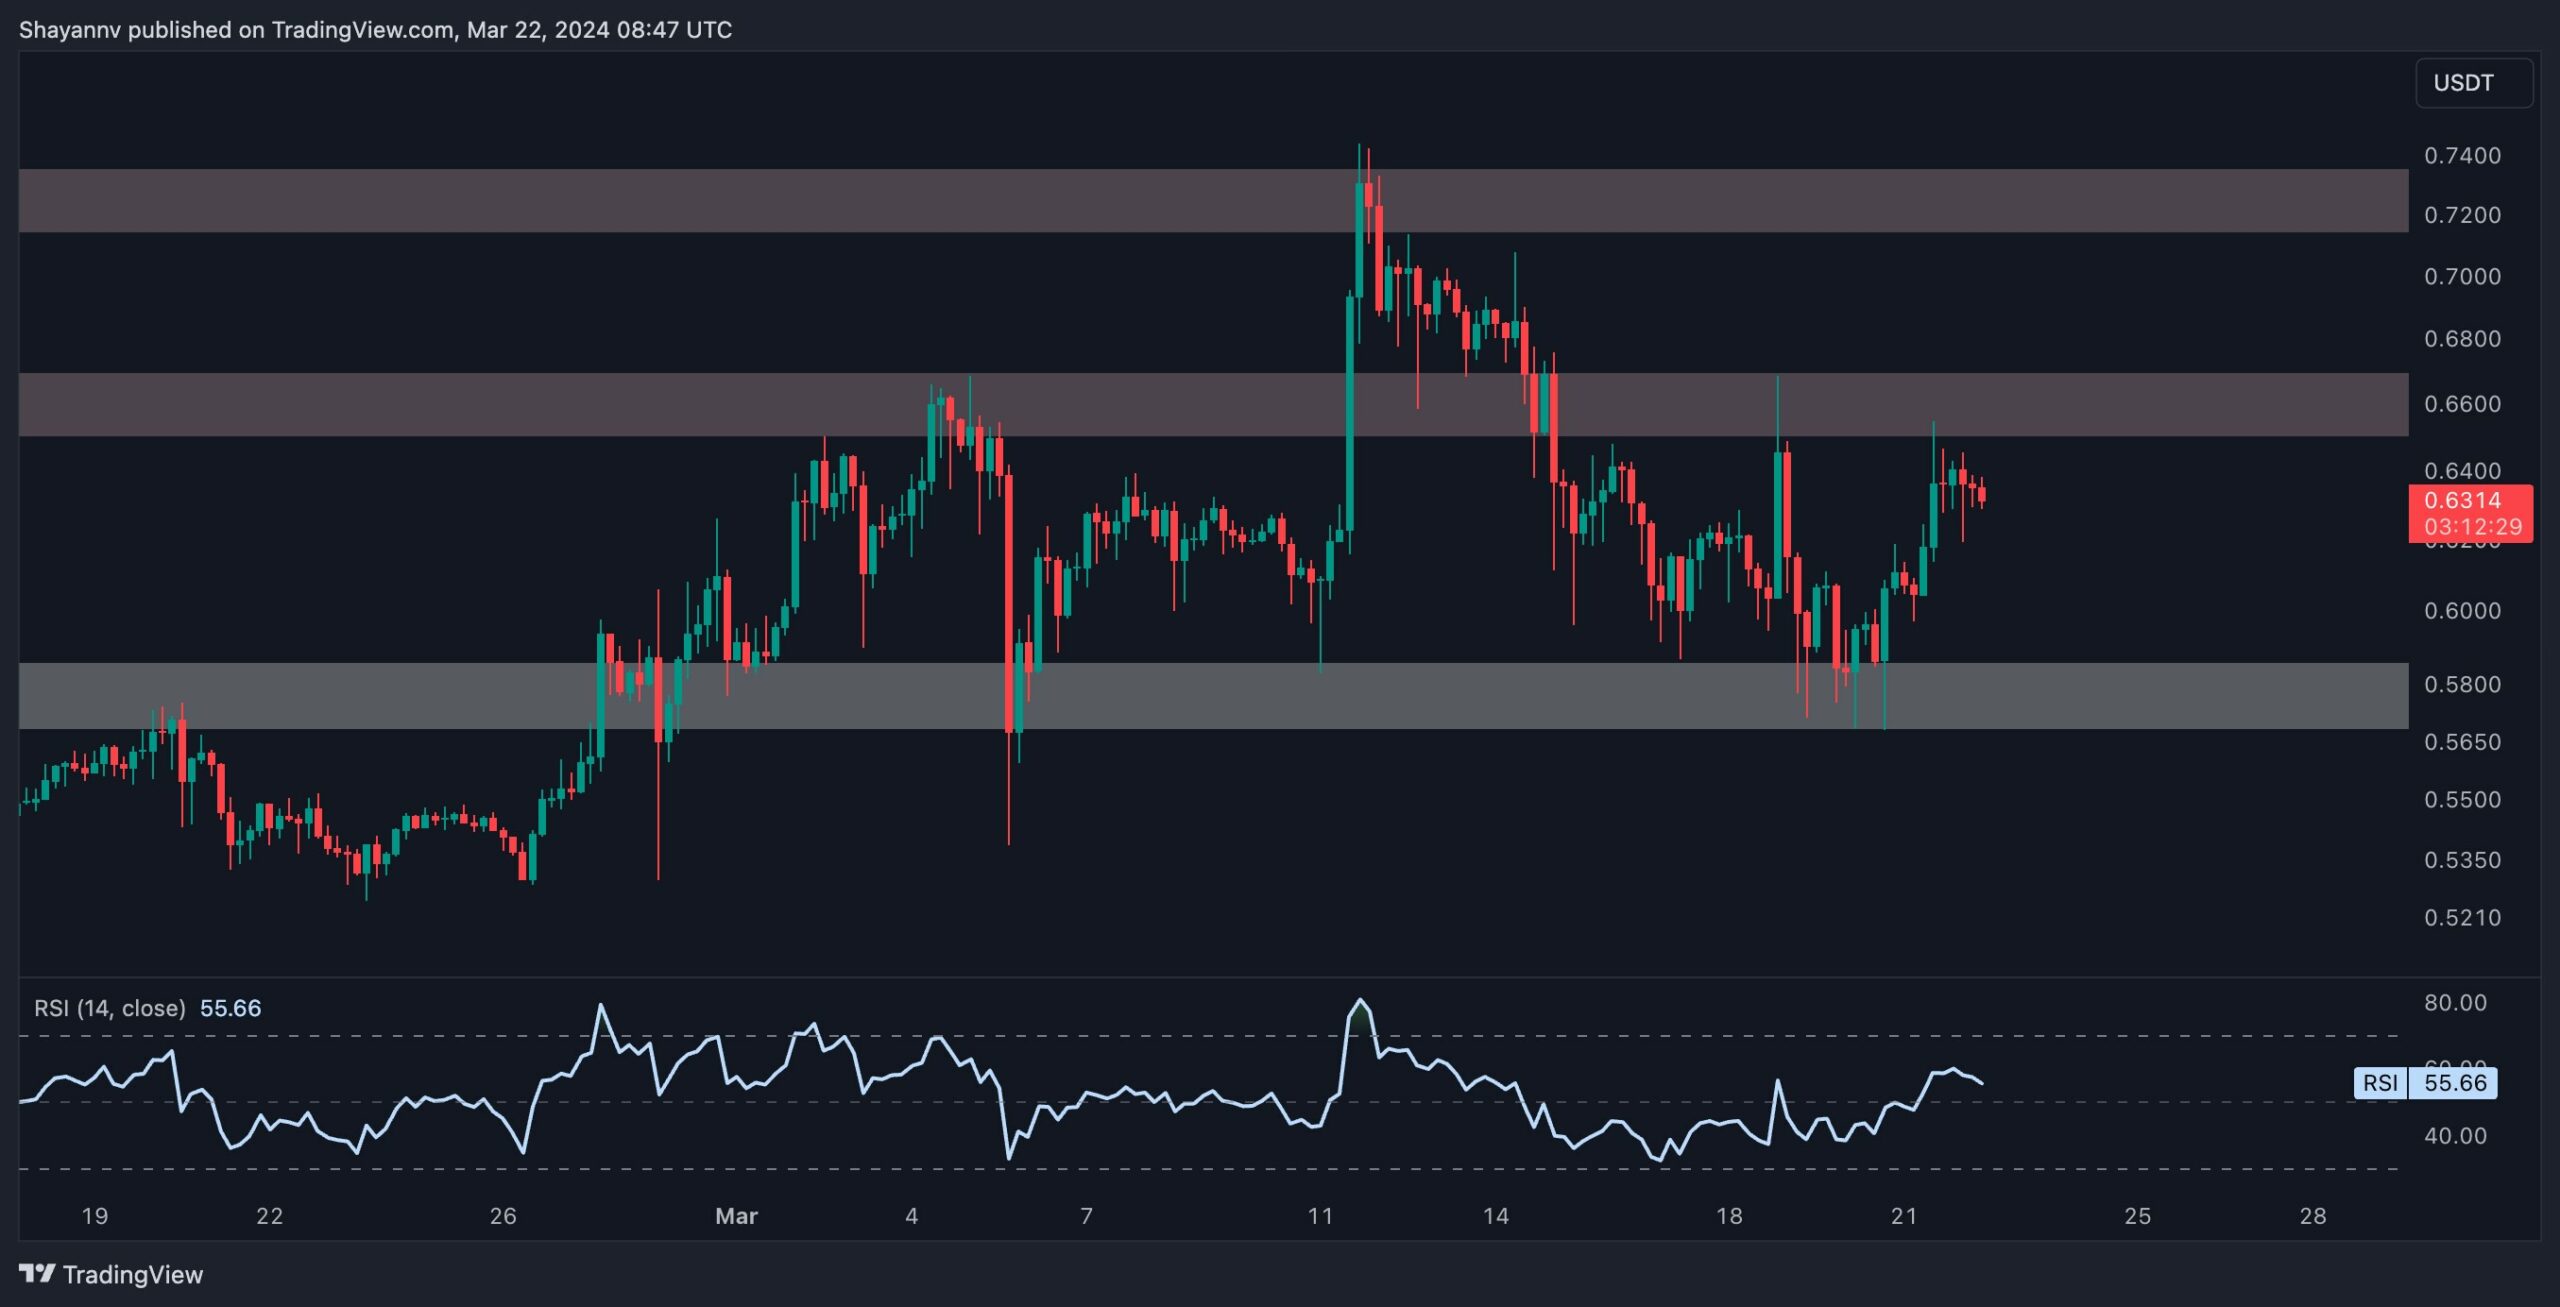
The 4-Hour Chart
A closer examination of the 4-hour chart reveals a significant rejection following a surge towards the $0.74 region, resulting in a noteworthy 23% decline in Ripple’s price. However, the cryptocurrency found support upon reaching the crucial $0.56 price region, potentially halting the recent downward correction.
Nonetheless, Ripple’s price is expected to remain within the substantial $0.57 support region and the notable $0.74 resistance level, implying the possibility of prolonged consolidation within this pivotal range until a breakout occurs. A breach above the $0.74 threshold would shift focus toward the $0.80 resistance level as the next focal point for Ripple’s price trajectory.