Following an extended period of sideways consolidation, the price underwent an unforeseen impulsive cascade, breaching the lower boundary of the range. Consequently, the market appears to have transitioned into a phase of successive bearish movements, signaling prevailing negative sentiment. By Shayan Ripple Price Analysis: The Daily Chart Examining the daily chart reveals that Ripple has decisively broken below its multi-month sideways consolidation range, experiencing a significant 22% cascade that triggered numerous sell-stop orders. This led to a substantial long-squeeze event, propelling the price below a critical support region encompassing the 100-day and 200-day moving averages, as well as the %excerpt%.57 static support range. This support range is pivotal, and a
Topics:
CryptoVizArt considers the following as important: Ripple (XRP) Price, XRP Analysis, xrpbtc, xrpusd
This could be interesting, too:
Jordan Lyanchev writes Ripple’s (XRP) Surge to Triggers Over Million in Short Liquidations
Jordan Lyanchev writes Trump Confirms Work on Strategic Crypto Reserve: XRP, ADA, SOL Included
Dimitar Dzhondzhorov writes Is a Major Ripple v. SEC Lawsuit Development Expected This Week? Here’s Why
Mandy Williams writes Ripple Releases Institutional DeFi Roadmap for XRP Ledger in 2025
Following an extended period of sideways consolidation, the price underwent an unforeseen impulsive cascade, breaching the lower boundary of the range.
Consequently, the market appears to have transitioned into a phase of successive bearish movements, signaling prevailing negative sentiment.
By Shayan
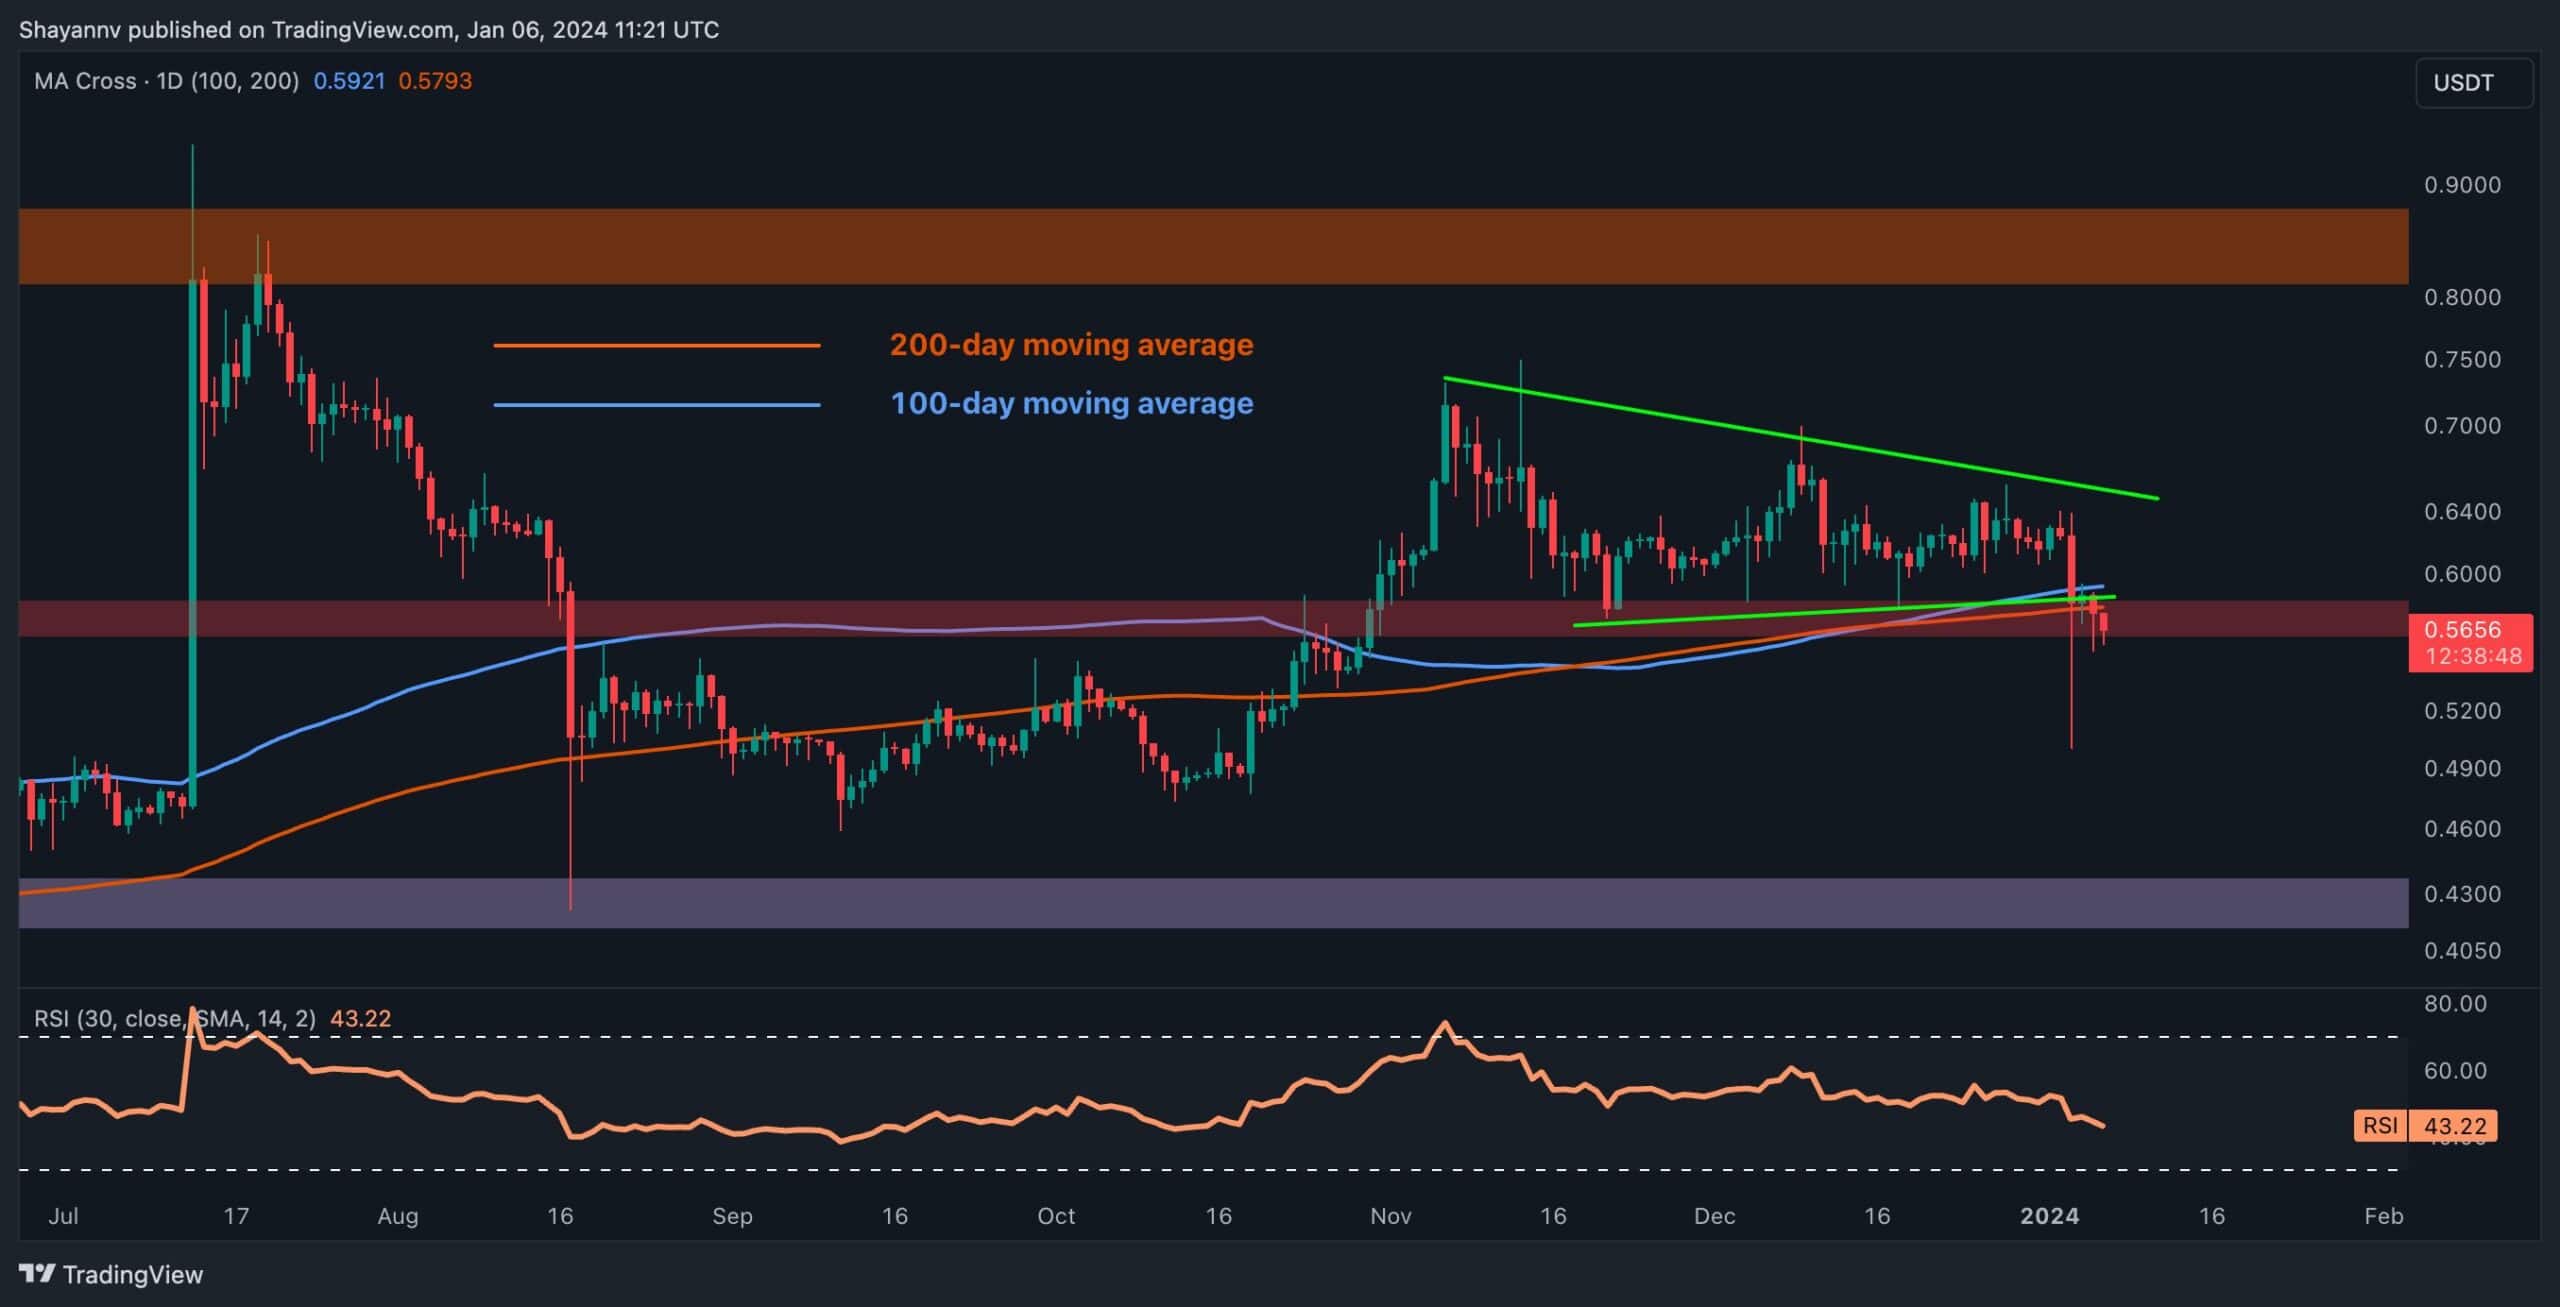
Ripple Price Analysis: The Daily Chart
Examining the daily chart reveals that Ripple has decisively broken below its multi-month sideways consolidation range, experiencing a significant 22% cascade that triggered numerous sell-stop orders. This led to a substantial long-squeeze event, propelling the price below a critical support region encompassing the 100-day and 200-day moving averages, as well as the $0.57 static support range. This support range is pivotal, and a successful breach below it unmistakably signifies the dominance of bearish sentiment in the market.
However, the price has retraced back to the breached level, potentially completing a pullback. If this pullback is confirmed, signifying a successful breakout, Ripple’s price may undergo a mid-term downward trend toward the substantial $0.48 support region.
Nevertheless, there is a faint possibility that the recent breakout could be a false one, with the price retracing back above the breached range. If successful, the market might initiate a fresh surge, targeting the $0.7 resistance threshold.
The 4-Hour Chart
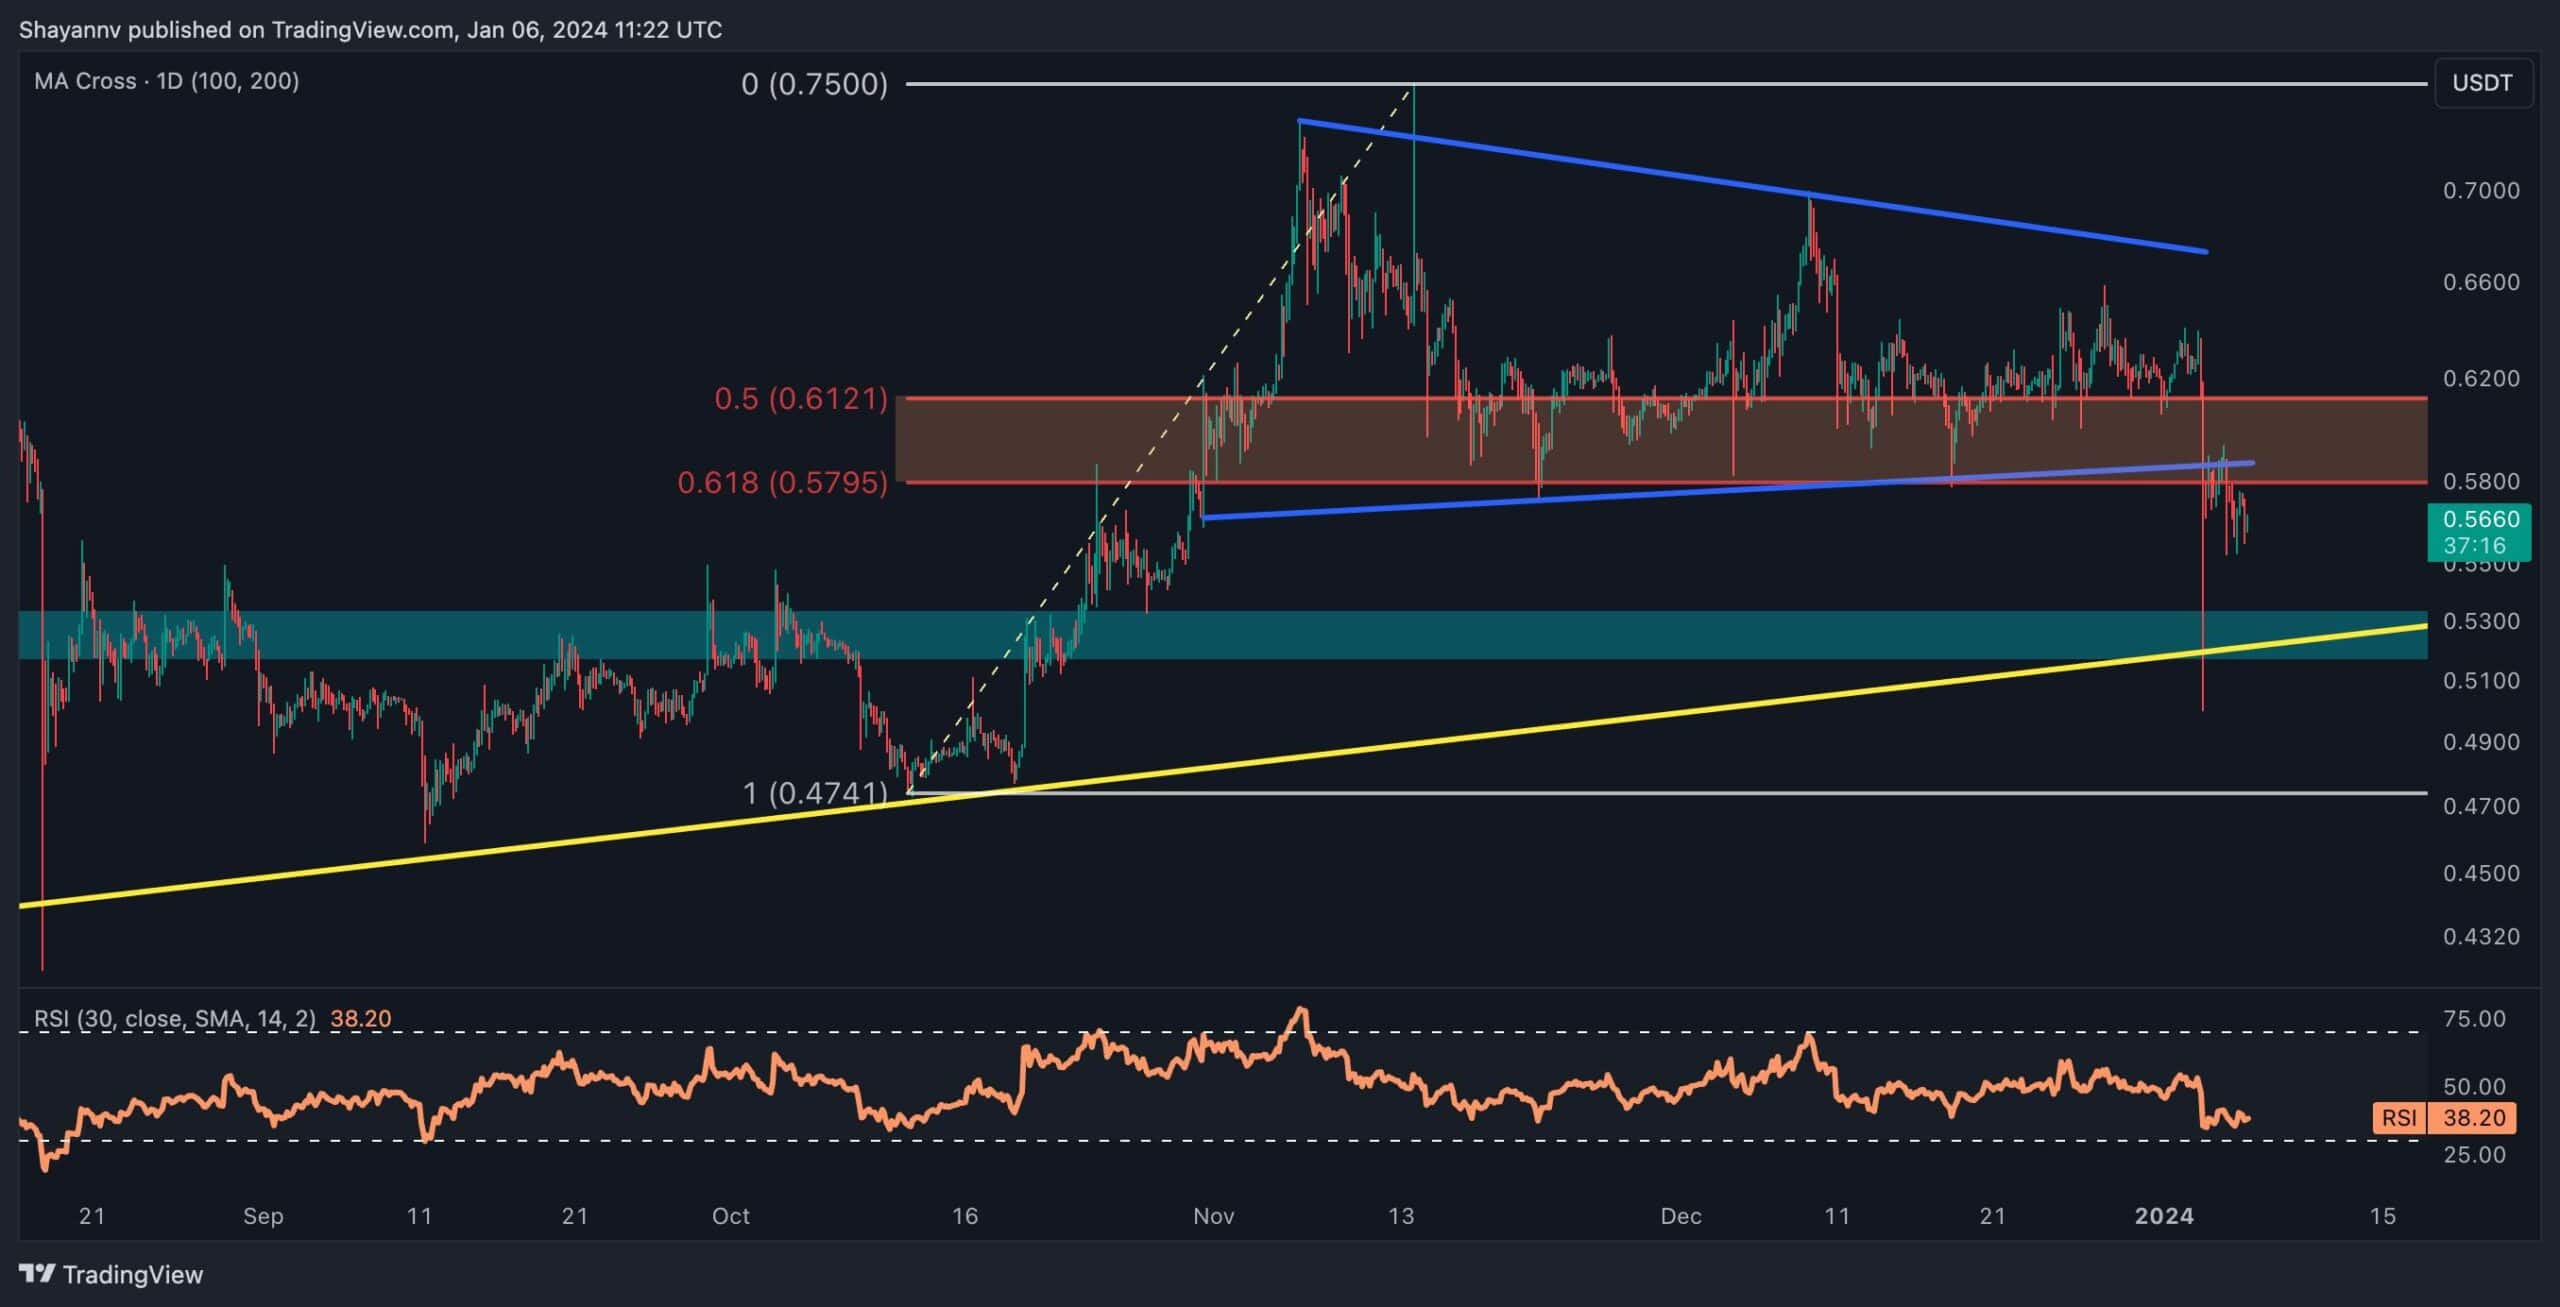
A closer analysis of the 4-hour chart emphasizes an impulsive breach below a significant support region, spanning from the critical 0.5 ($0.61) to 0.618 ($0.58) levels of the Fibonacci retracement, aligning harmoniously with the lower boundary of the wedge.
The break below this crucial range indicates seller dominance in the market.
However, the impulsive cascade found support at the crucial region of $0.51, along with the multi-month ascending trendline, where demand outweighed supply. As a result, an immediate reversal occurred, retracing the price toward the breached support region, now acting as a formidable resistance and potentially completing a pullback.
Nevertheless, Ripple appears to be confined within a significant range, defined by the resistance region marked by the critical 0.5 ($0.61) to 0.618 ($0.58) Fibonacci retracement levels and the crucial support of $0.51. Consequently, a mid-term consolidation stage within this essential range is expected for Ripple in the mid-term.