XRP’s price has been confined within a multi-month sideways triangle pattern, recently converging at a pivotal resistance area near the 200-day moving average and the triangle’s tightening range. As a result, a breakout seems imminent, poised to determine Ripple’s future trajectory. By Shayan The Daily Chart An analysis of the daily chart unveils XRP’s gradual ascent, resulting in its encounter with a critical resistance zone. It encompasses the significant 200-day moving average, positioned at %excerpt%.5664. Simultaneously, the price has approached the narrowing range of the triangle pattern, heightening the potential for an imminent breakout in either direction. However, given the formidable resistance currently faced by the price, a rejection appears most likely, potentially
Topics:
CryptoVizArt considers the following as important: Ripple (XRP) Price, XRP Analysis, xrpbtc, xrpusd
This could be interesting, too:
Jordan Lyanchev writes Ripple’s (XRP) Surge to Triggers Over Million in Short Liquidations
Jordan Lyanchev writes Trump Confirms Work on Strategic Crypto Reserve: XRP, ADA, SOL Included
Dimitar Dzhondzhorov writes Is a Major Ripple v. SEC Lawsuit Development Expected This Week? Here’s Why
Mandy Williams writes Ripple Releases Institutional DeFi Roadmap for XRP Ledger in 2025
XRP’s price has been confined within a multi-month sideways triangle pattern, recently converging at a pivotal resistance area near the 200-day moving average and the triangle’s tightening range.
As a result, a breakout seems imminent, poised to determine Ripple’s future trajectory.
By Shayan
The Daily Chart
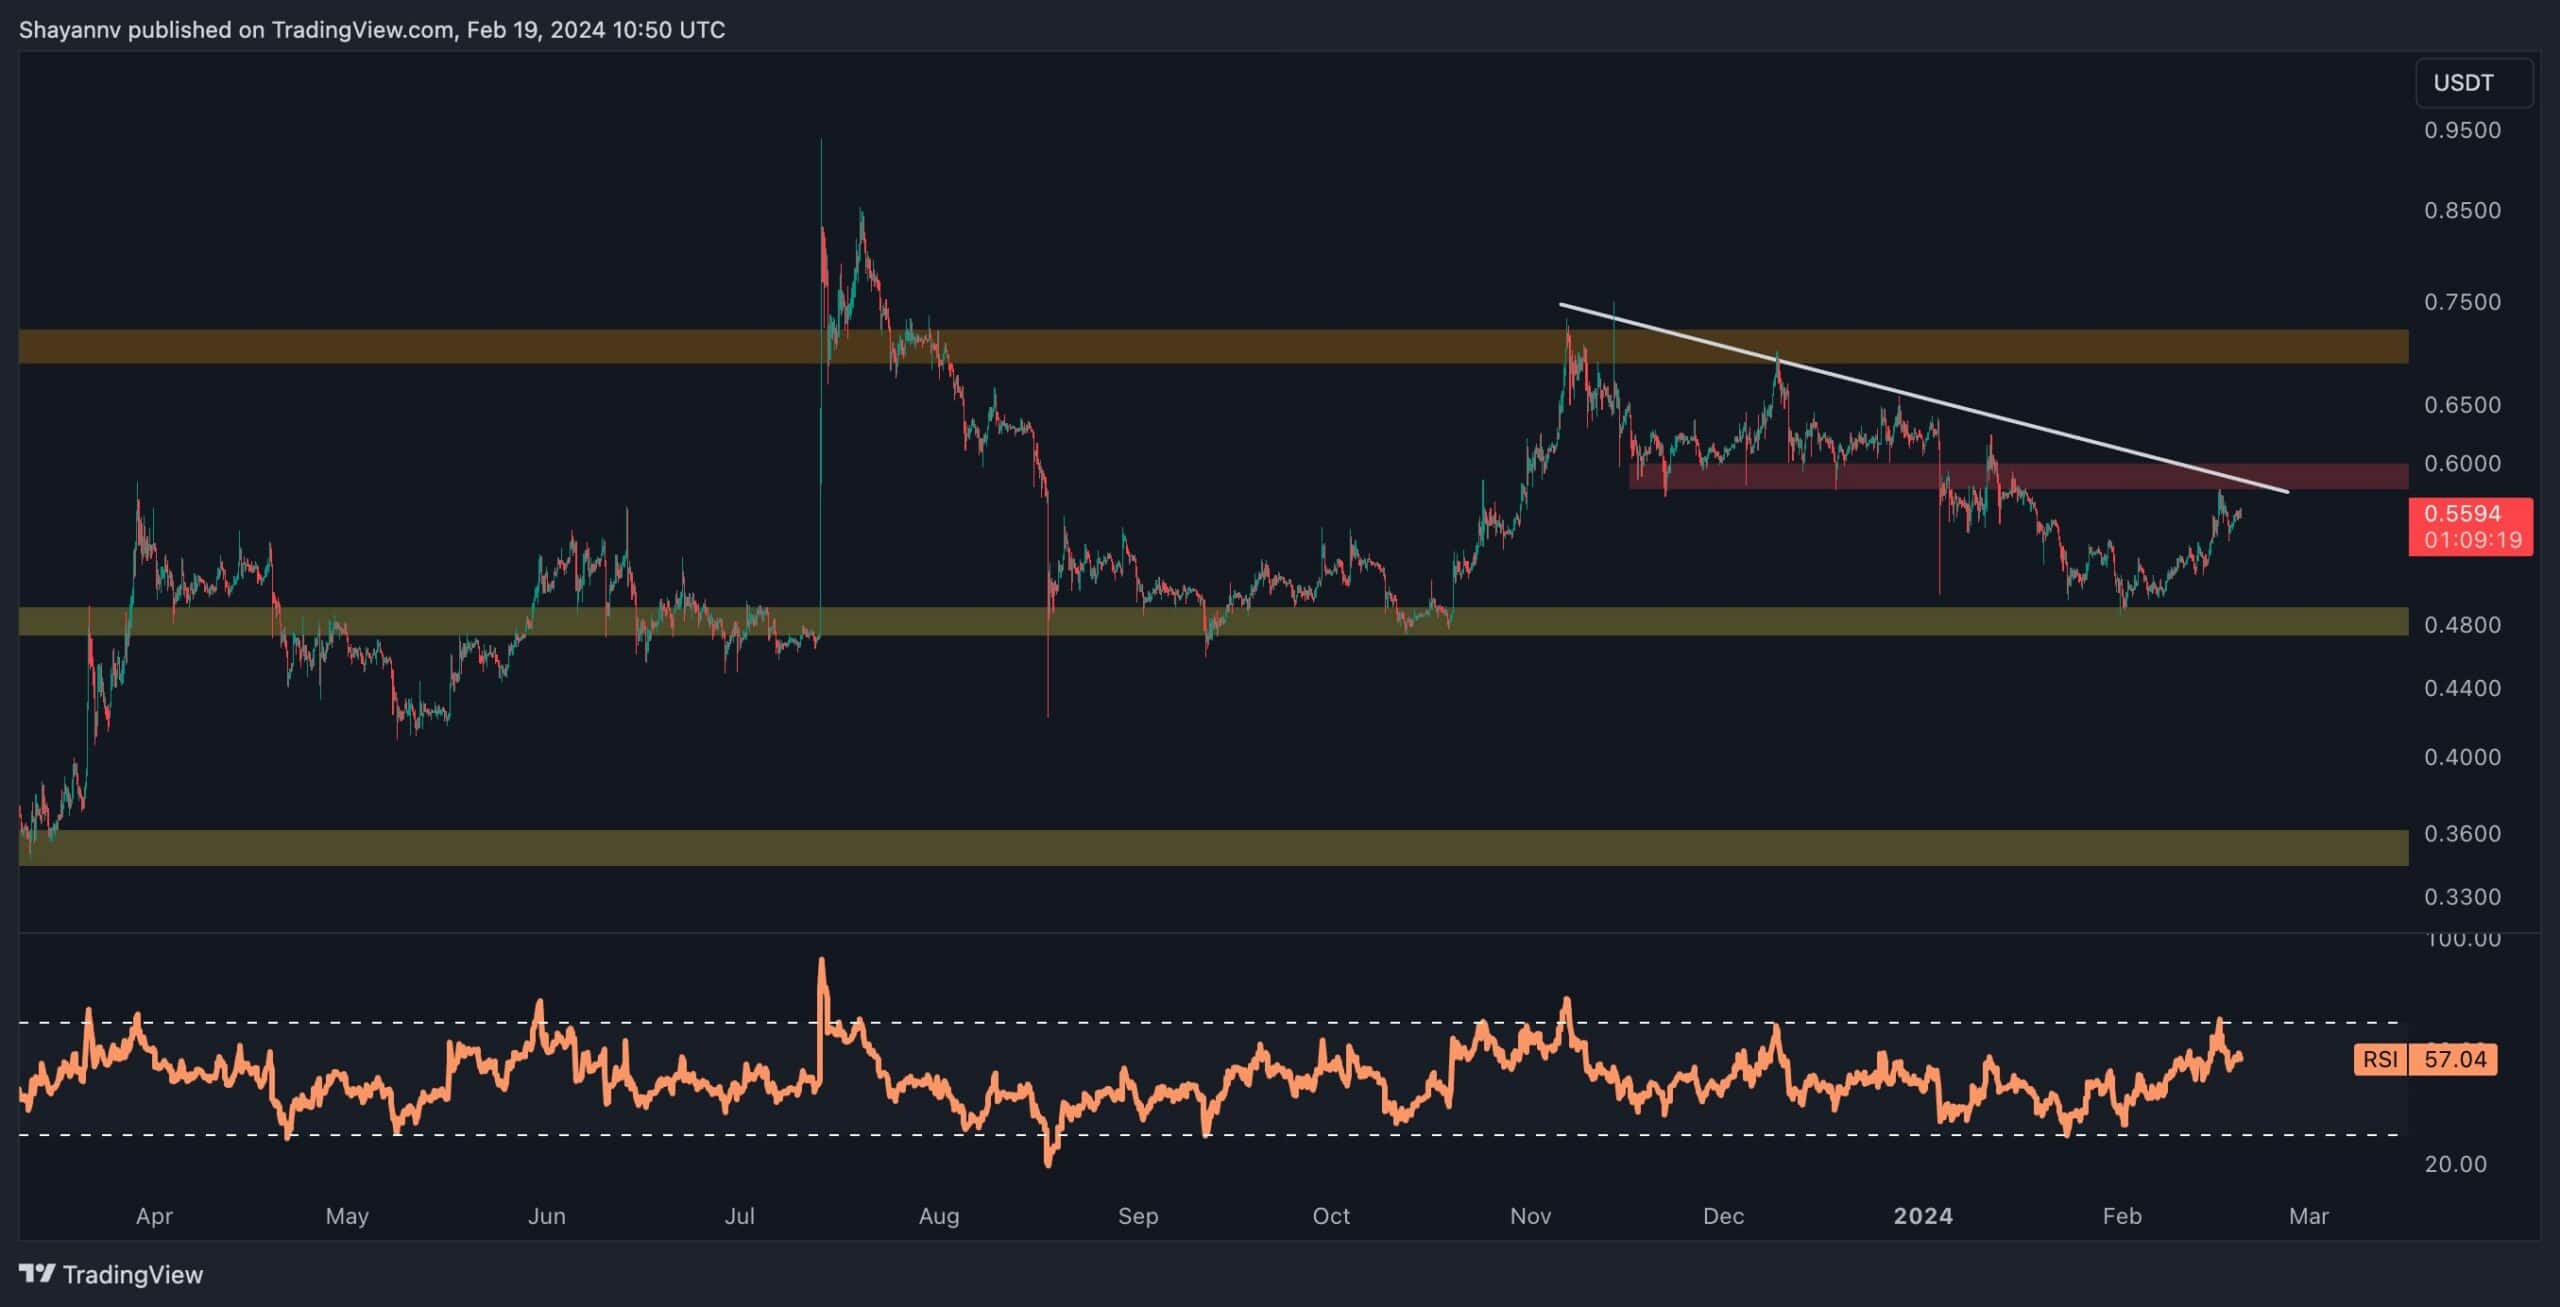
An analysis of the daily chart unveils XRP’s gradual ascent, resulting in its encounter with a critical resistance zone. It encompasses the significant 200-day moving average, positioned at $0.5664.
Simultaneously, the price has approached the narrowing range of the triangle pattern, heightening the potential for an imminent breakout in either direction.
However, given the formidable resistance currently faced by the price, a rejection appears most likely, potentially leading to a retracement towards the lower boundary of the range. Despite XRP’s subdued volatility and lack of momentum, the prevailing scenario in the short term suggests a phase of sideways consolidation before the next decisive move, aligned with the breakout’s direction.
The 4-Hour Chart
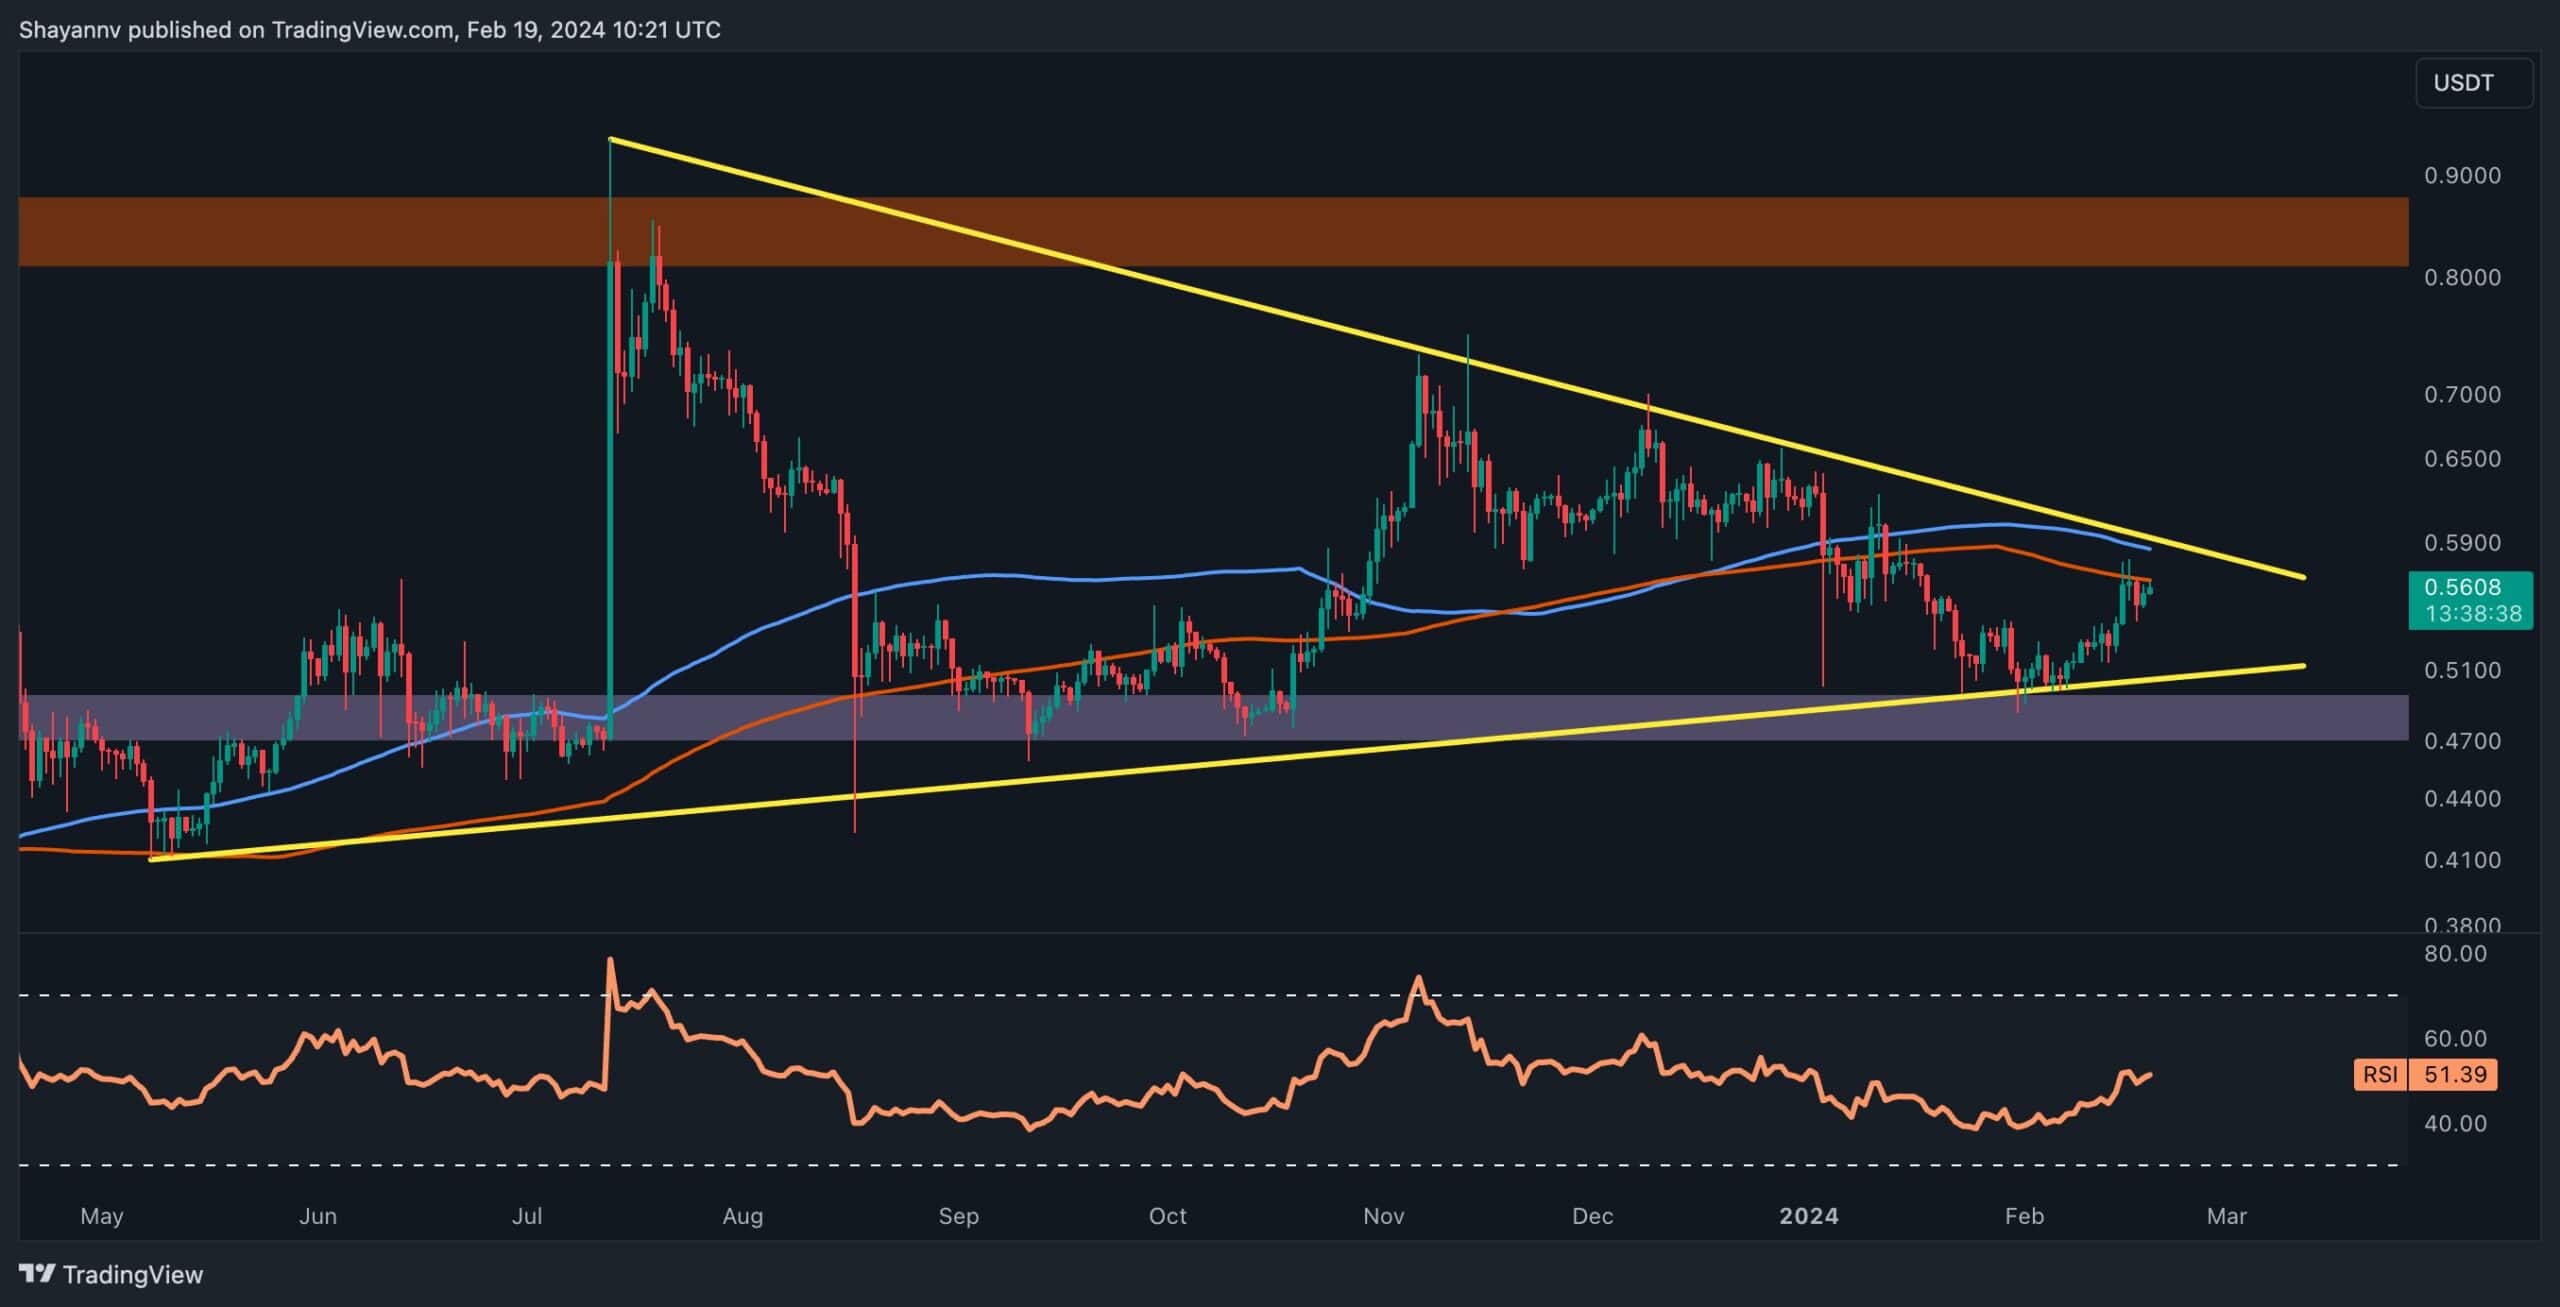
A closer examination of the 4-hour chart underscores a significant price reversal at the critical support level of $0.49. However, XRP has now reached a notable resistance region near $0.58, coinciding with the multi-month descending trendline.
Consequently, owing to the presence of supply near this pivotal threshold, a reversal prompting a bearish retracement appears highly probable.
Nevertheless, XRP remains confined within the $0.5 to $0.6 range in the bigger picture, indicating the likelihood of protracted consolidation within this pivotal interval until a breakout materializes.
Should a sudden breach above the descending trendline occur, the attention will pivot towards the $0.7 resistance region as the subsequent focal point for Ripple’s price trajectory.