Ripple is currently in a prolonged consolidation phase, hovering near a decisive support region with minimal volatility and slight movements. An imminent breakout is expected, with its direction likely indicating the upcoming trend. By Shayan The Daily Chart A detailed examination of the daily chart reveals that Ripple has been consolidating between the substantial support of %excerpt%.47 and the crucial resistance of %excerpt%.55, with the price forming a sideways triangle pattern. On the other hand, the range’s upper boundary also aligns with the 100-day and 200-day moving averages, making it a decisive level of supply and acting as robust resistance. The price is currently hovering around the triangle’s lower boundary at %excerpt%.47, approaching the narrow range of the pattern with
Topics:
CryptoVizArt considers the following as important: Ripple (XRP) Price, XRP Analysis, xrpbtc, xrpusd
This could be interesting, too:
Jordan Lyanchev writes Ripple’s (XRP) Surge to Triggers Over Million in Short Liquidations
Jordan Lyanchev writes Trump Confirms Work on Strategic Crypto Reserve: XRP, ADA, SOL Included
Dimitar Dzhondzhorov writes Is a Major Ripple v. SEC Lawsuit Development Expected This Week? Here’s Why
Mandy Williams writes Ripple Releases Institutional DeFi Roadmap for XRP Ledger in 2025
Ripple is currently in a prolonged consolidation phase, hovering near a decisive support region with minimal volatility and slight movements. An imminent breakout is expected, with its direction likely indicating the upcoming trend.
By Shayan
The Daily Chart
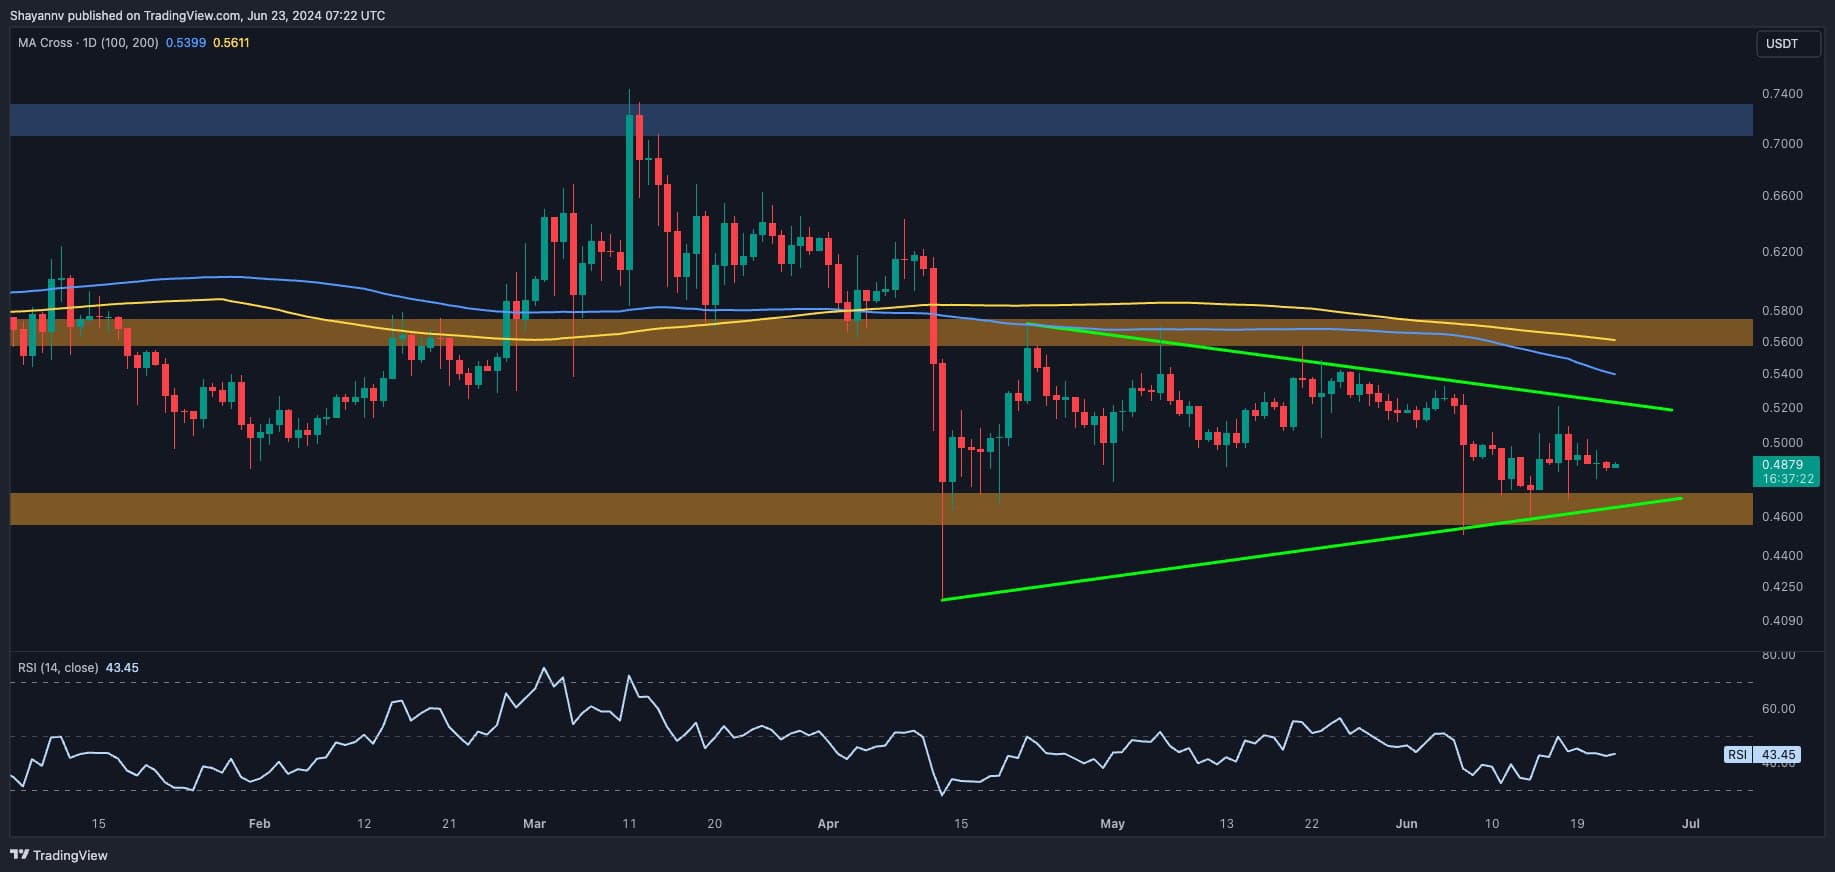
A detailed examination of the daily chart reveals that Ripple has been consolidating between the substantial support of $0.47 and the crucial resistance of $0.55, with the price forming a sideways triangle pattern.
On the other hand, the range’s upper boundary also aligns with the 100-day and 200-day moving averages, making it a decisive level of supply and acting as robust resistance.
The price is currently hovering around the triangle’s lower boundary at $0.47, approaching the narrow range of the pattern with minimal volatility. This action indicates a balance between buyers and sellers and hints at an imminent breakout. The direction of this breakout will likely determine Ripple’s trend in the mid-term.
The 4-Hour Chart
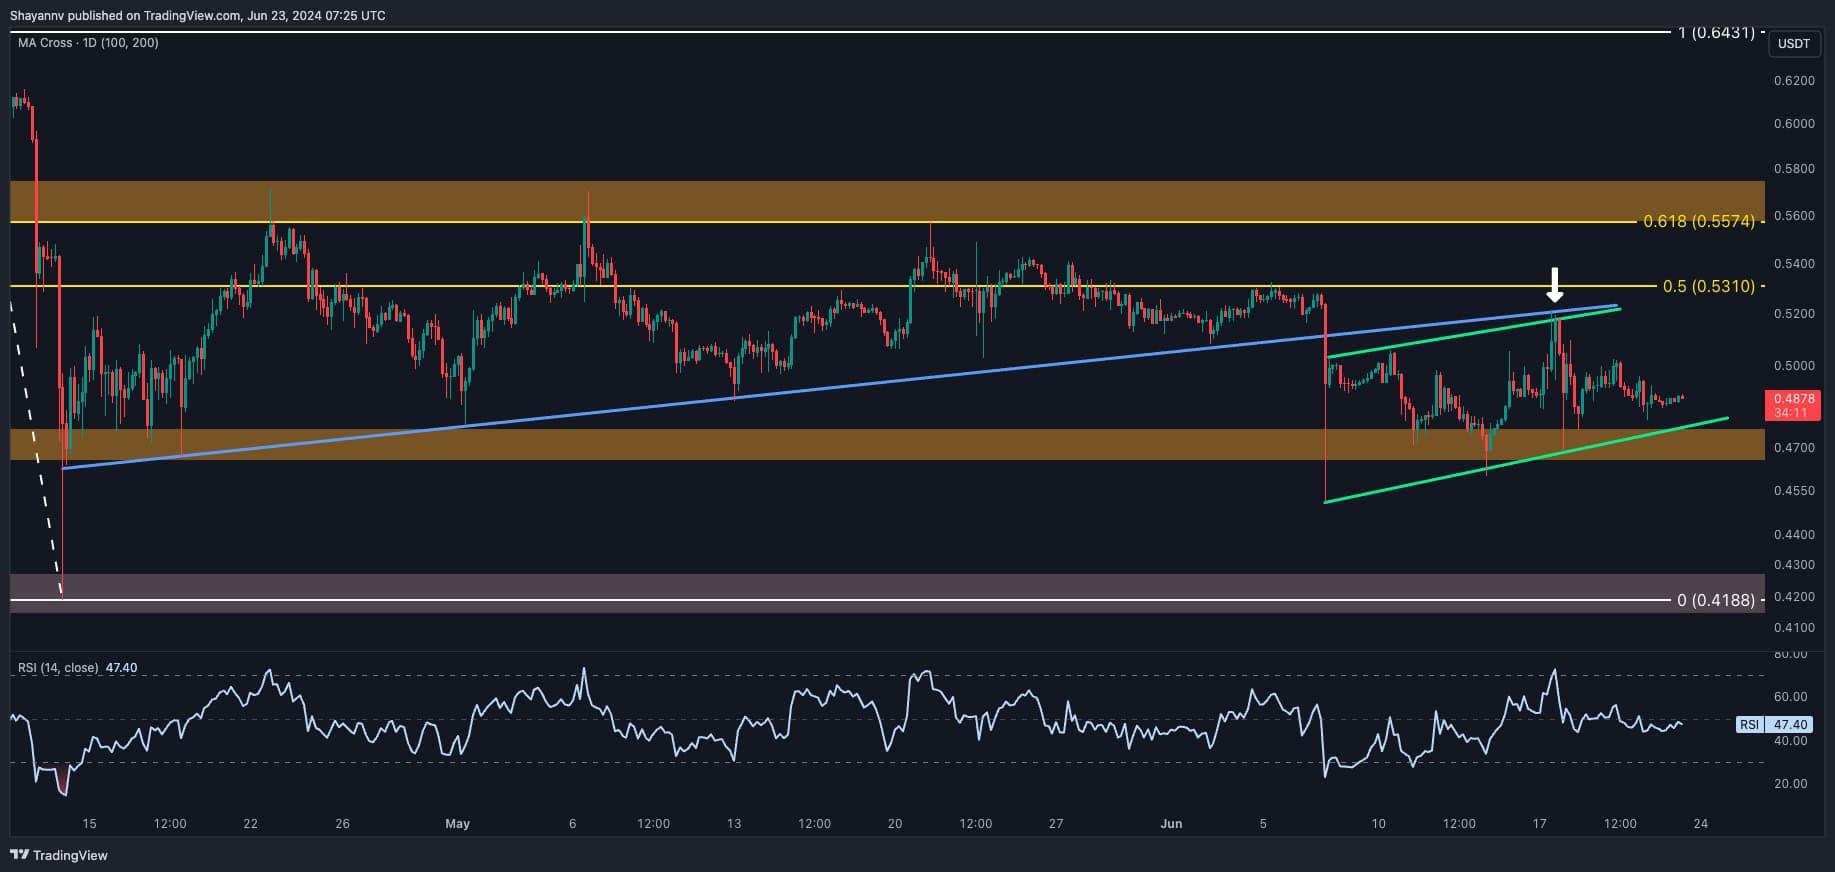
On the 4-hour chart, recent price action shows a break below a multi-week ascending trendline, followed by a retracement to the broken level, completing a pullback.
This development indicates a bearish sentiment in the market, with sellers maintaining dominance, leading to retracements and fluctuations. On the other hand, the price has formed an ascending flag pattern, typically signaling a continuation of the preceding bearish trend.
The price is nearing a critical juncture at the lower boundary of the ascending flag pattern, which aligns with the crucial support level of $0.47. A breakout below this juncture would likely trigger a cascade effect, with the next target being the significant support at $0.42.