Ethereum has been pretty stable over the past month, following a minor increase of 1.5%. However, things might get a bit rocky over the next few days for Ethereum if it breaks beneath the current short term ascending price channel. A break beneath the channel could result in Ethereum’s drop toward the 0 support level.Ethereum continues to be the second-largest cryptocurrency with a market cap of .39 billion.Looking at the ETH/USD 1-day chart:Since our previous ETH/USD analysis, Ethereum chose to trade sideways after reaching the resistance at the 4 level. Over the past two weeks, Ethereum had been trading within the confines of a short term ascending price channel as it tests the lower boundary at this moment.From above: The nearest level of resistance lies at 6.48 and 0.
Topics:
Yaz Sheikh considers the following as important: ETH, ETH Analysis
This could be interesting, too:
CryptoVizArt writes Will Weak Momentum Drive ETH to .5K? (Ethereum Price Analysis)
CryptoVizArt writes Ethereum Price Analysis: Following a 15% Weekly Crash, What’s Next for ETH?
CryptoVizArt writes ETH Seems Primed to Take Down K After Recent Rebound: Ethereum Price Analysis
CryptoVizArt writes Ethereum Price Analysis: Can ETH Take Down K Resistance After Gaining 10% Weekly?
Ethereum has been pretty stable over the past month, following a minor increase of 1.5%. However, things might get a bit rocky over the next few days for Ethereum if it breaks beneath the current short term ascending price channel. A break beneath the channel could result in Ethereum’s drop toward the $150 support level.
Ethereum continues to be the second-largest cryptocurrency with a market cap of $18.39 billion.
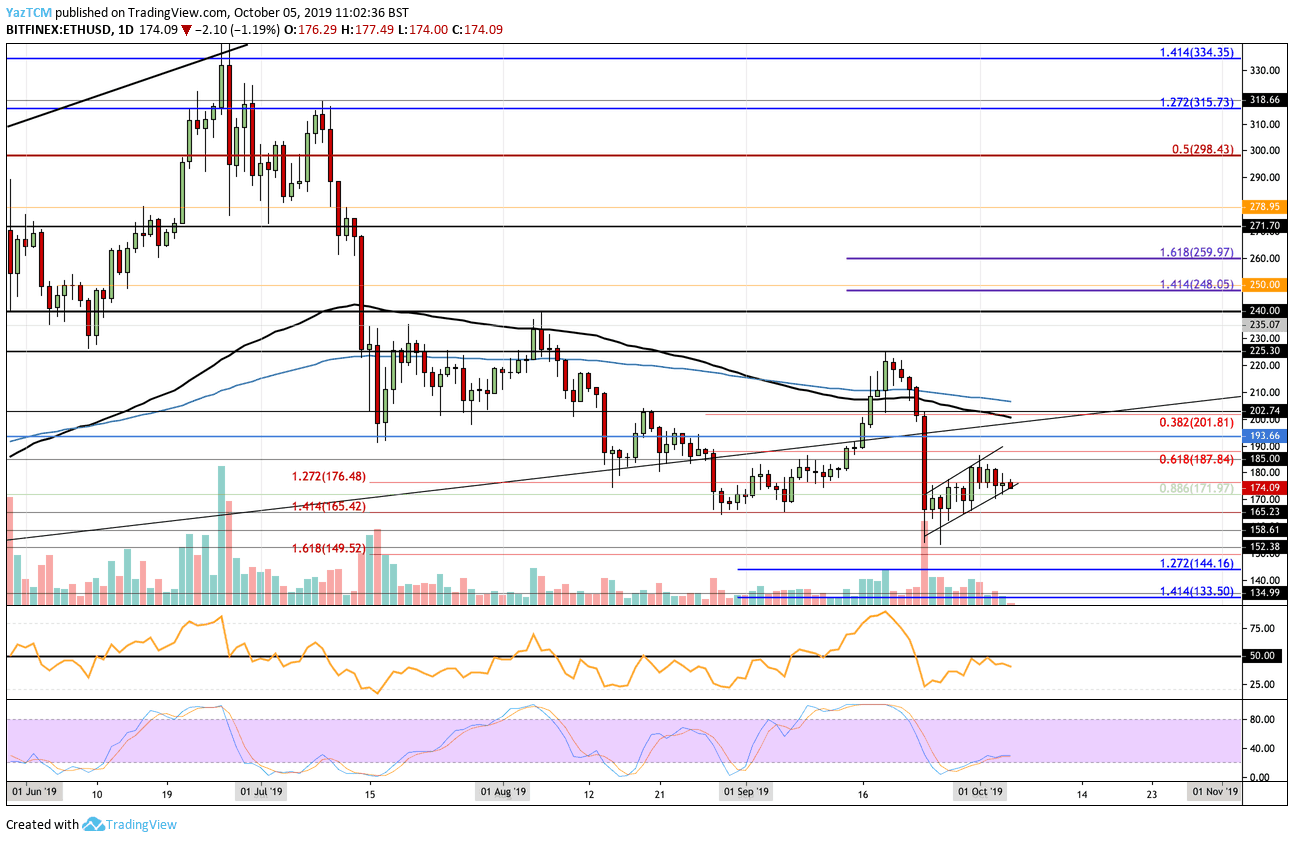
Looking at the ETH/USD 1-day chart:
- Since our previous ETH/USD analysis, Ethereum chose to trade sideways after reaching the resistance at the $184 level. Over the past two weeks, Ethereum had been trading within the confines of a short term ascending price channel as it tests the lower boundary at this moment.
- From above: The nearest level of resistance lies at $176.48 and $180. Above this, resistance is located at $185, $187.84, $193.66, and $200. Above $200, congestion is expected between $201 and $210 due to the 100-days EMA and 200-days EMA being located here.
- From below: The nearest levels of support lie at $172, $170, and $165.42. The support at $165.42 has held and prevented the market from dropping further lower during both August and September. Beneath this significant support, support can be found at $160, $158.61, $152.38, $149.52, and $144.16.
- The trading volume has started to decrease during October.
- The RSI has recently attempted to break above the 50 levels but has failed to do so which shows that the sellers remain in momentum. However, the Stochastic RSI is trading in the oversold territory as we wait for a bullish crossover signal to send the market higher.
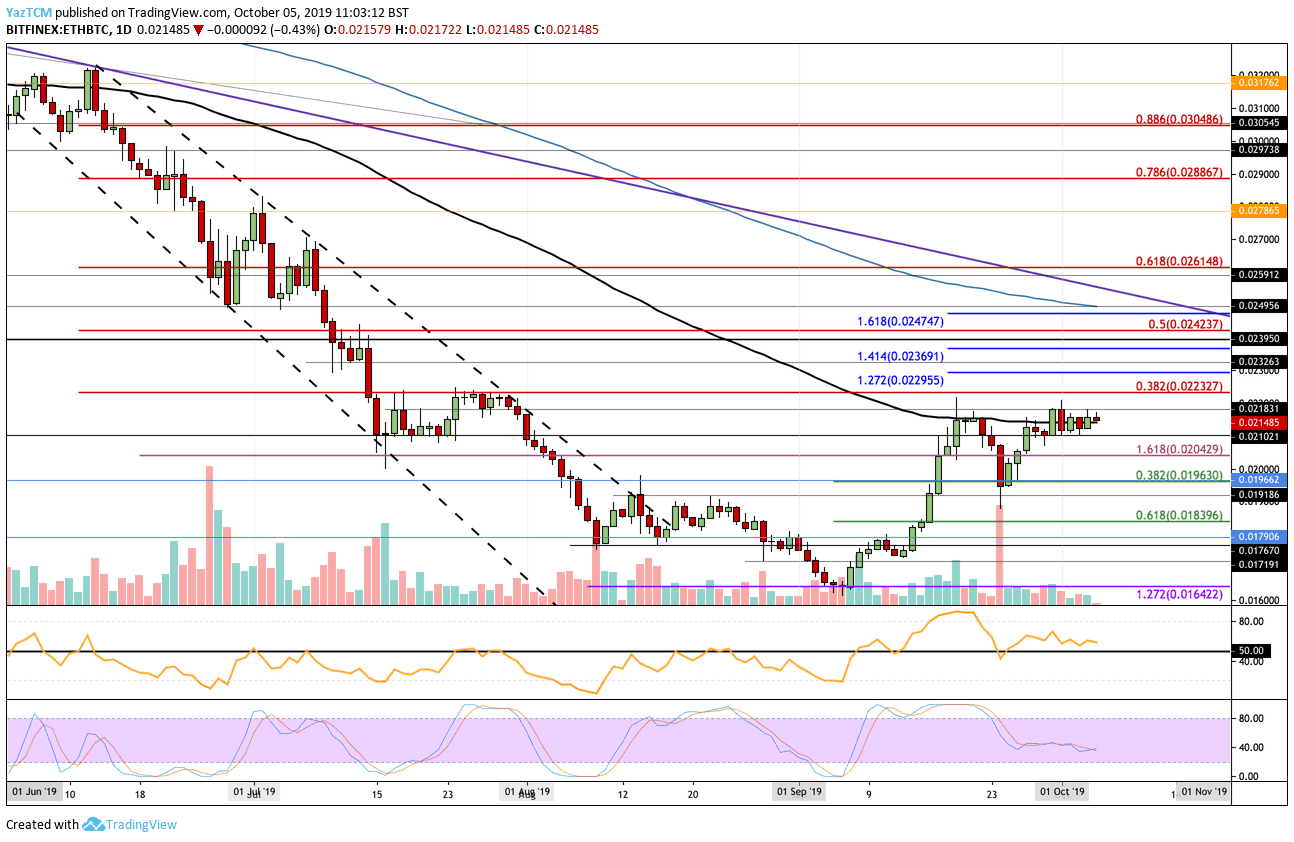
Looking at the ETH/BTC 1-day chart:
- Against BTC, ETH has continued to trade sideways along the 100-days EMA around 0.021485 BTC. The coin is secured from above by resistance at 0.02183 BTC and has been unable to rise above during September and October.
- Higher above: Next resistance levels lie at 0.02232 BTC (bearish .382 Fibonacci Retracement level), 0.02295 BTC (1.272 Fib Extension), 0.02326 BTC, 0.02369 BTC (1.414 Fibonacci Extension), and 0.02423 BTC (bearish .5 Fibonacci Retracement). Significant higher resistance is then expected at the 200-days EMA at 0.02495 BTC.
- From below: The nearest level of support lies at 0.021 BTC. Beneath this, support lies at 0.020429 BTC, and 0.020 BTC. Lower support is found at 0.01963 BTC (.382 Fib Retracement), 0.01918 BTC, and 0.01839 BTC (.618 Fib Retracement).
- The trading volume of ETH/BTC has dropped significantly during October.
- The RSI remains above the 50 level which shows that the buyers are still in control over the market momentum, however, this seems to be very weak. If we want to break above the 100-days EMA, we would need to see the RSI rise higher from the 50 levels.