ETH/USD – Bulls Continue Further On The Road To 0.Key Support Levels: 8, 4, 0.Key Resistance Levels:2, 0, 0.Last week, Ethereum broke above a symmetrical triangle consolidation pattern and started to push higher over the weekend. It managed to climb above the 2019 high at 4 as it ran into resistance at a bearish .382 Fib Retracement at around 8 yesterday.Today, Ethereum continued to surge higher by a total of 5%. This allowed the coin to break above the 8 resistance as it runs into the 4 level (1.272 Fib Extension level).ETH/USD Daily Chart. Source: TradingViewETH-USD Short Term Price PredictionLooking ahead, if the bulls can break 5, the next level is located at 2 (1.414 Fib). Above this, resistance lies 0. Beyond 0, additional resistance is
Topics:
Yaz Sheikh considers the following as important: ETH Analysis, ETHBTC, Ethereum (ETH) Price, ethusd
This could be interesting, too:
Mandy Williams writes Ethereum Derivatives Metrics Signal Modest Downside Tail Risk Ahead: Nansen
Jordan Lyanchev writes Weekly Bitcoin, Ethereum ETF Recap: Light at the End of the Tunnel for BTC
CryptoVizArt writes Will Weak Momentum Drive ETH to .5K? (Ethereum Price Analysis)
Jordan Lyanchev writes Bybit Hack Fallout: Arthur Hayes, Samson Mow Push for Ethereum Rollback
ETH/USD – Bulls Continue Further On The Road To $400.
Key Support Levels: $378, $364, $350.
Key Resistance Levels:$392, $400, $410.
Last week, Ethereum broke above a symmetrical triangle consolidation pattern and started to push higher over the weekend. It managed to climb above the 2019 high at $364 as it ran into resistance at a bearish .382 Fib Retracement at around $378 yesterday.
Today, Ethereum continued to surge higher by a total of 5%. This allowed the coin to break above the $378 resistance as it runs into the $384 level (1.272 Fib Extension level).
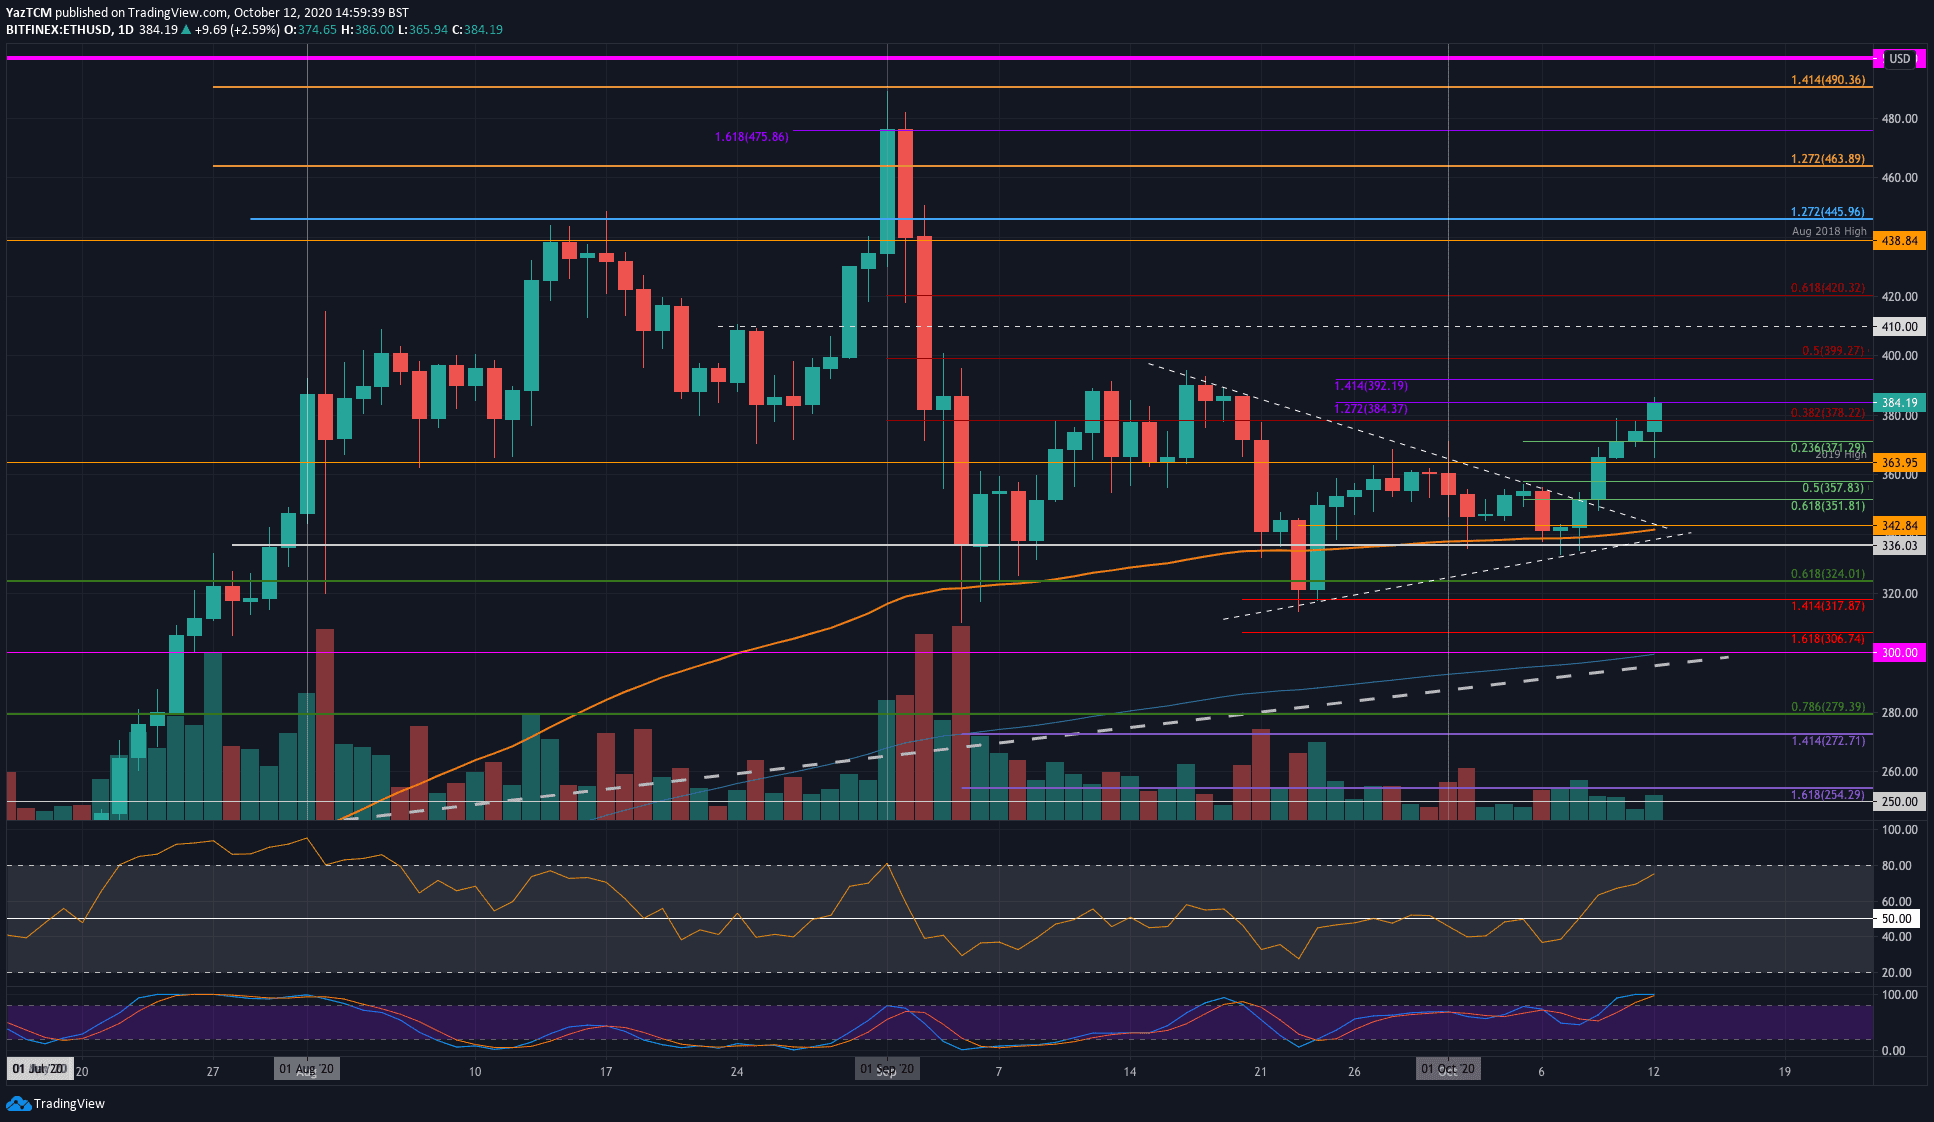
ETH-USD Short Term Price Prediction
Looking ahead, if the bulls can break $385, the next level is located at $392 (1.414 Fib). Above this, resistance lies $400. Beyond $400, additional resistance is located at $410 and $420 (bearish .618 Fib Retracement).
On the other side, if the sellers head lower, the first support level lies at $378. Beneath this, support is located at $371 (.236 Fib), $364 (2019 Highs), $357, and $350.
The Stochastic RSI has produced a bearish crossover signal in oversold conditions, which is a short-term selling signal.
ETH/BTC – Ethereum Breaks Month-Long Falling Trend Line
Key Support Levels: 0.033 BTC, 0.032 BTC, 0.0315 BTC.
Key Resistance Levels: 0.0337 BTC, 0.034 BTC, 0.0347 BTC.
Ethereum penetrated above a month-long falling trend line last Friday as it pushed higher to reach the resistance at 0.033 BTC (Bearish .236 Fib Retracement). ETH struggled to break this resistance over the weekend but successfully pushed above it today as it trades at 0.0333 BTC.
For a bull run to form in ETH/BTC, the coin would need to pass the resistance at 0.0337 BTC.
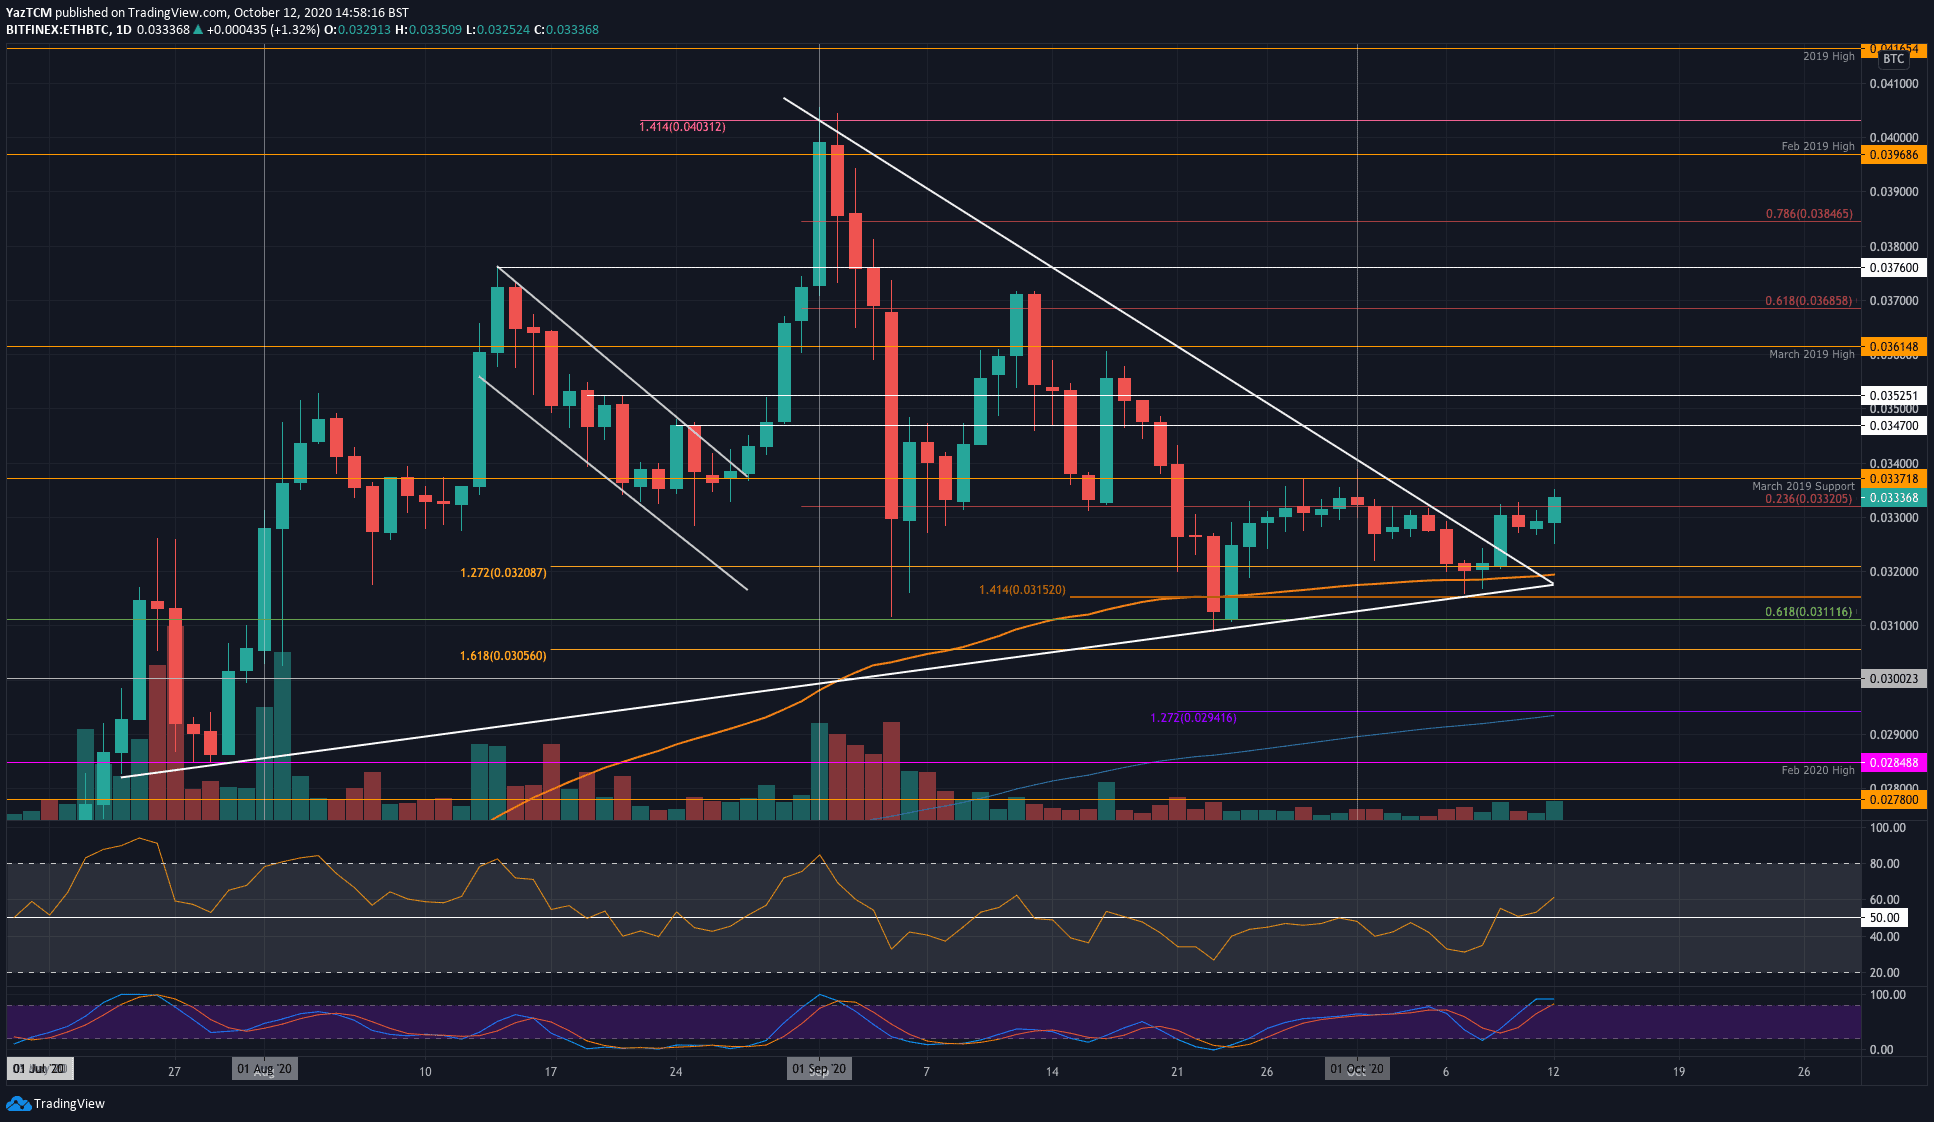
ETH-BTC Short Term Price Prediction
Looking ahead, if the sellers regroup and push lower, the first level of support lies at 0.033 BTC. This is followed by support at 0.032 BTC, 0.0315 BTC, 0.0311 BTC (.618 Fib), and 0.0305 BTC.
On the other side, the first level of resistance is located at 0.0337 BTC (March 2019 Support – now resistance). Above this, resistance lies at 0.034 BTC, 0.0347 BTC, and 0.0352 BTC.
Likewise, the Stochastic RSI is primed for a bearish crossover signal in overbought conditions.