ETH/USD – Ethereum Bulls Battling To Head Toward 0Key Support Levels: 0, 0, 5.Key Resistance Levels: 0, 2, 0.Etheruem surged by 15.5% this week, which allowed it to break resistance at 4 (bearish .786 Fib Retracement) to reach the current 5 price.The coin struggled to break 3 (1.414 Fib Extension) over the past 2-days and is continuing to consolidate in the past few days below 0 something that’s likely to end with a wild move. It is essential to wait for a daily candle close above 3 before confirming that it is ready to head toward 0 and beyond.ETH/USD Daily Chart. Source: TradingViewETH-USD Short Term Price PredictionLooking ahead, the first level of resistance lies at 0 (bearish .886 Fib Retracement). This is followed by 2, 0, and 0.
Topics:
Yaz Sheikh considers the following as important: ETH Analysis, ETHBTC, Ethereum (ETH) Price, ethusd
This could be interesting, too:
Mandy Williams writes Ethereum Derivatives Metrics Signal Modest Downside Tail Risk Ahead: Nansen
Jordan Lyanchev writes Weekly Bitcoin, Ethereum ETF Recap: Light at the End of the Tunnel for BTC
CryptoVizArt writes Will Weak Momentum Drive ETH to .5K? (Ethereum Price Analysis)
Jordan Lyanchev writes Bybit Hack Fallout: Arthur Hayes, Samson Mow Push for Ethereum Rollback
ETH/USD – Ethereum Bulls Battling To Head Toward $750
Key Support Levels: $720, $700, $675.
Key Resistance Levels: $750, $762, $790.
Etheruem surged by 15.5% this week, which allowed it to break resistance at $674 (bearish .786 Fib Retracement) to reach the current $735 price.
The coin struggled to break $733 (1.414 Fib Extension) over the past 2-days and is continuing to consolidate in the past few days below $750 something that’s likely to end with a wild move. It is essential to wait for a daily candle close above $733 before confirming that it is ready to head toward $750 and beyond.
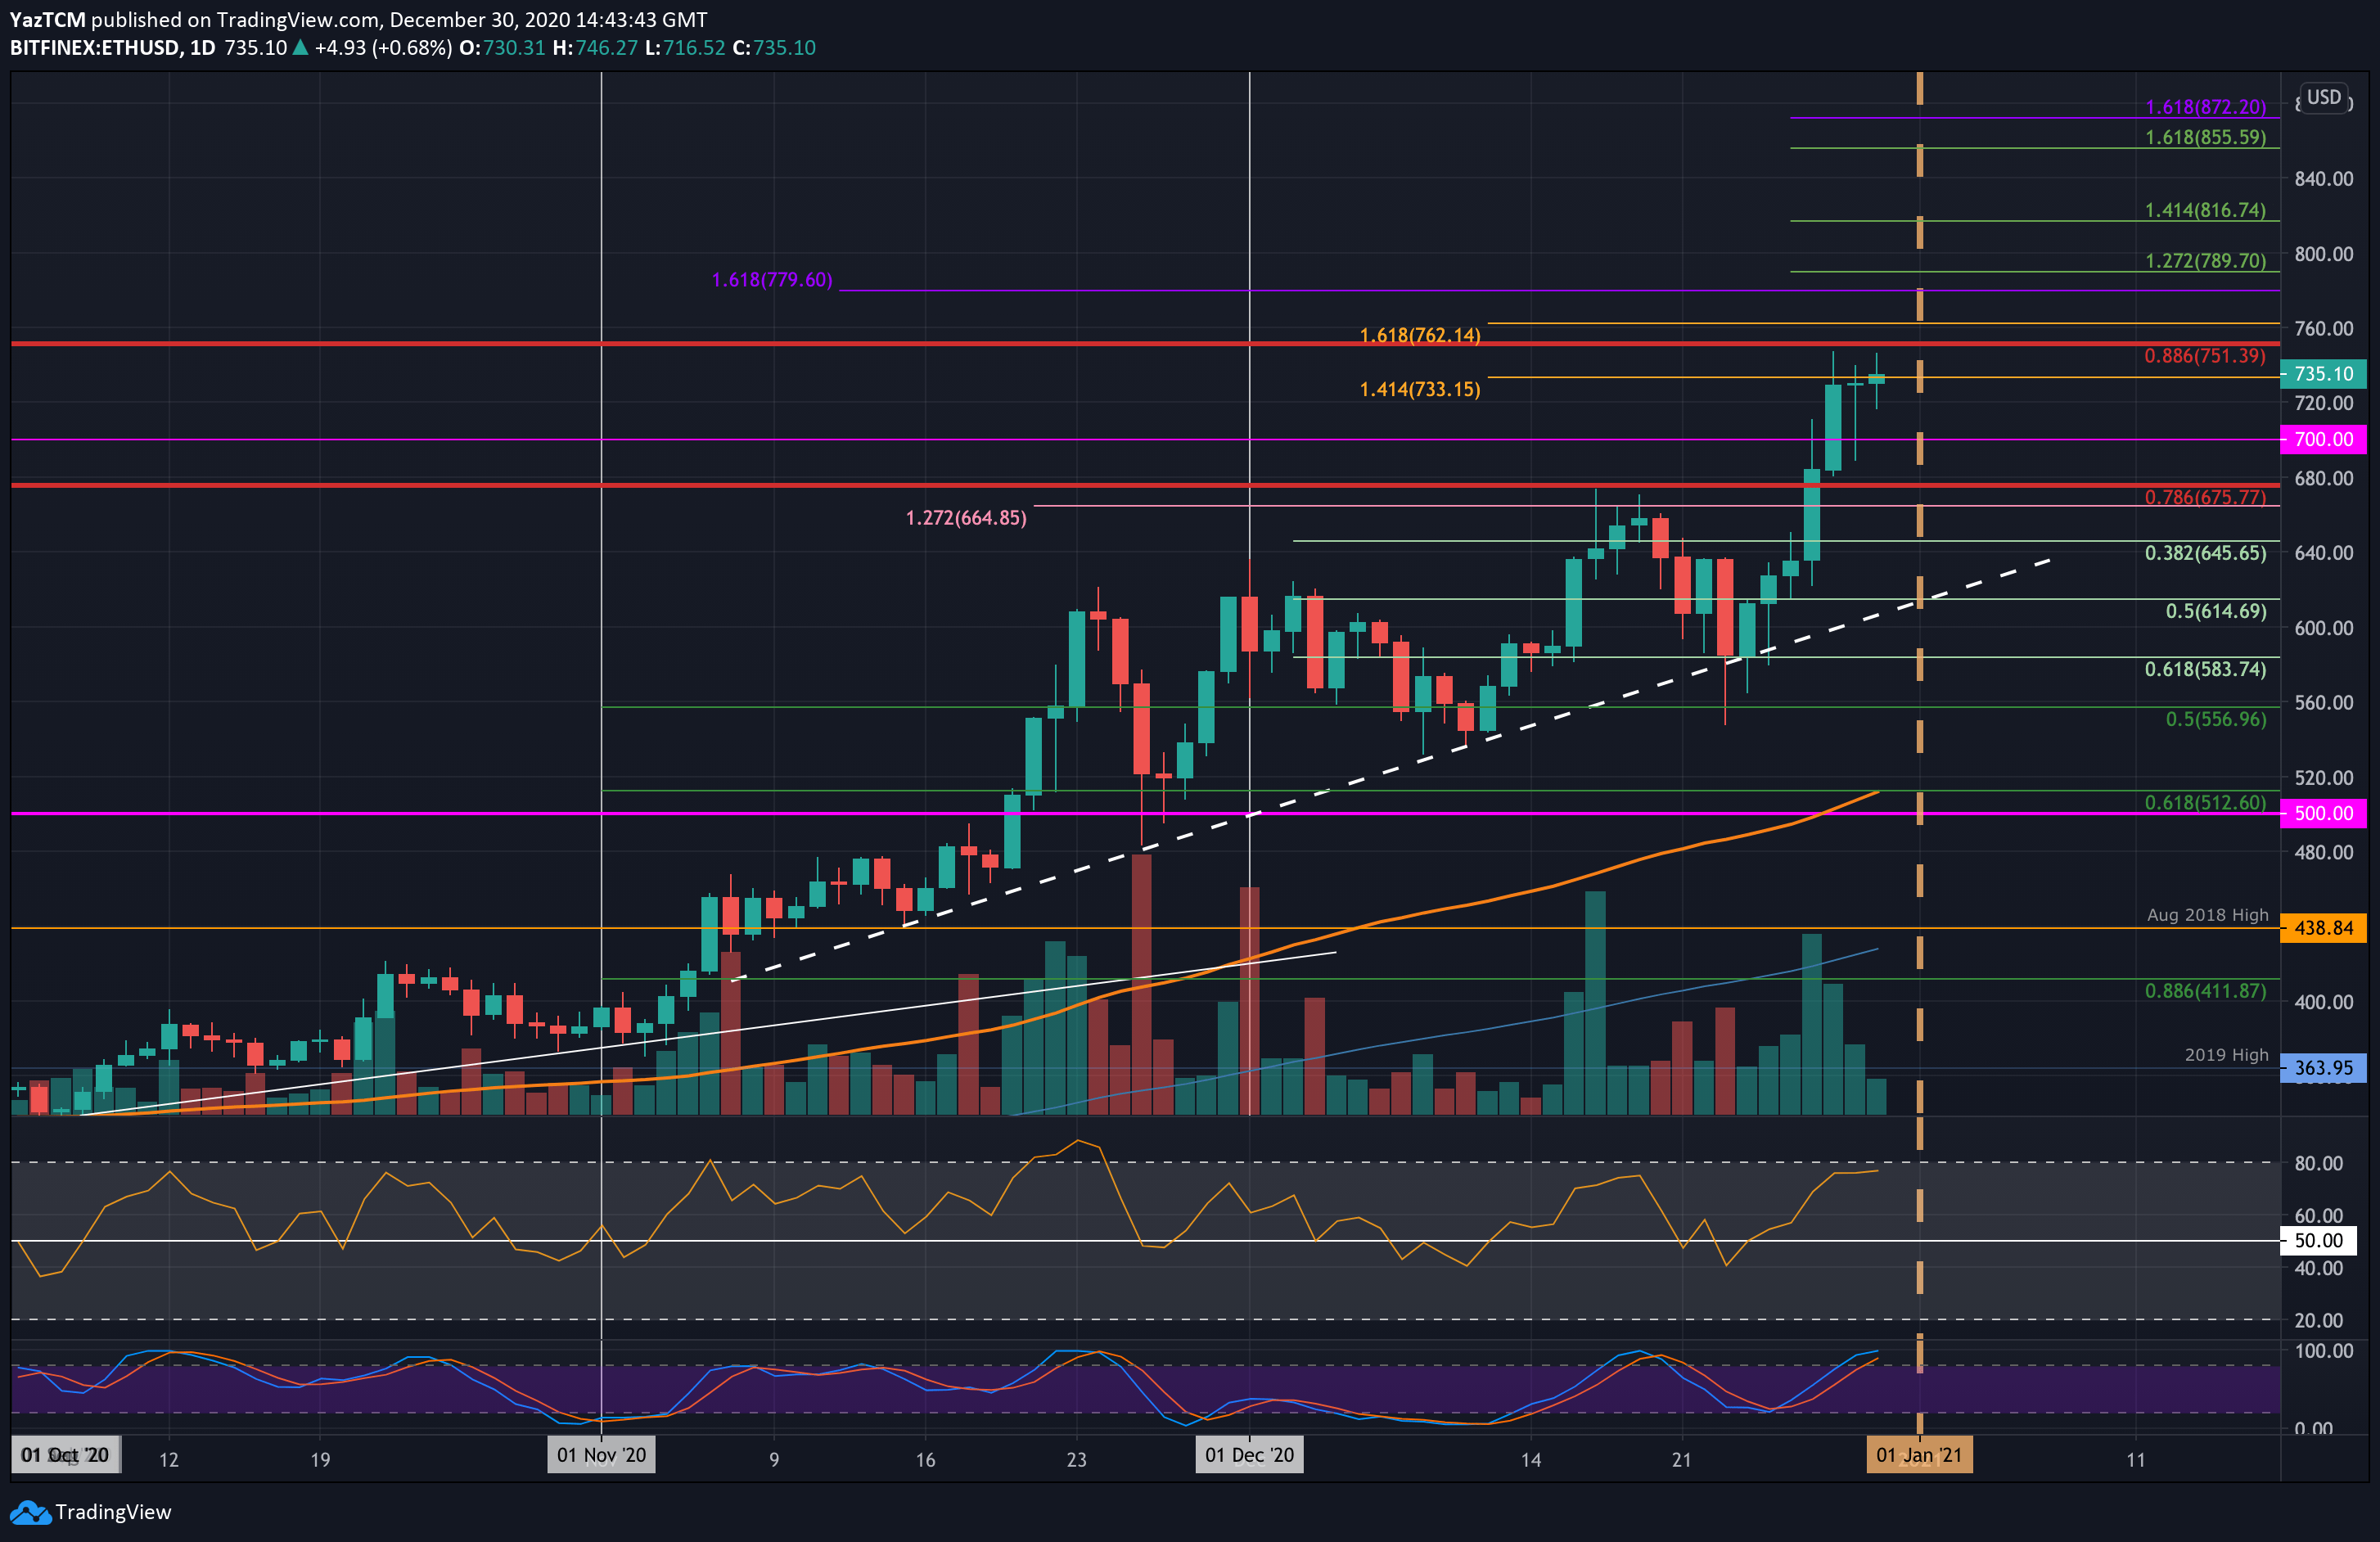
ETH-USD Short Term Price Prediction
Looking ahead, the first level of resistance lies at $750 (bearish .886 Fib Retracement). This is followed by $762, $790, and $800. Beyond $800, additional resistance lies at $816 and $855.
Alternatively, if the sellers push lower, the first level of support lies at $720. This is followed by $700, $675, and $645 (.382 Fib).
The RSI is approaching overbought conditions and is starting to flatten out, suggesting that the bullish momentum might be ready to subside. Additionally, the Stochastic RSI is setting up a bearish crossover signal that could send the market lower.
ETH/BTC – ETH Rebound Stalls At 0.027 BTC.
Key Support Levels: 0.026 BTC, 0.0251 BTC, 0.0245 BTC.
Key Resistance Levels: 0.027 BTC, 0.0276 BTC 0.0284 BTC.
Against Bitcoin, EThereum bounced from the 0.024 BTC level earlier in the week and managed to push as high as 0.027 BTC. There, it met resistance at a bearish .382 Fib Retracement and could not break above this level.
As a result, ETH dropped slightly and is now trading at 0.0261 BTC.
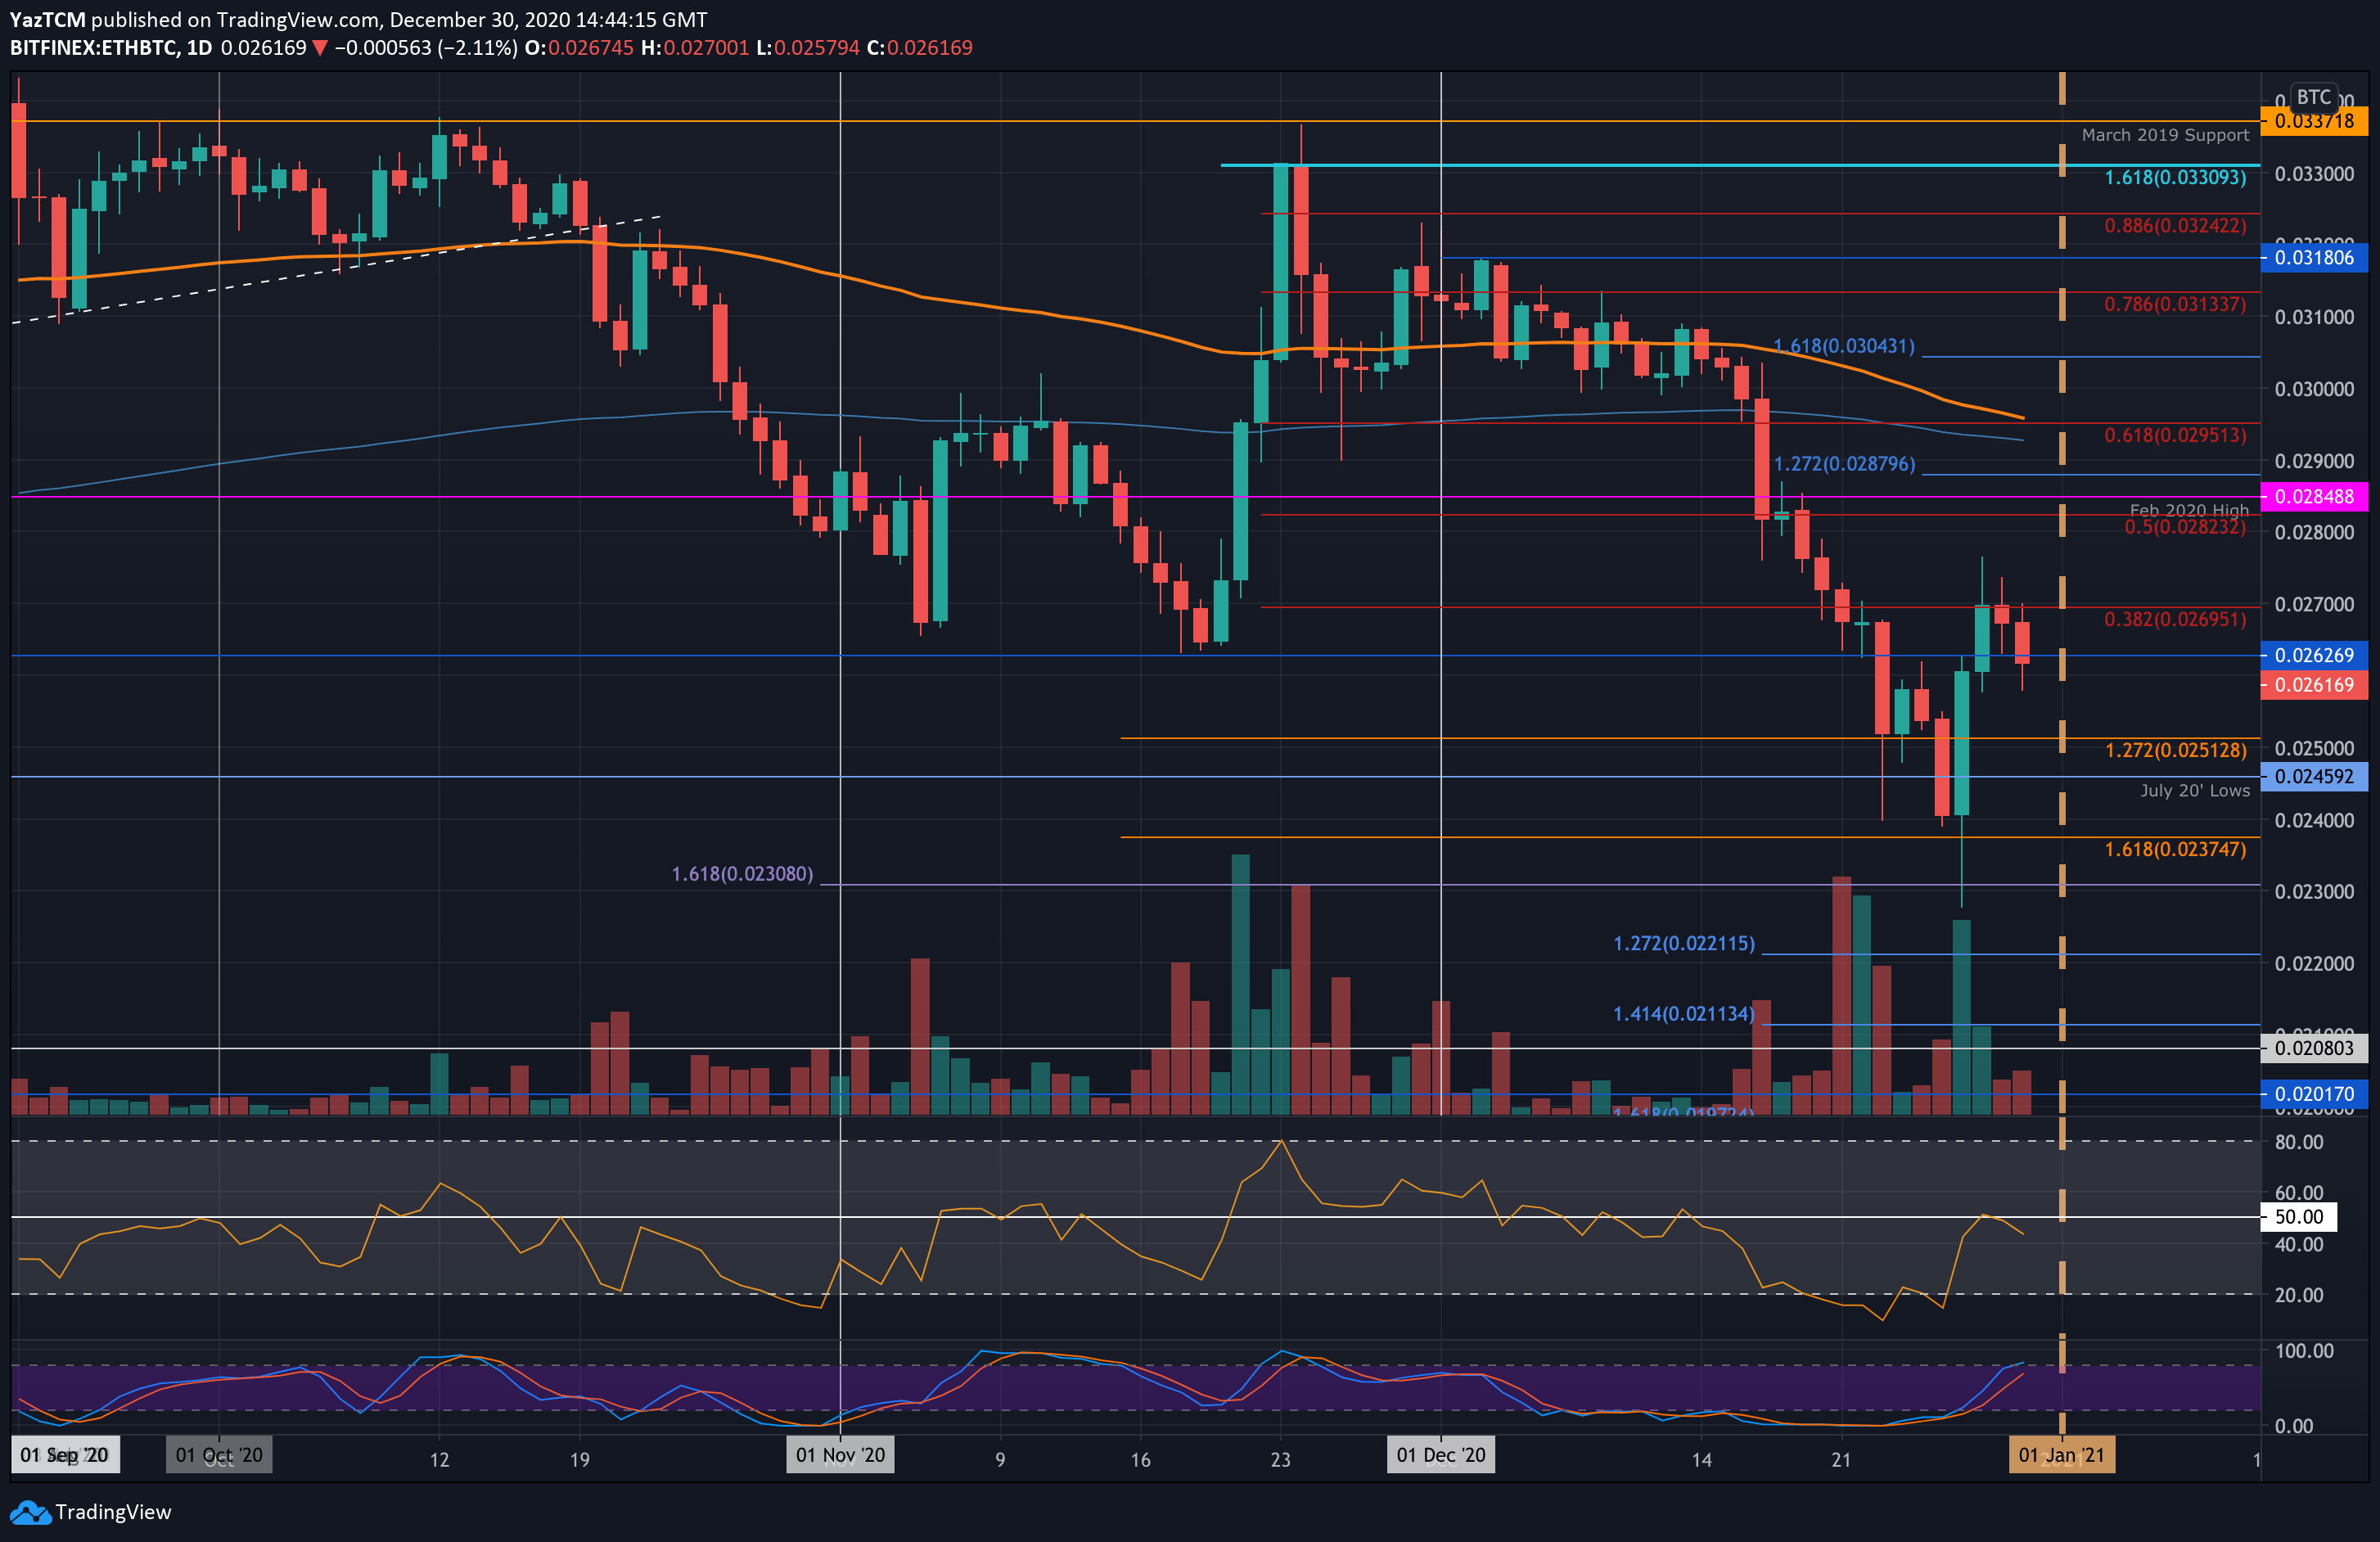
ETH-BTC Short Term Price Prediction
Looking ahead, if the bulls can regroup, the first level of resistance lies at 0.027 BTC. This is followed by resistance at 0.0276 BTC, 0.0284 BTC (Feb 2020 High), and 0.029 BTC.
On the other side, support first lies at 0.026 BTC. This is followed by 0.0251 BTC, 0.0245 BTC (July 2020 lows), and 0.024 BTC.
The RSI has reversed from the mid-line to indicate that the bulls could not take control of the market momentum. It is heading lower to suggest that the bearish momentum is once again increasing. Again, the Stochastic RSI is also shaping up for a bearish crossover signal in the coming week.