This week, we take a closer look at Ethereum, Cardano, Ripple, Solana, and Luna. Ethereum (ETH) On Tuesday, Ethereum fell below ,000 (level acting as resistance right now) after it could not sustain its rally from the previous week. The price made a lower low and closed the past seven days in red with an 8% loss. The current price action has formed a large descending wedge (in blue) which is a bullish formation as long as the price can manage to break above it after the correction is completed. This possibility is also confirmed by the MACD histogram that on the daily timeframe has been making higher lows, suggesting a bullish divergence is materializing as the price is moving within the wedge limits. Looking ahead, it is unlikely for ETH to leave the wedge any time
Topics:
Duo Nine considers the following as important: ADABTC, ADAUSD, Cardano (ADA) Price, ETH Analysis, ETHBTC, Ethereum (ETH) Price, ethusd, Price Analysis, Ripple (XRP) Price, Solana (SOL) Price, SOLBTC, SOLUSD, Terra (LUNA), XRP Analysis, xrpbtc, xrpusd
This could be interesting, too:
CryptoVizArt writes Ethereum Price Analysis: Following a 15% Weekly Crash, What’s Next for ETH?
Jordan Lyanchev writes Ripple, Dogecoin Whales Bought the Dip as XRP, DOGE Prices Soar
Jordan Lyanchev writes Why Did Ripple’s (XRP) Price Crash by 18% in 36 Hours?
Mandy Williams writes BTC at 0K, ETH to K, and More: Here’s VanEck’s Top Crypto Predictions for 2025
This week, we take a closer look at Ethereum, Cardano, Ripple, Solana, and Luna.
Ethereum (ETH)
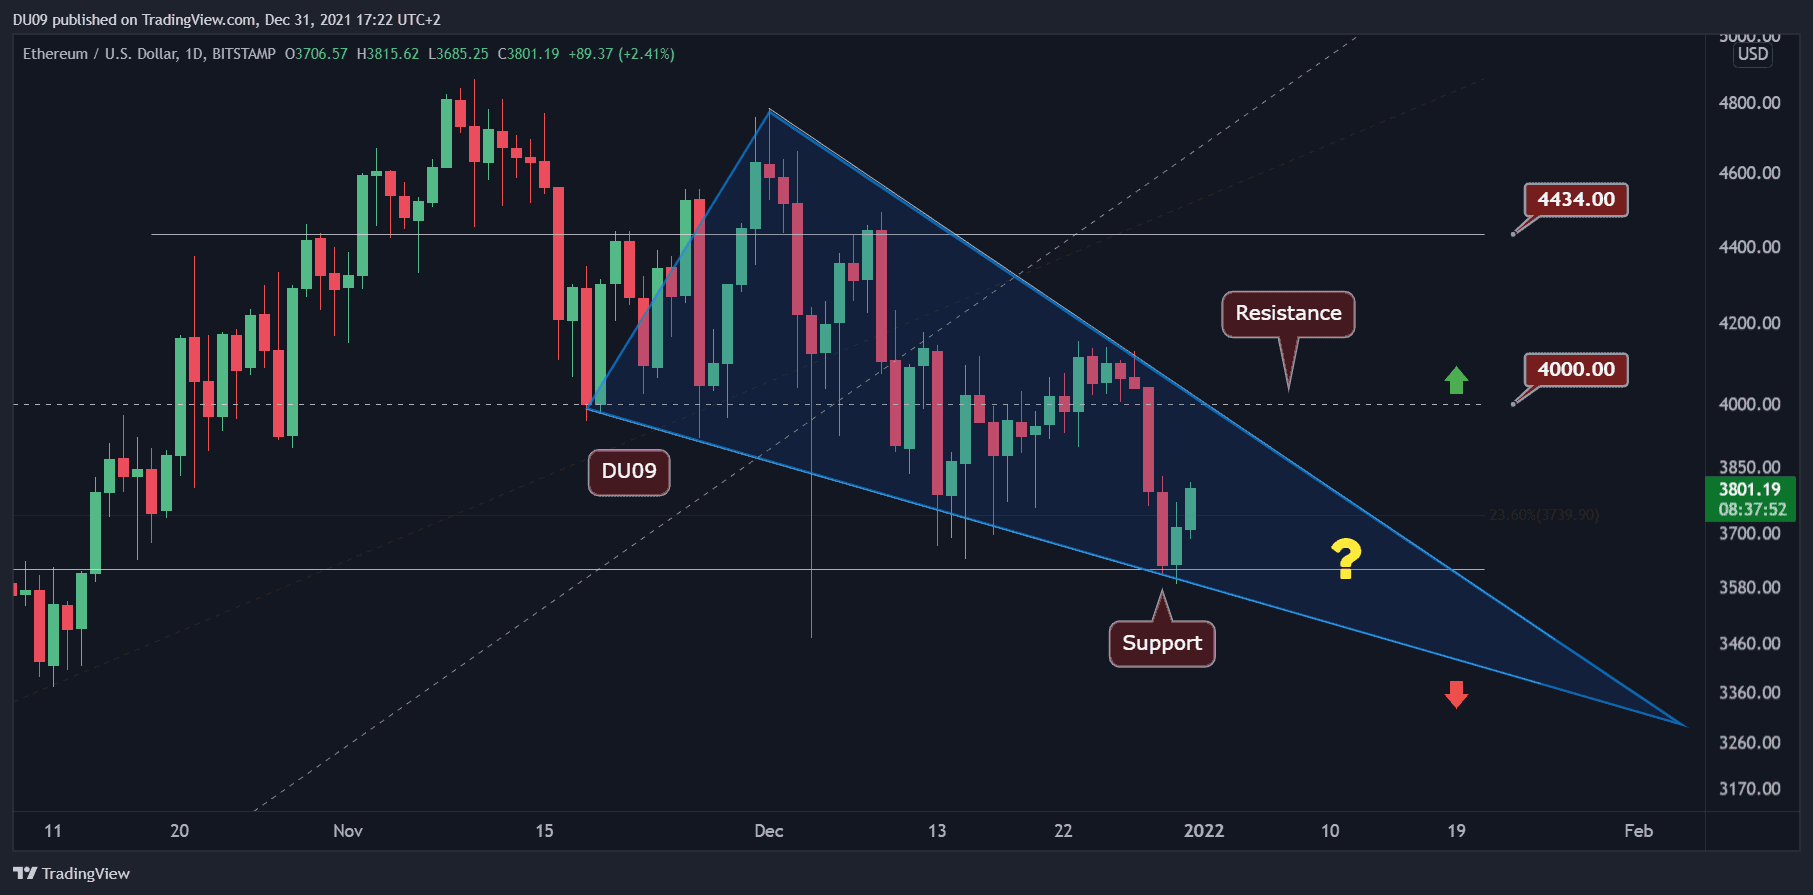
On Tuesday, Ethereum fell below $4,000 (level acting as resistance right now) after it could not sustain its rally from the previous week. The price made a lower low and closed the past seven days in red with an 8% loss.
The current price action has formed a large descending wedge (in blue) which is a bullish formation as long as the price can manage to break above it after the correction is completed. This possibility is also confirmed by the MACD histogram that on the daily timeframe has been making higher lows, suggesting a bullish divergence is materializing as the price is moving within the wedge limits.
Looking ahead, it is unlikely for ETH to leave the wedge any time soon and if the correction continues, the cryptocurrency may even reach $3,300 before a potential breakout. The current support at $3,600 has held well so far, but the price has been making lower lows and lower highs, indicating a bearish trend. If ETH can close a daily candle above the wedge, then it has a good chance to return on the uptrend.
Cardano (ADA)
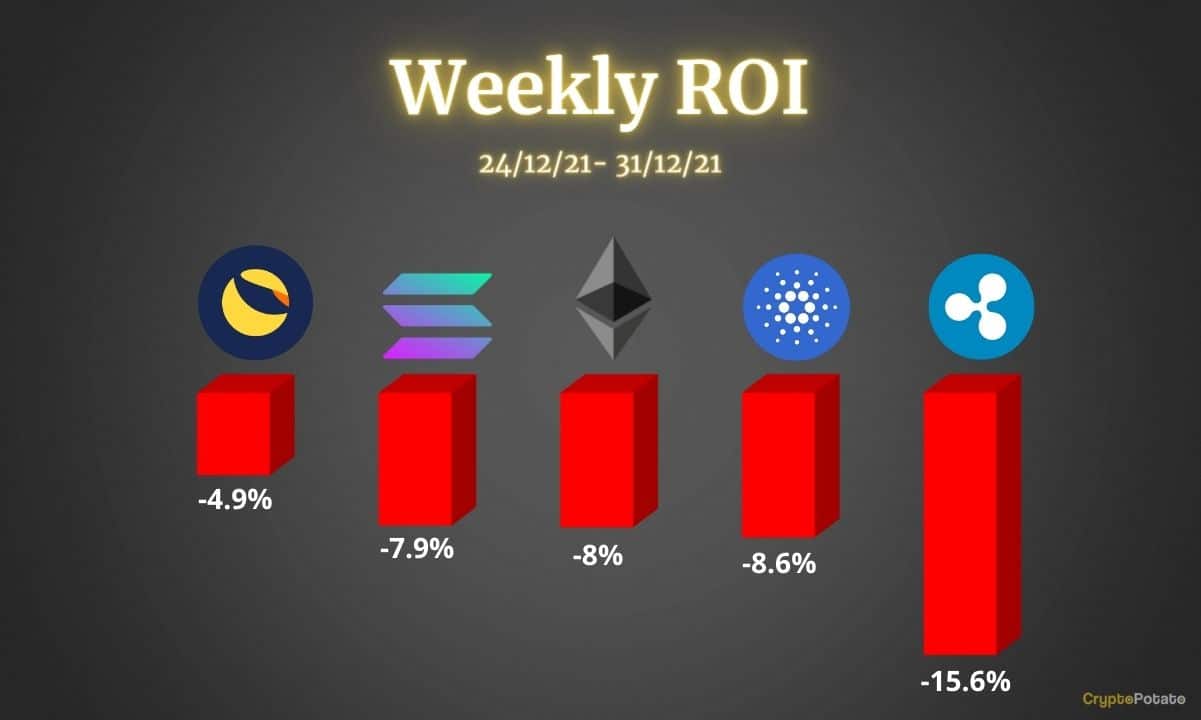
ADA failed to move above $1.5 which is currently acting as resistance after a sustained rally from the $1.2 support level. This most recent rejection led to a loss of 8.6% in the past seven days.
The biggest challenge for ADA is to move back above the trendline that has been held since March 2020 and was lost on December 9th. ADA tried to get back above this key trendline on three occasions, but each time it got rejected – most recently on Tuesday.
ADA is currently in a downtrend and may retest the key support level in the coming week. Its volume shows the interest is high and until a breakout takes place, the price is likely to be stuck in a range between $1.5 and $1.2.

Ripple (XRP)
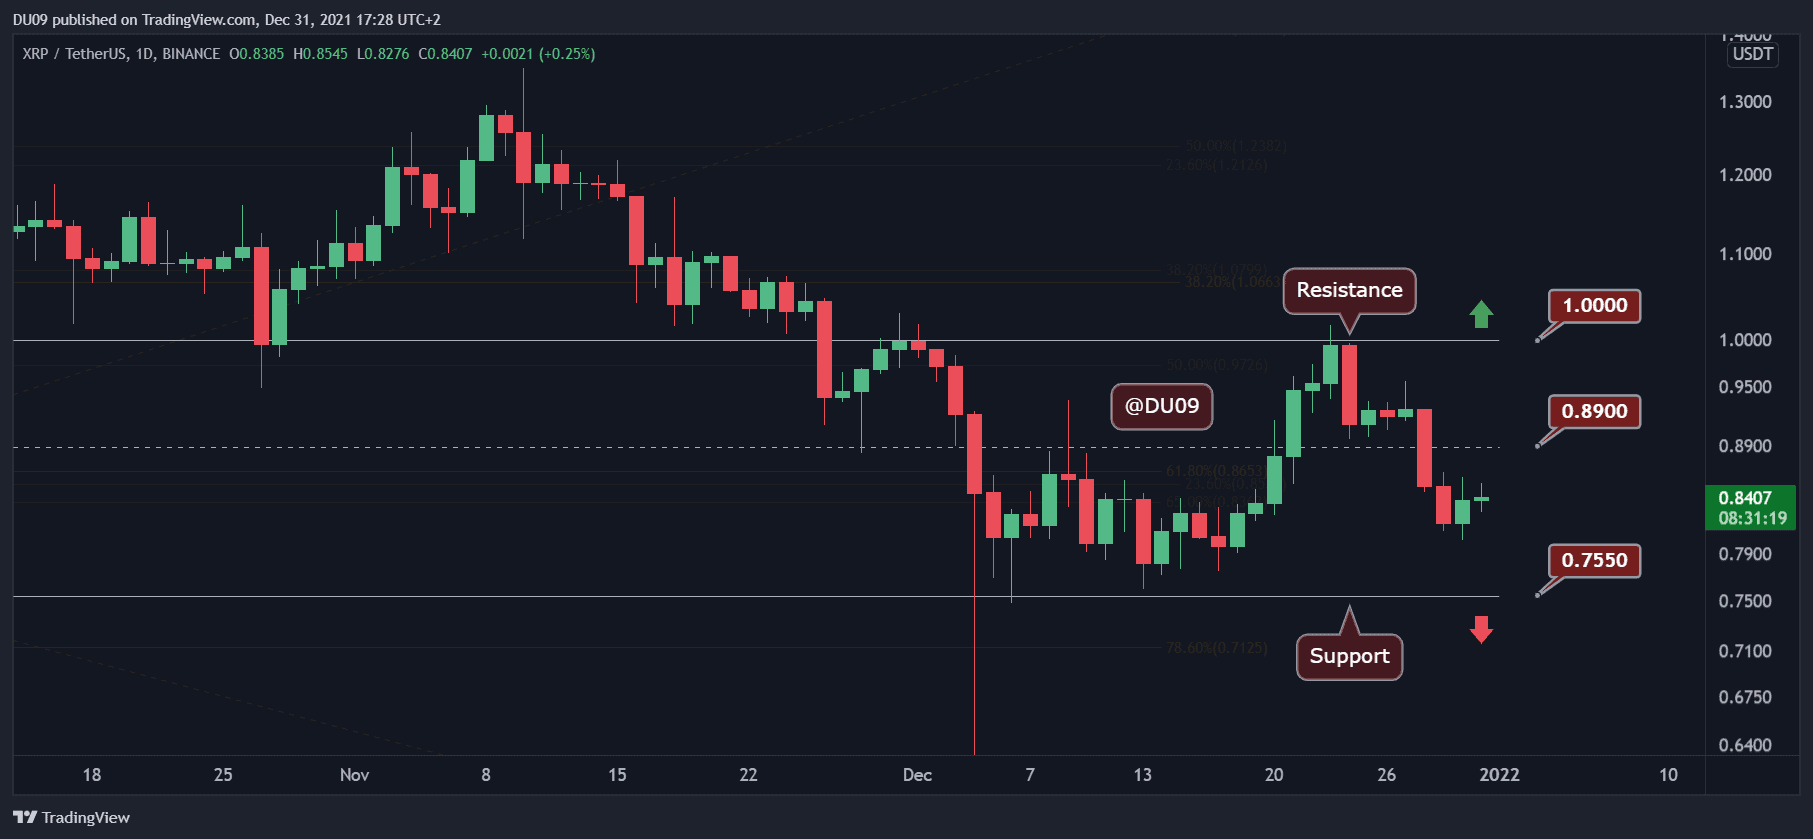
XRP had a tough week after being rejected by the $1 resistance level. This caused it to lose most of the gains made in the previous week, closing the last seven days in red with a 15.6% loss in price. The current support is found at $0.75 and should provide a good defense zone for buyers.
Due to the decline, the indicators have turned bearish with the daily MACD completing a bearish cross today and the RSI falling under 50 points. Nevertheless, the RSI managed to complete a higher low, despite the correction. Therefore, the bulls have a good chance to reverse the downtrend soon and attempt another attempt towards the $1 resistance.
Looking ahead, if XRP can stop the downtrend in the coming week, then buyers may come back to propel the price towards the key resistance which so far has proven quite challenging.
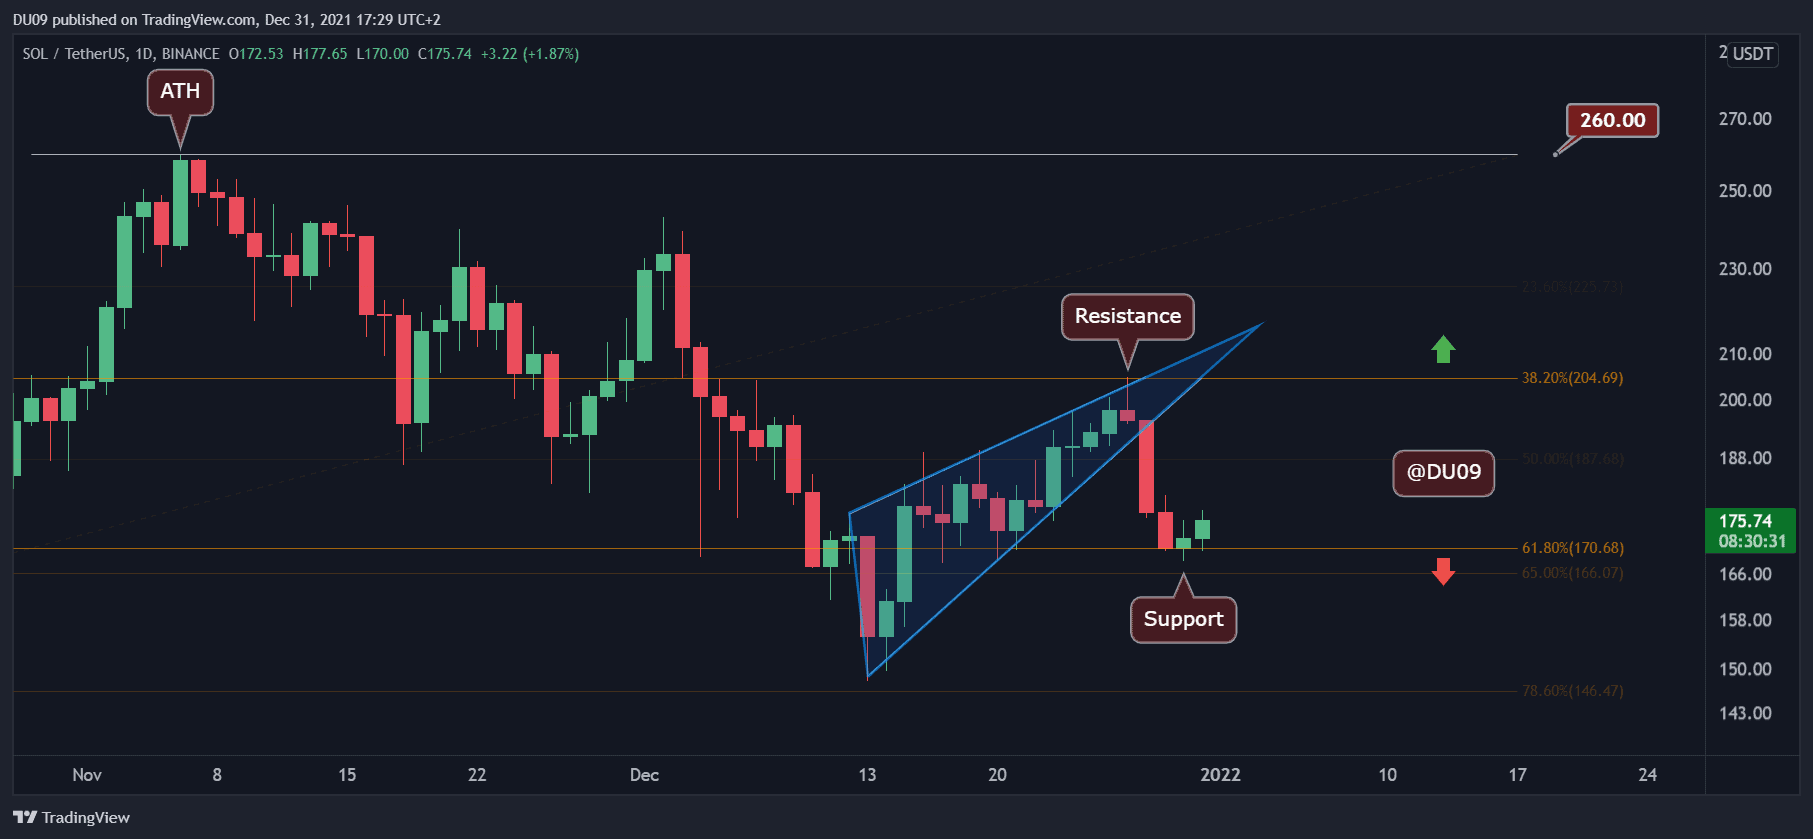
Solana (SOL)
SOL’s rally came to an end on Tuesday when the overall market turned around. The price fell below the ascending wedge in blue (which was a bearish formation) and stopped on the $170 support, thus losing 7.9% in the past seven days.
The cryptocurrency failed to sustain its rally from the previous week and the resistance at $205 proved too difficult to break on a first attempt. The price is currently consolidating just above the current support level and if SOL can stop the downtrend here, then it has a good chance to recover next week.
If buyers return to SOL, then it may attempt a new break of the key resistance at $205. Until then, its price is likely to remain in a range between $205 and $170.
Luna
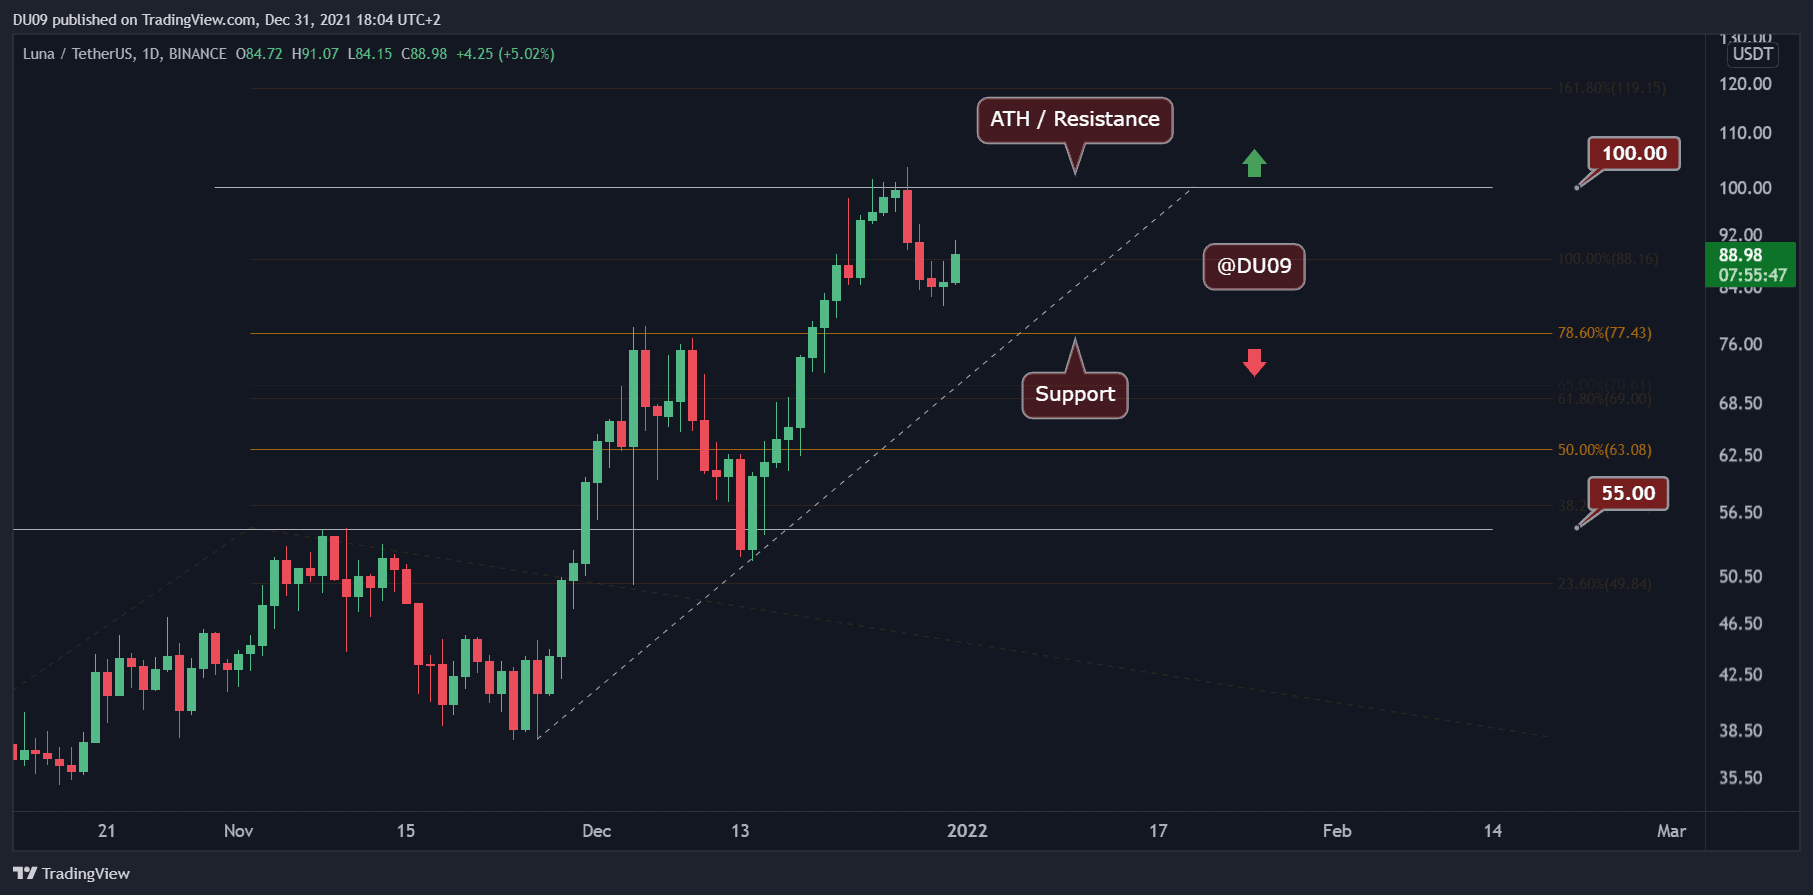
After setting an all-time high last week at just over $100, Luna entered a correction and closed the last seven days in red with a 4.9% decline.
The current support for Luna is found at $78 and the price is likely to retest this area before any hope of a renewed uptrend. The resistance at $100 proved to be too hard to break as sellers took profit at this key psychological level.
Looking ahead, Luna’s indicators on a daily timeframe turned bearish after the rejection at the key resistance. For this reason, the price correction may take some time to complete, despite the bullish fundamentals behind the Terra – Luna ecosystem.