Key Support level: ,354 Key Resistance level: ,075 The momentum behind ETH remains very strong, which has pushed prices higher and higher. The expectation to see ETH at ,000 is on everyone’s mind, and this price level is less than 5% from the current all-time high. This should be an easy target to reach for ETH considering the price action. However, there are a few warning signs that the bears may prepare a trap for the bulls as they push the price to the current resistance at ,075. The bearish divergence forming on MACD and RSI seems to indicate that once ETH hits ,000, the bears can jump in and pull it down in a more significant correction that can retest the current support at ,354. Chart by TradingViewETH Price Technical Indicators Trading Volume: Sustained
Topics:
Duo Nine considers the following as important: ETH Analysis, ETHBTC, Ethereum (ETH) Price, ethusd
This could be interesting, too:
CryptoVizArt writes Will Weak Momentum Drive ETH to .5K? (Ethereum Price Analysis)
Jordan Lyanchev writes Bybit Hack Fallout: Arthur Hayes, Samson Mow Push for Ethereum Rollback
Mandy Williams writes Ethereum Key Metrics Point to Persistent Bullish Outlook for ETH: CryptoQuant
CryptoVizArt writes Ethereum Price Analysis: Following a 15% Weekly Crash, What’s Next for ETH?
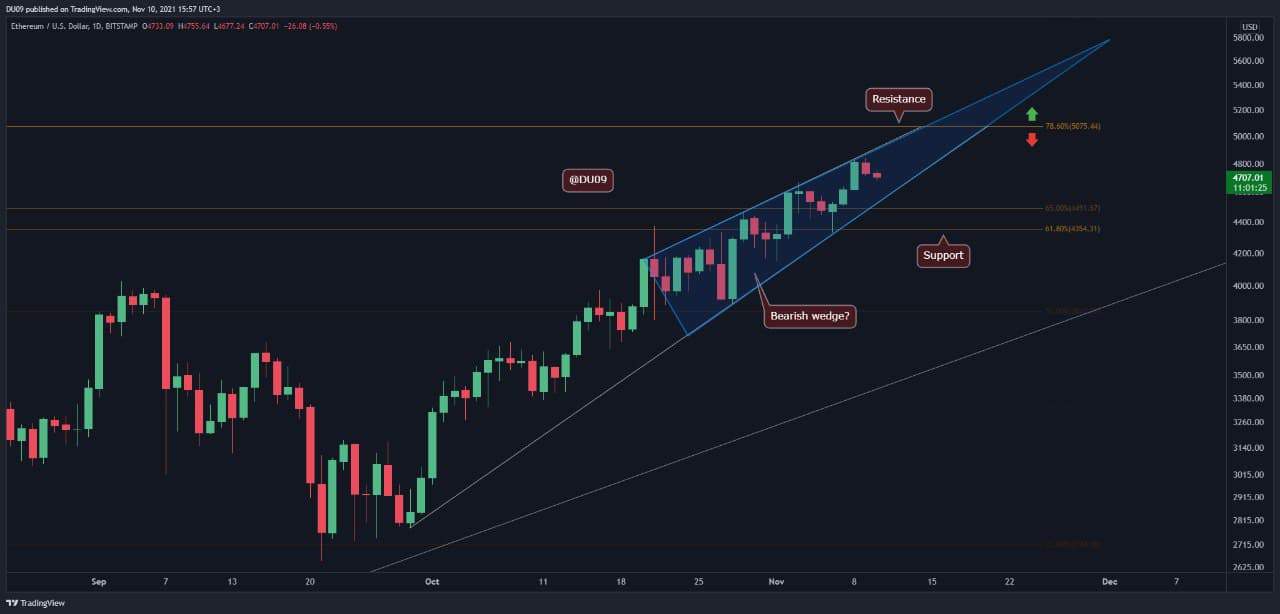
Key Support level: $4,354
Key Resistance level: $5,075
The momentum behind ETH remains very strong, which has pushed prices higher and higher. The expectation to see ETH at $5,000 is on everyone’s mind, and this price level is less than 5% from the current all-time high. This should be an easy target to reach for ETH considering the price action.
However, there are a few warning signs that the bears may prepare a trap for the bulls as they push the price to the current resistance at $5,075.
The bearish divergence forming on MACD and RSI seems to indicate that once ETH hits $5,000, the bears can jump in and pull it down in a more significant correction that can retest the current support at $4,354.
ETH Price Technical Indicators
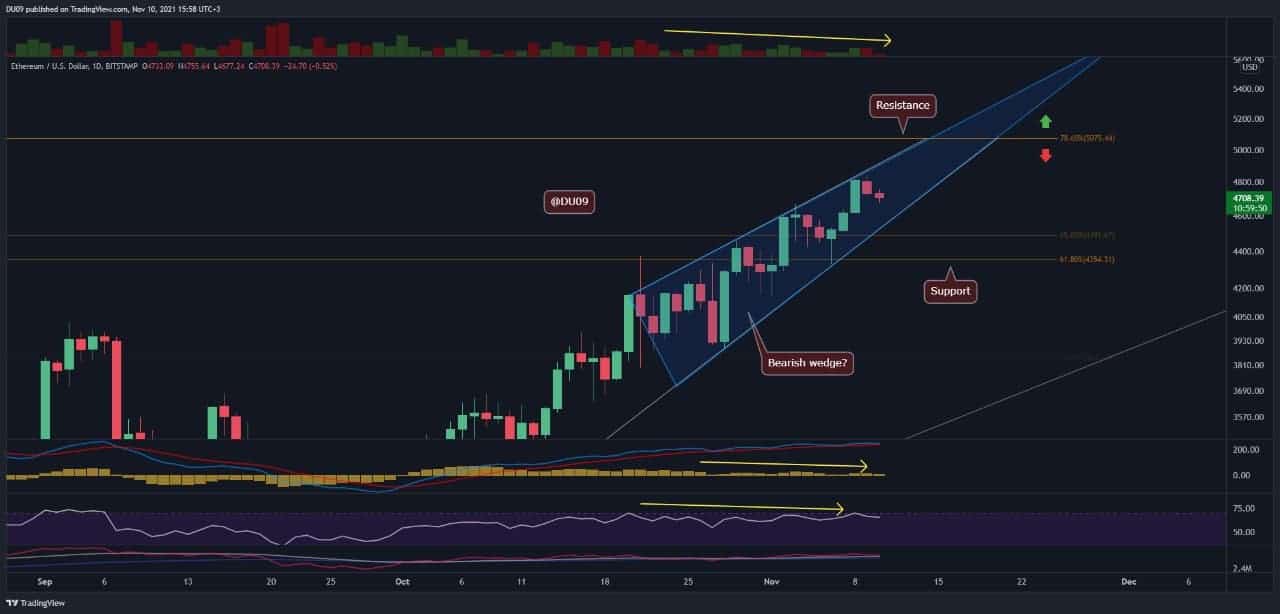
Trading Volume: Sustained volume on this move up. However, as the price is moving higher, the volume is making lower highs. This is a bearish signal.
RSI: The RSI continues to remain just under the 70 points level on the daily timeframe despite several attempts to break above. The bulls have to step up. Otherwise, the RSI is making lower highs. This is again a bearish divergence compared to price.
MACD: The MACD histogram on the daily timeframe is bullish, but the lower highs of the histogram match the volume and RSI in this regard. This is not inspiring confidence as the price moves higher.
Bias
The bias on Ethereum is bullish. However, one has to be careful because a sharp rejection at the resistance level may turn ETH bearish in the short term. The bulls have to bring more conviction in the market. Otherwise, the bears can capitalize on any signs of weakness.
Short-Term Price Prediction for ETH
ETH is on a clear path to test the $5,000 level. A failure to sustain the price above this key level by the bulls will empower the bears to take over control and push ETH lower towards the support at $4,353. The ascending wedge together with the bearish divergence on the indicators could be interpreted as an early warning that this could take place.