Ethereum Ethereum is up a solid 9% today as the cryptocurrency surges past 00 again. The coin has now broken the upper boundary of the previous range that it was trading inside over the past fortnight. The range was between 50 and 00 and Ethereum bounced from the lower boundary on Wednesday, where it found support at the 100-day MA. Since then, ETH managed to break the September descending trend line and head back above the 20-day MA. Looking ahead, the first resistance lies at 00 (50-day MA). This is followed by 50, 00, 00, and 90 (bearish .786 Fib). Added resistance lies at 00. On the other side, the first support lies at 00. This is followed by 90, 70 (.786 Fib & 100-day MA), and 20 (200-day MA). ETH/USD Daily Chart. Source:
Topics:
Yaz Sheikh considers the following as important: ADABTC, ADAUSD, Binance Coin (BNB) Price, BNBBTC, bnbusd, Cardano (ADA) Price, ETH Analysis, ETHBTC, Ethereum (ETH) Price, ethusd, Price Analysis, Ripple (XRP) Price, uniswap, UNIUSD, UNIUSDT, XRP Analysis, xrpbtc, xrpusd
This could be interesting, too:
Bitcoin Schweiz News writes SEC gibt auf: Ermittlungen gegen Crypto.com offiziell eingestellt
Jordan Lyanchev writes Ripple’s (XRP) Surge to Triggers Over Million in Short Liquidations
Jordan Lyanchev writes Cardano (ADA) Surpasses Dogecoin After 55% Surge
Jordan Lyanchev writes Trump Confirms Work on Strategic Crypto Reserve: XRP, ADA, SOL Included
Ethereum
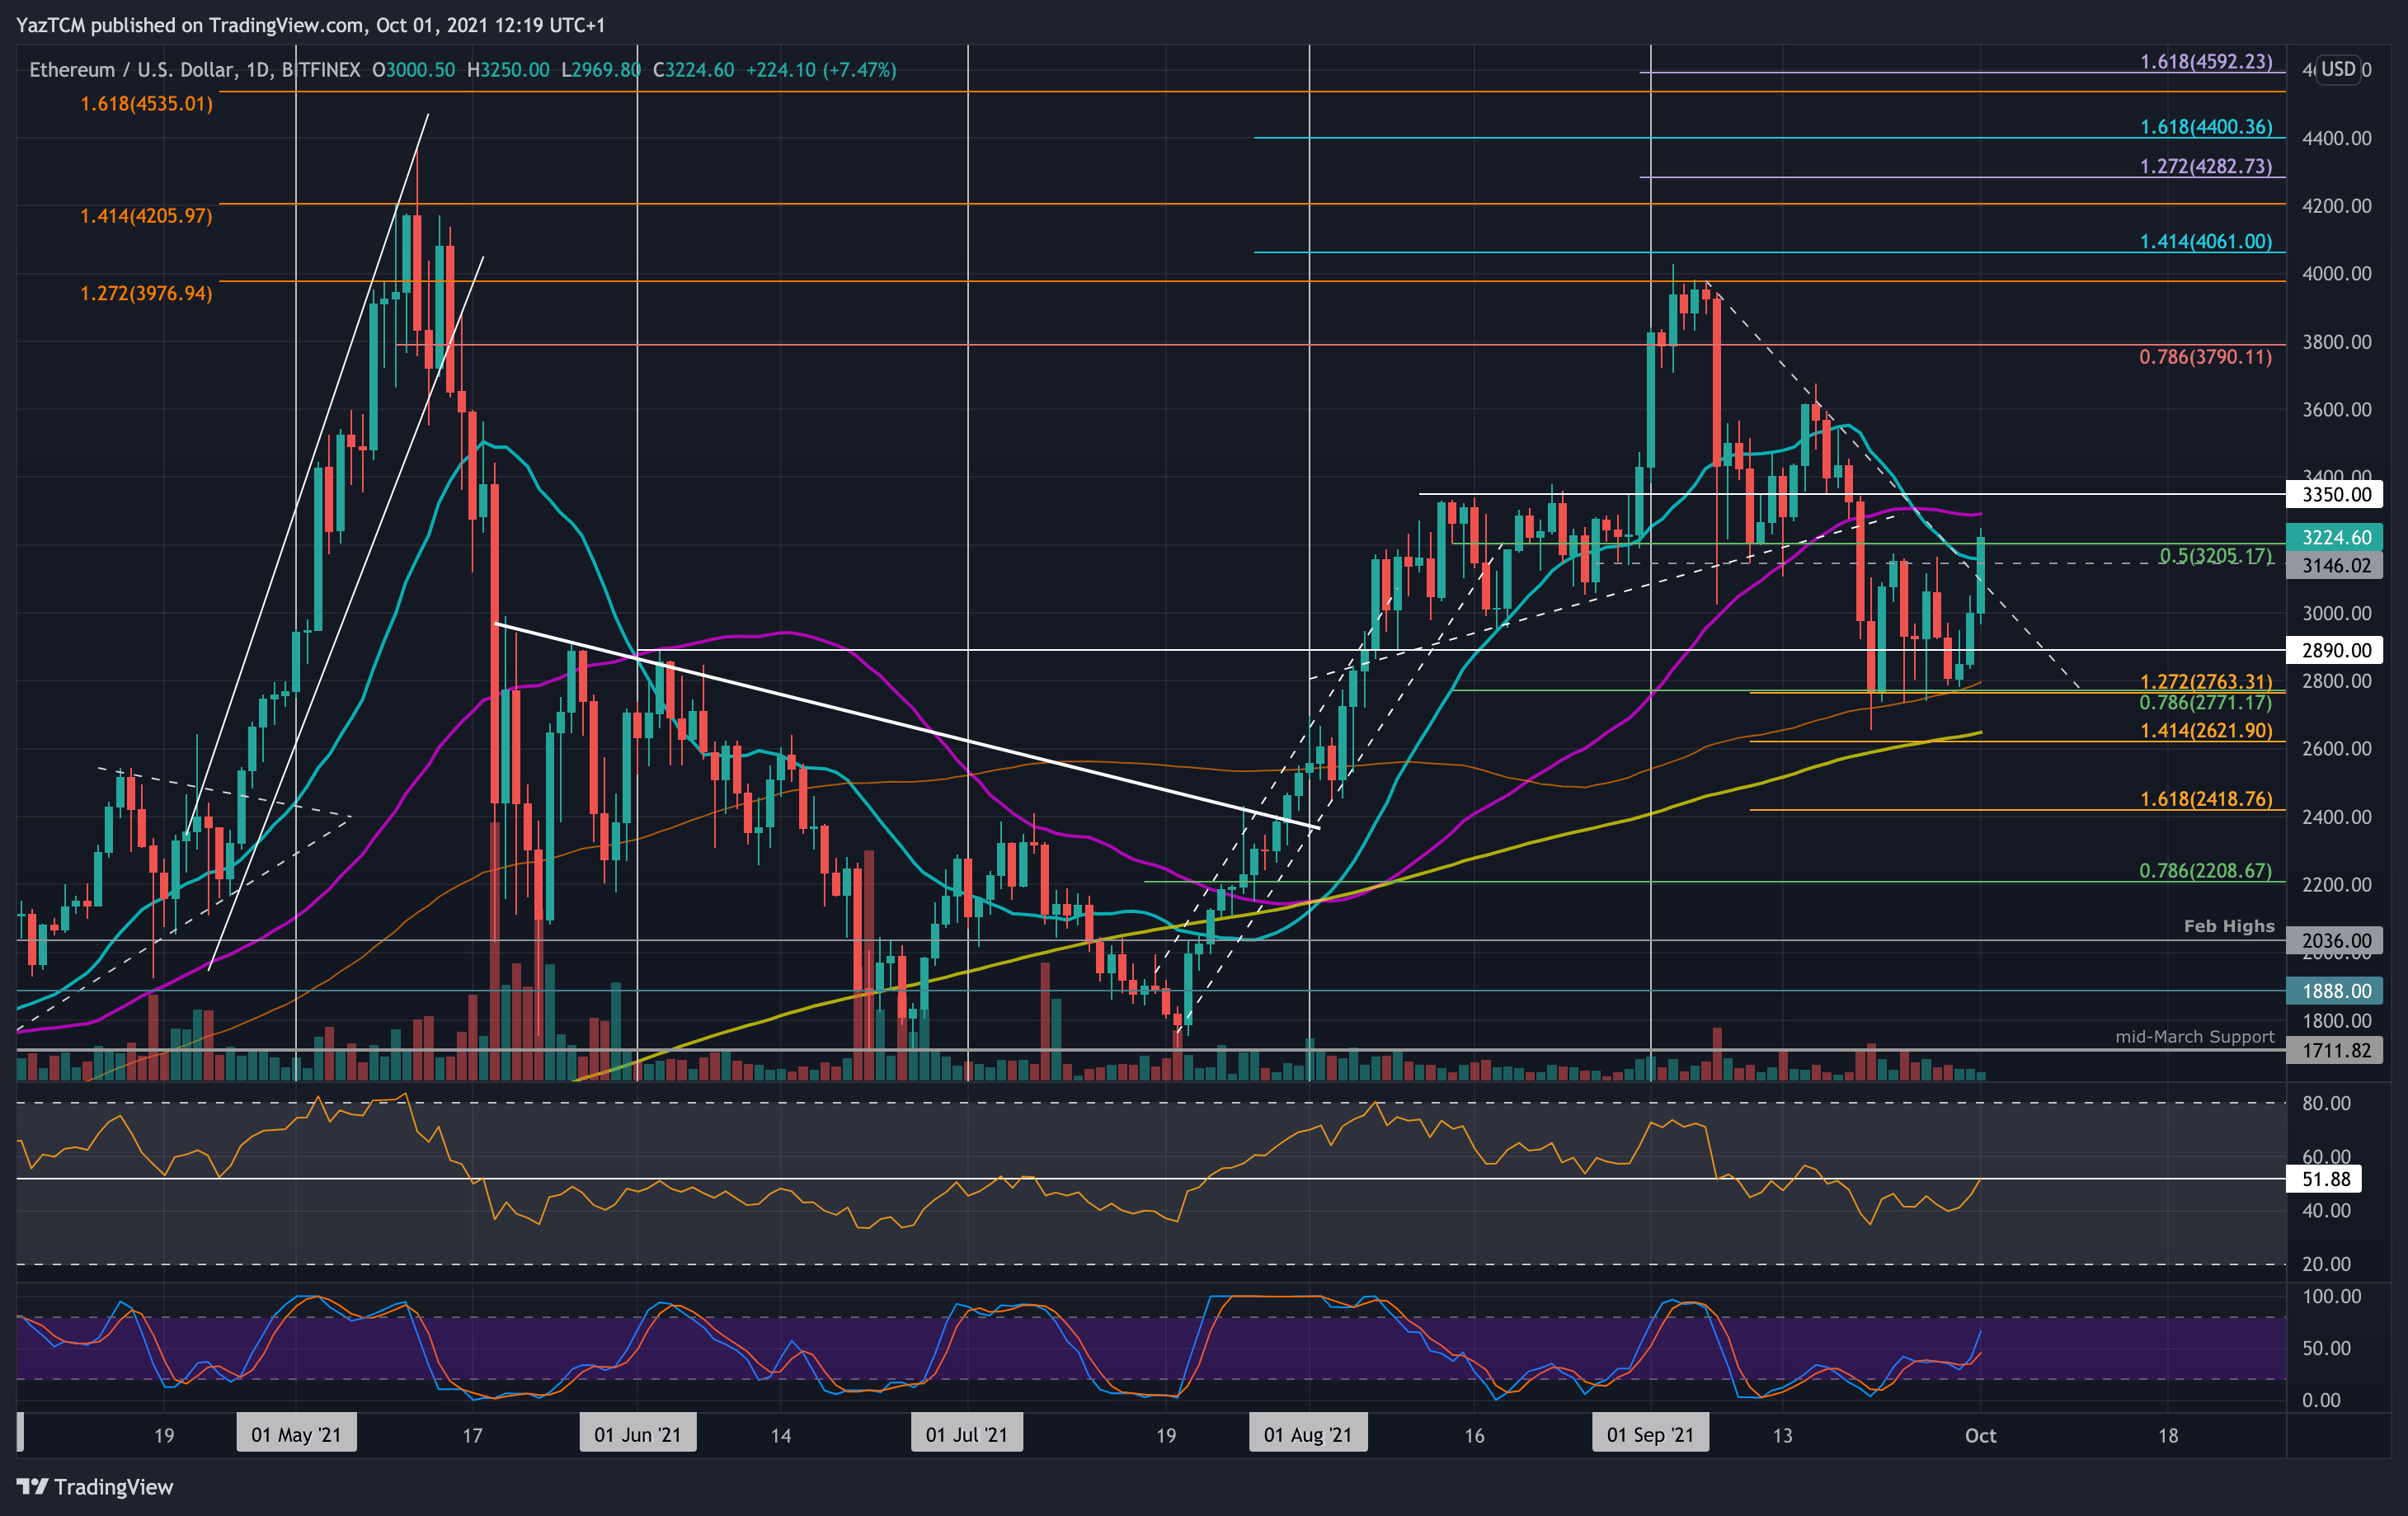
Ethereum is up a solid 9% today as the cryptocurrency surges past $3000 again. The coin has now broken the upper boundary of the previous range that it was trading inside over the past fortnight. The range was between $3150 and $2800 and Ethereum bounced from the lower boundary on Wednesday, where it found support at the 100-day MA.
Since then, ETH managed to break the September descending trend line and head back above the 20-day MA.
Looking ahead, the first resistance lies at $3300 (50-day MA). This is followed by $3350, $3500, $3600, and $3790 (bearish .786 Fib). Added resistance lies at $4000.
On the other side, the first support lies at $3000. This is followed by $2890, $2770 (.786 Fib & 100-day MA), and $2620 (200-day MA).
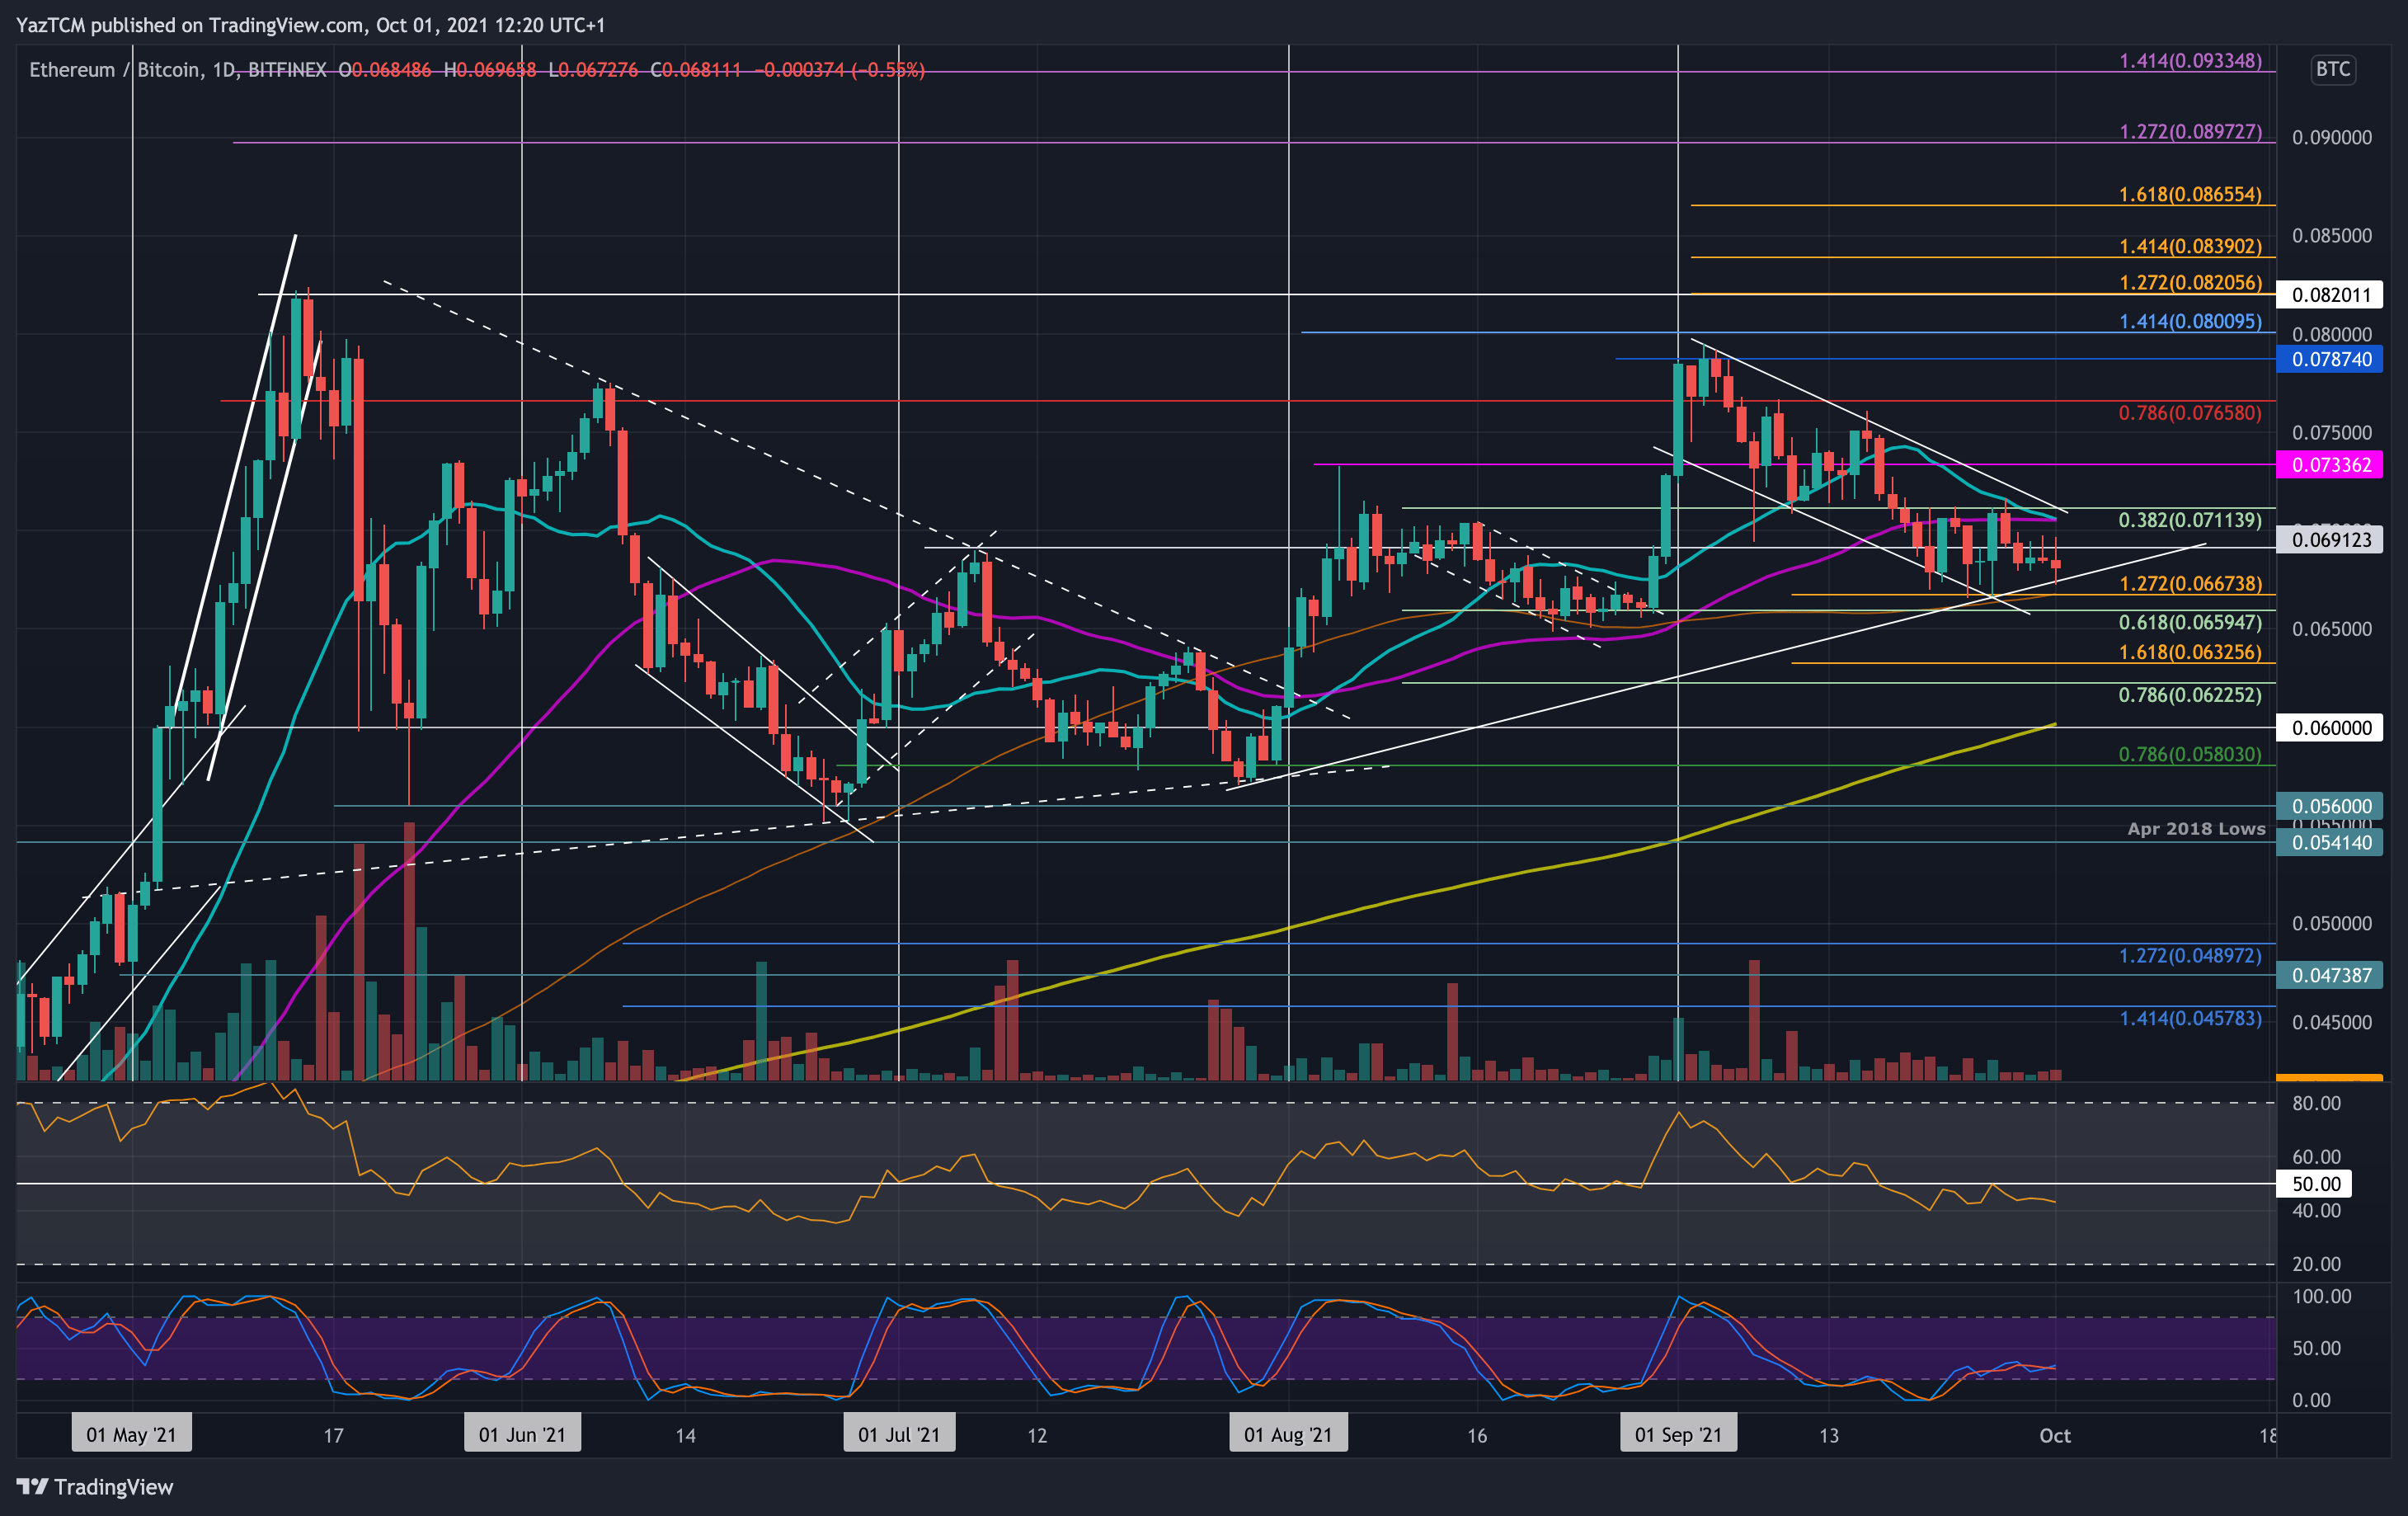
ETH continues to trade sideways against BTC as it stays within the range between 0.0711 BTC and 0.0667 BTC. The cryptocurrency attempted to break the resistance at 0.0711 BTC at the start of the week but failed to overcome the level. As a result, it fell through the week until finding the current support at the rising trend line.
ETH must break the current range against BTC to dictate the next direction for the market.
Looking ahead, the first support lies at the rising trend line. This is followed by support at the bottom of the range at 0.0667 BTC (downside 1.272 Fib Extension & 100-day MA), 0.066 BTC (.618 Fib Retracement), 0.065 BTC, and 0.0632 BTC (downside 1.618 Fib Extension).
On the other side, the first resistance lies at 0.071 BTC (50-day MA). This is followed by the upper angle of the price channel, 0.0733 BTC, 0.075 BTC, and 0.0765 BTC (beraish .786 Fib).
Ripple
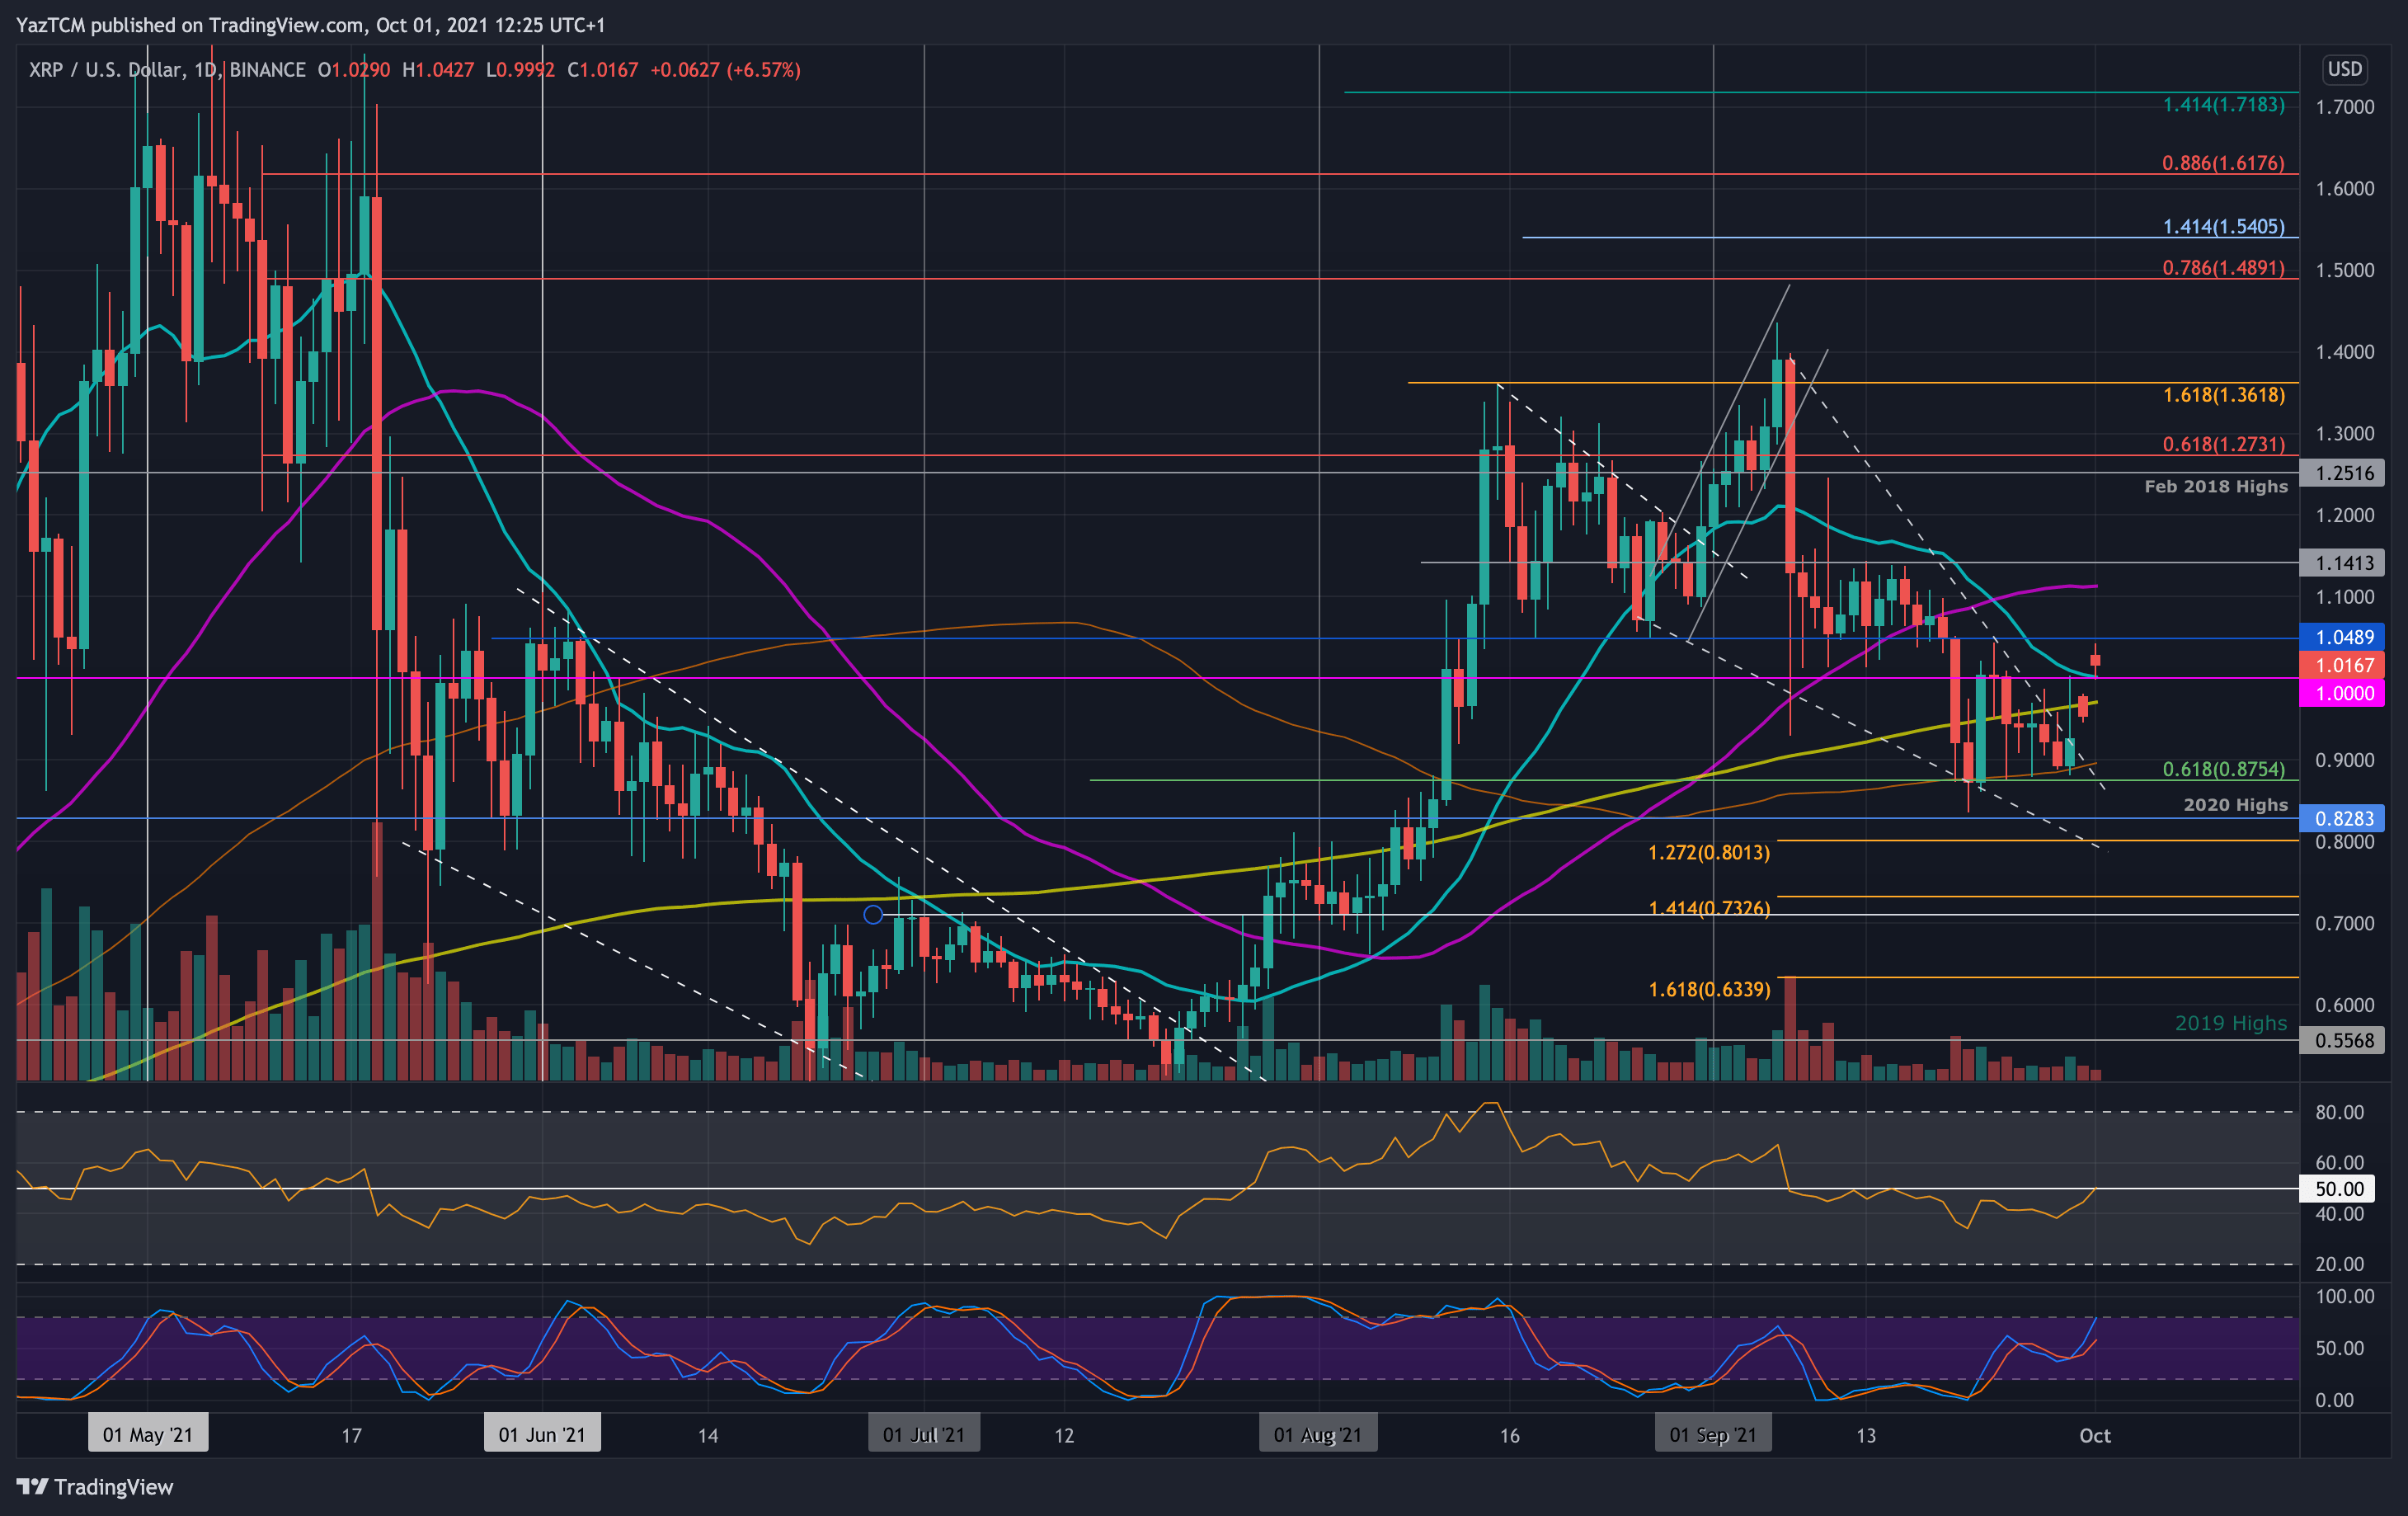
XRP surged by a strong 9% today as it breaks back above the $1 level again. The coin was trading inside a descending wedge formation for the entire period of September and only managed to break the upper angle of the wedge on Wednesday.
It had found support at $0.9, provided by a 100-day MA, which allowed the coin to rebound and surge past the upper angle of the wedge. Today, the 9% price increase allowed XRP to climb back above the 200-day MA, the 20-day MA, and $1.
Looking ahead, the first resistance lies at $1.05, which is previous strong support. Above this, resistance lies at $1.10 (50-day MA), $1.5, $1.20, and $1.25 (Feb 2018 highs).
On the other side, the first support lies at $1.00 (20-day MA). This is followed by $0.96 (200-day MA)m $0.9 (100-day MA), and $0.8282 (2020 highs).
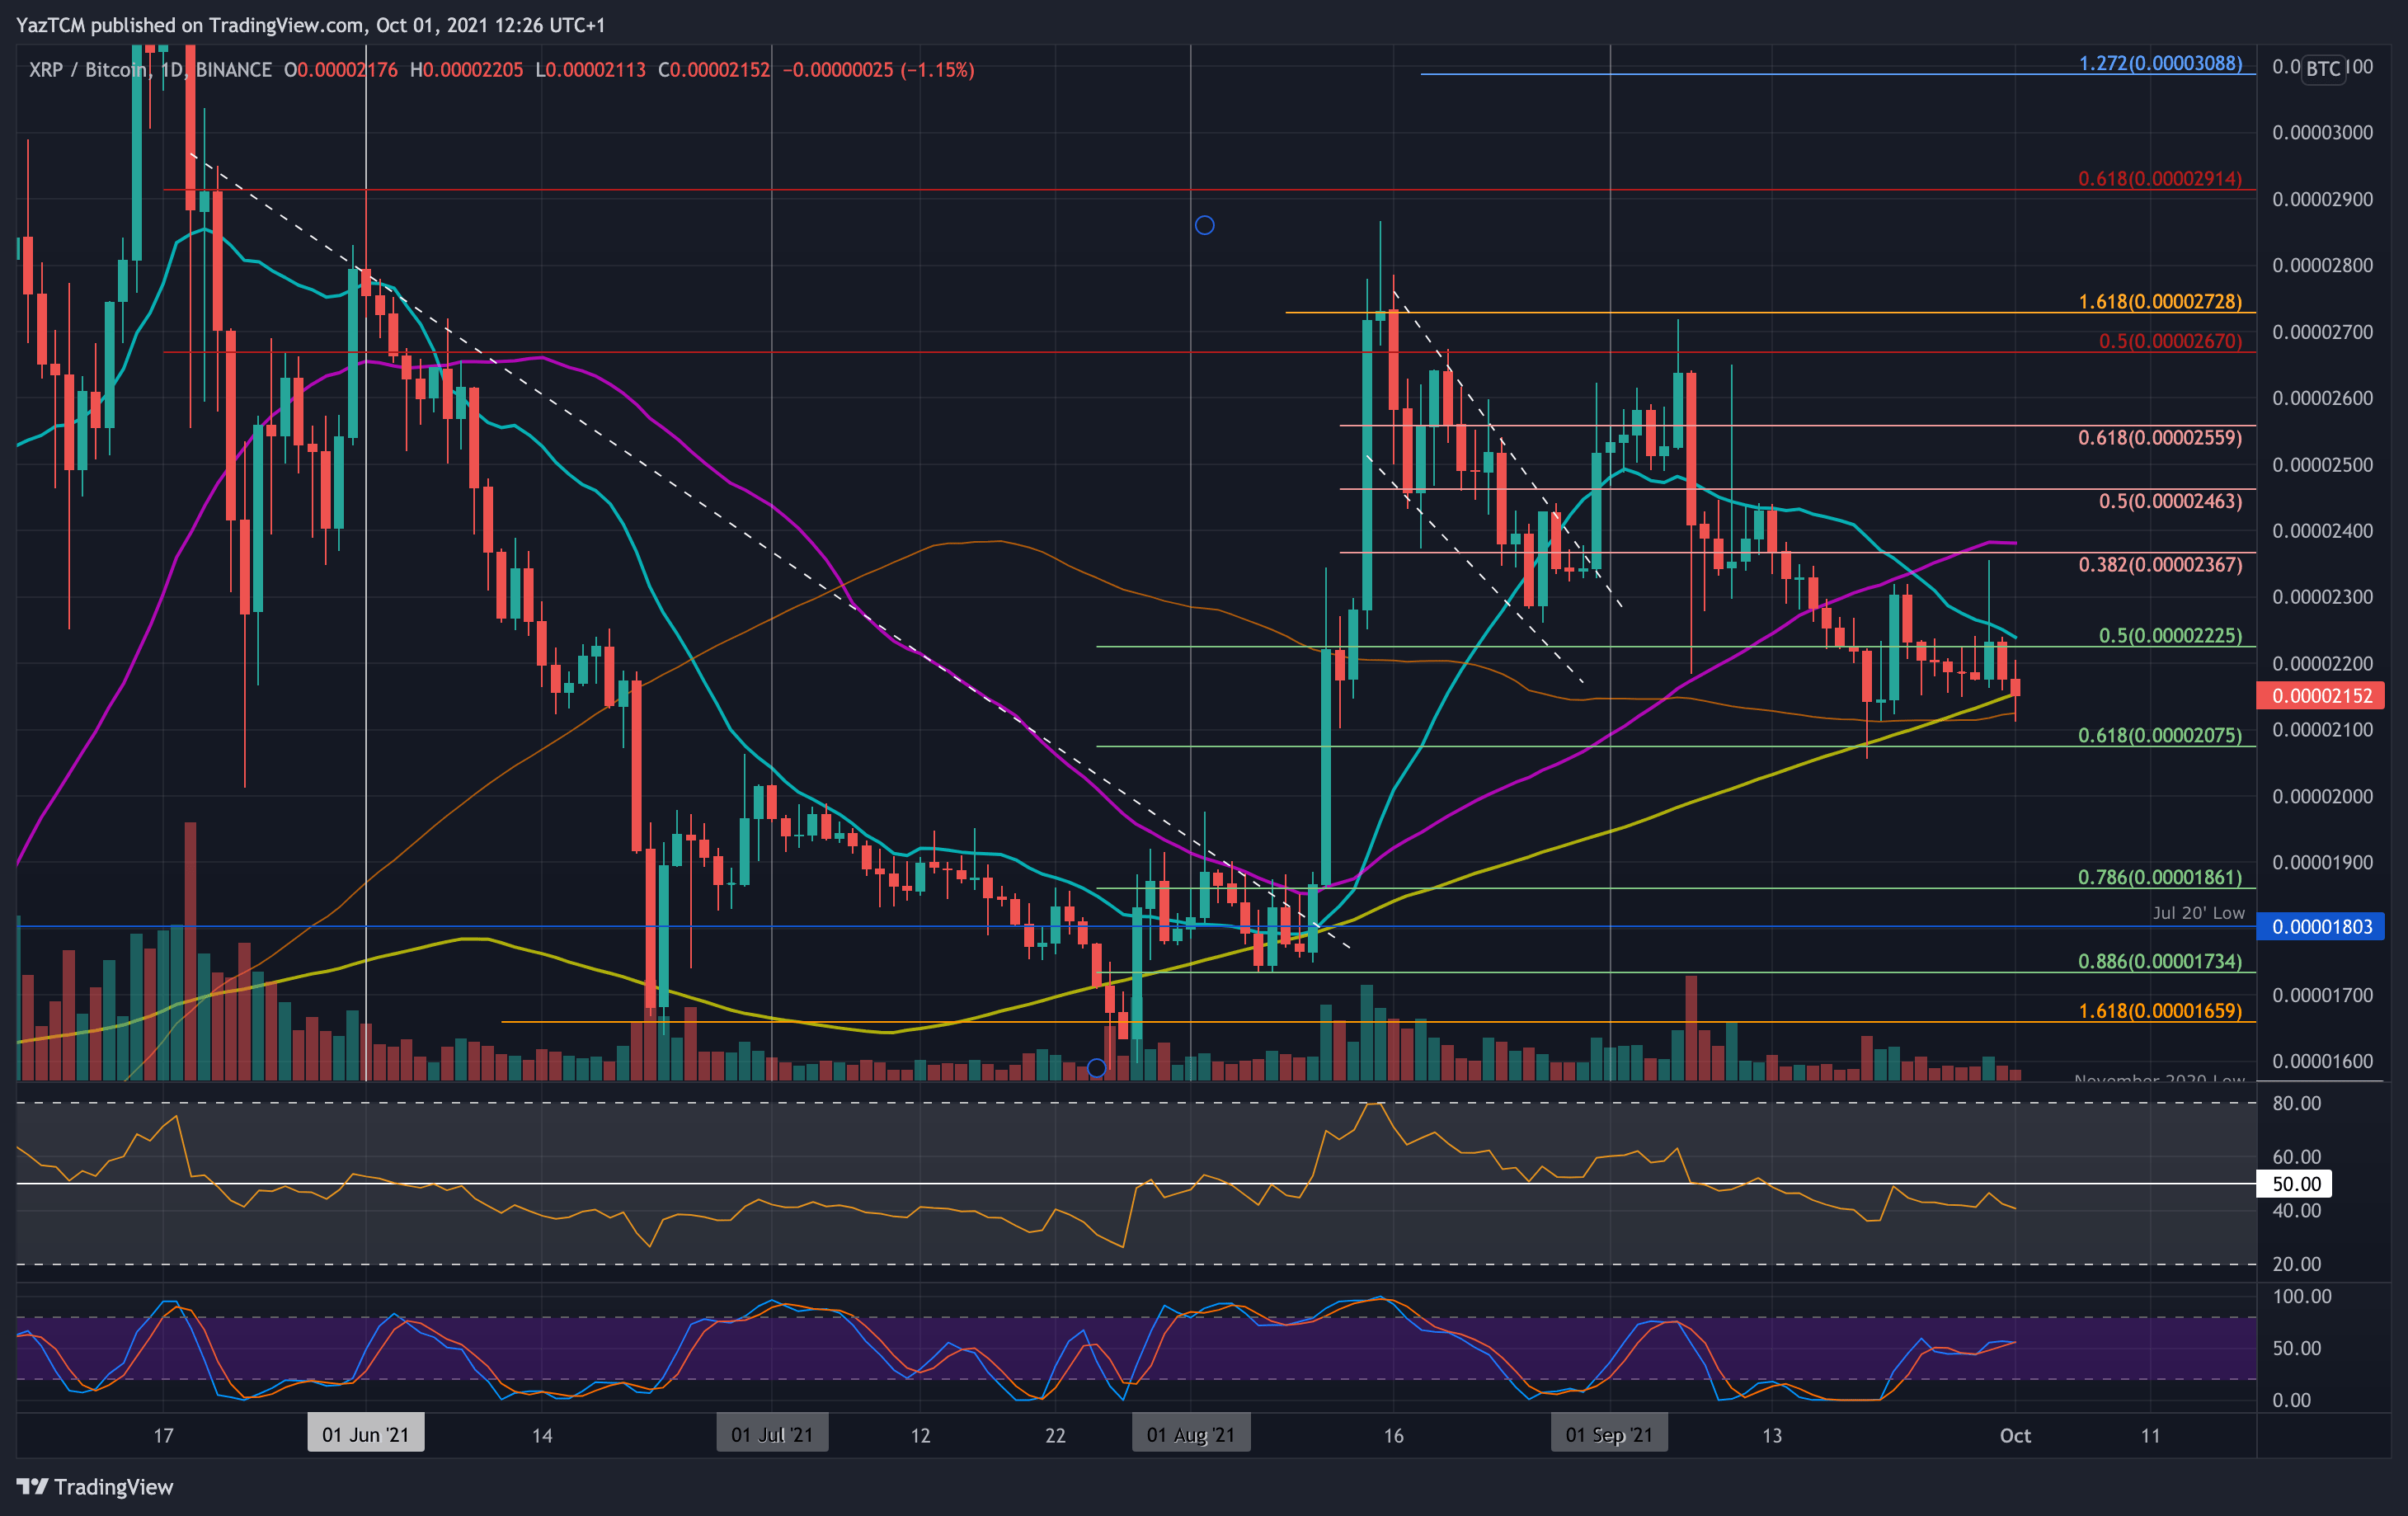
XRP seems to be struggling against BTC as it trades beneath the 200-day MA level today. The coin has been stuck in a range between 3200 SAT and 2100 SAT for the past fortnight and must break this range to dictate the next direction for the market.
Looking ahead, the first strong support lies at 2100 SAT (100-day MA). This is followed by 2050 SAT (.618 Fib), 2000 SAT, 1860 SAT (.786 Fib), and 1800 SAT (July 2020 low).
On the other side, the first resistance lies at 2225 SAT (20-day MA). This is followed by 2300 SAT, 2400 SAT (50-day MA), 2463 SAT (bearish .5 Fib), and 2560 SAT (bearish .618 Fib).
Cardano
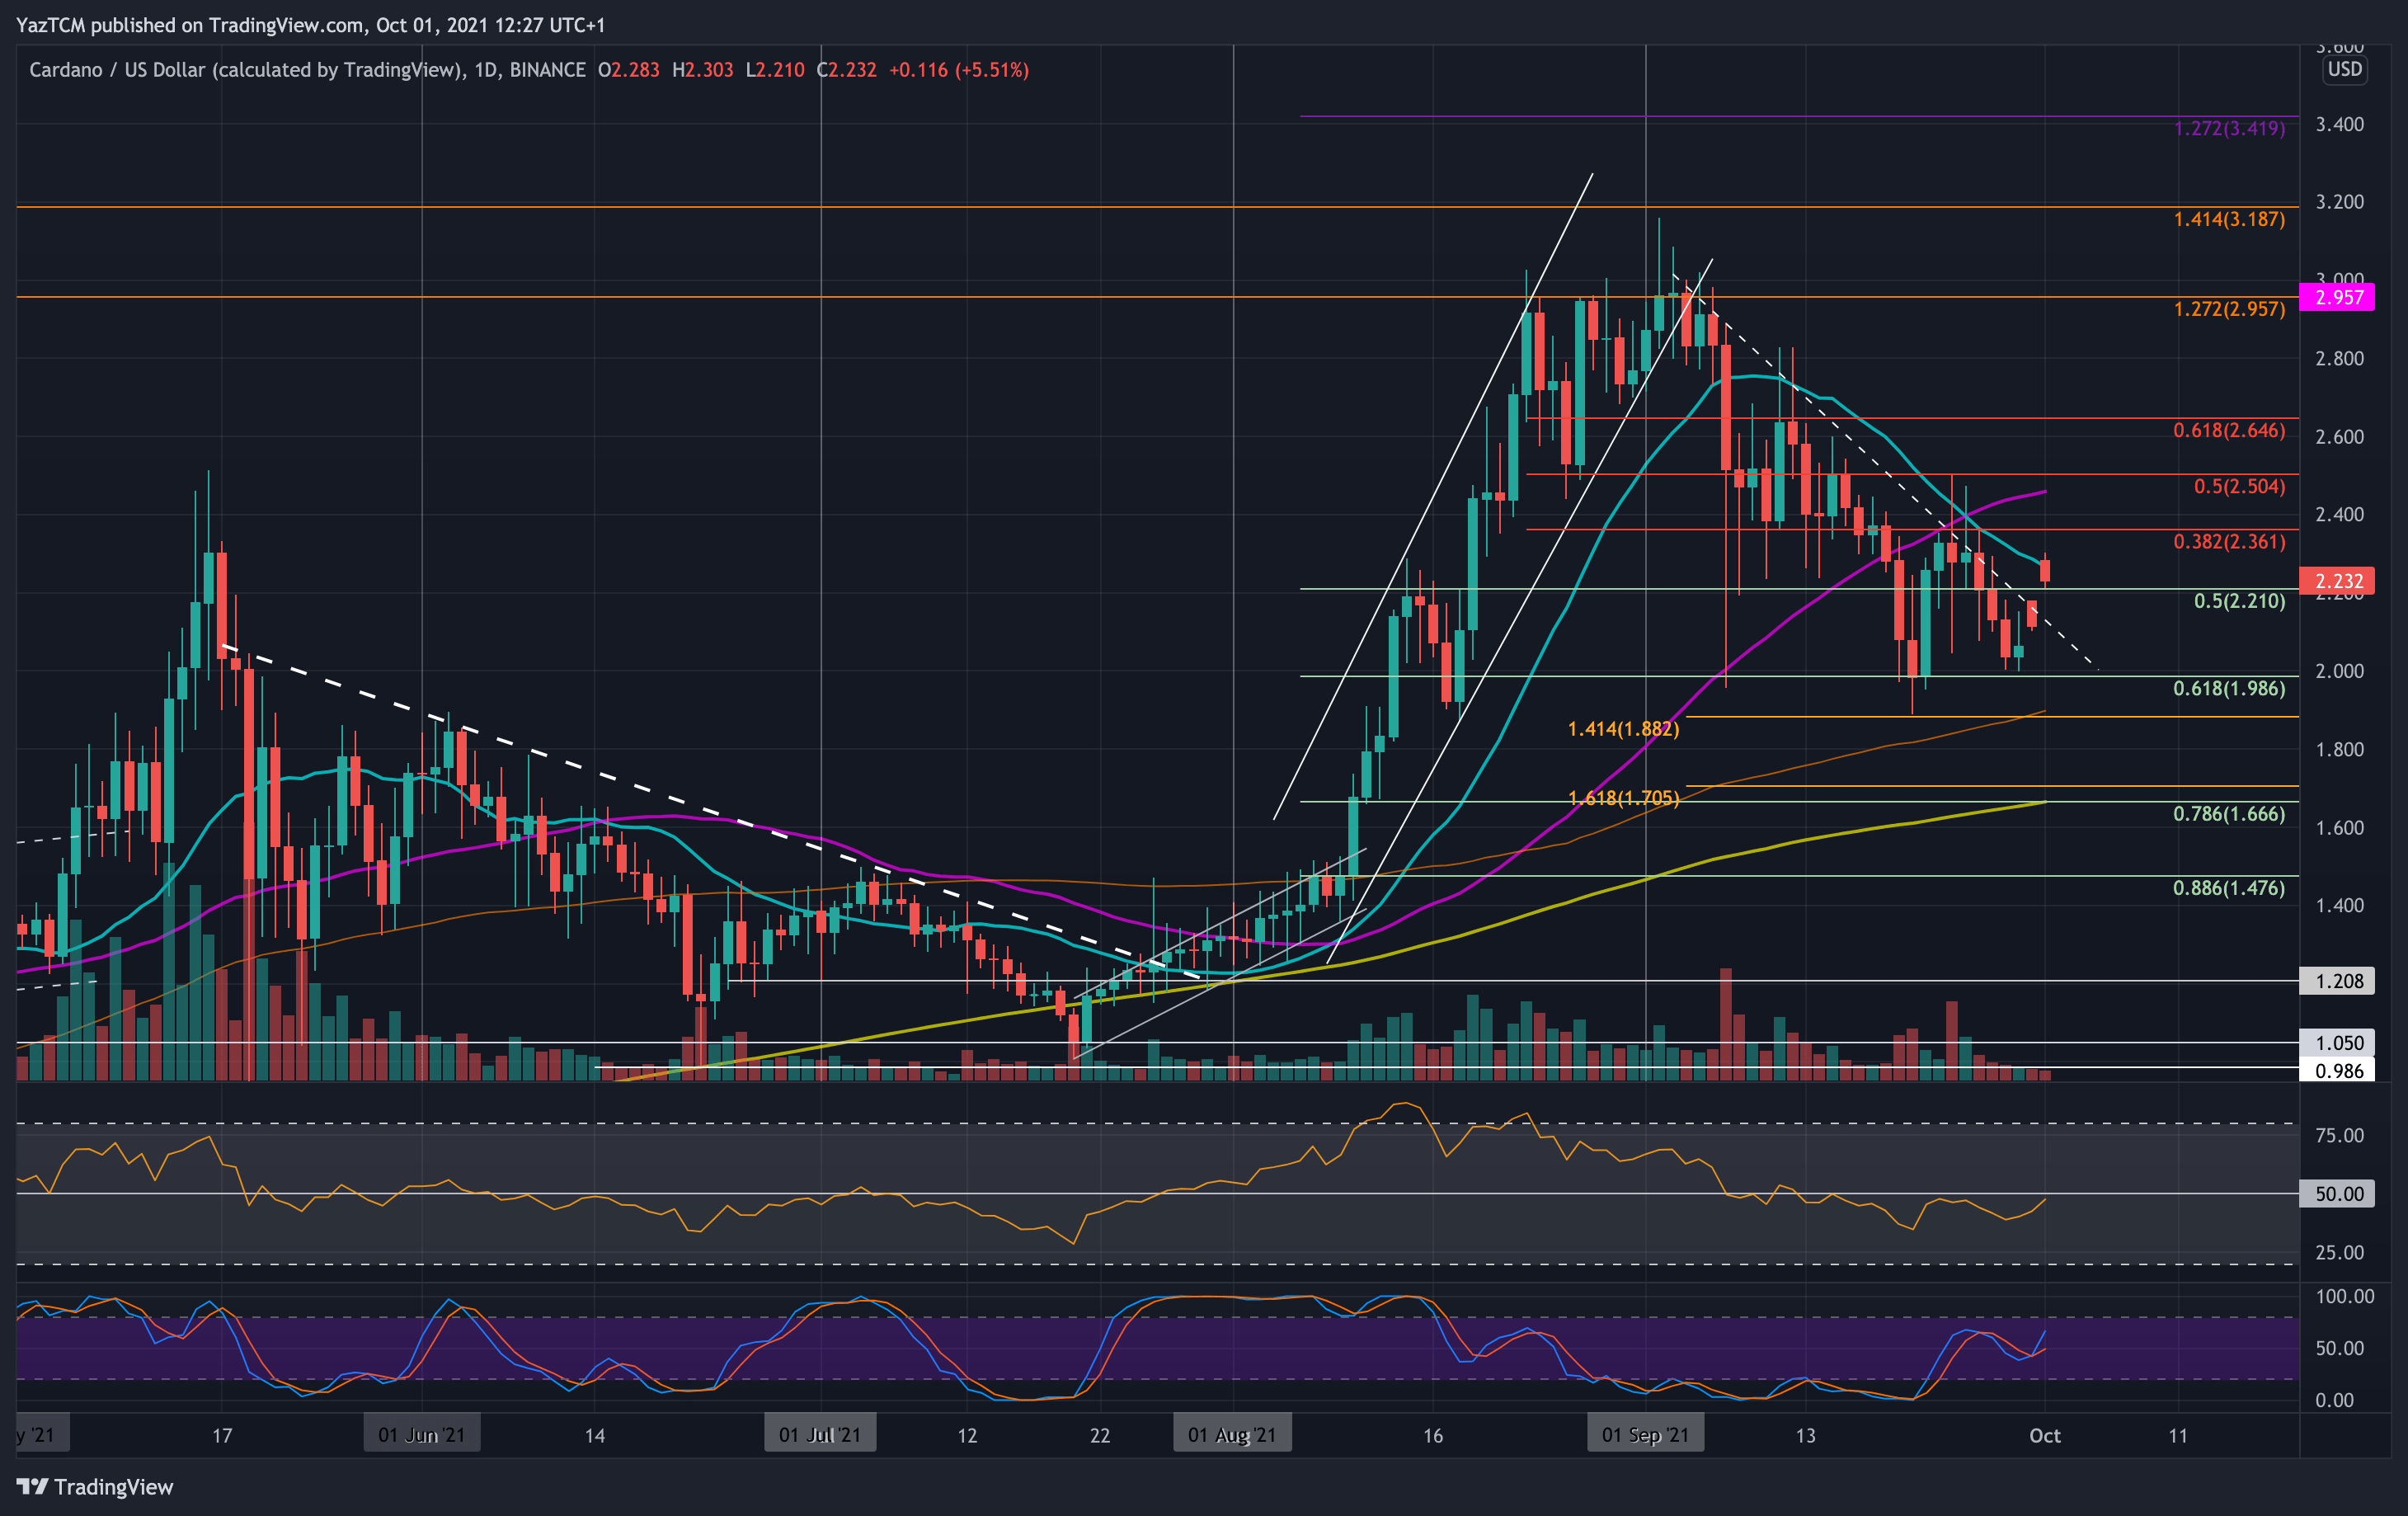
ADA is down a small 3.3% over the course of the week as it trades at $2.23. It fell from resistance at $2.36 (bearish .382 Fib) at the start of the week and continued lower until the support at $2.00 (.618 Fib) was met.
On Wednesday, ADA bounced from $2.00 and pushed above a descending trend line yesterday. Today, ADA continued higher to meet the resistance at the 20-day MA level.
Looking ahead, the first resistance lies at $2.36 (bearish .382 Fib). This is followed by $2.50 (bearish .5 Fib & 50-day MA), $2.65 (bearish .618 Fib), and $2.80.
On the other side, the first support lies at $2.21 (5 Fib). This is followed by $2.10, $2.00 (.618 Fib), $1.88 (100-day MA), and $1.80.
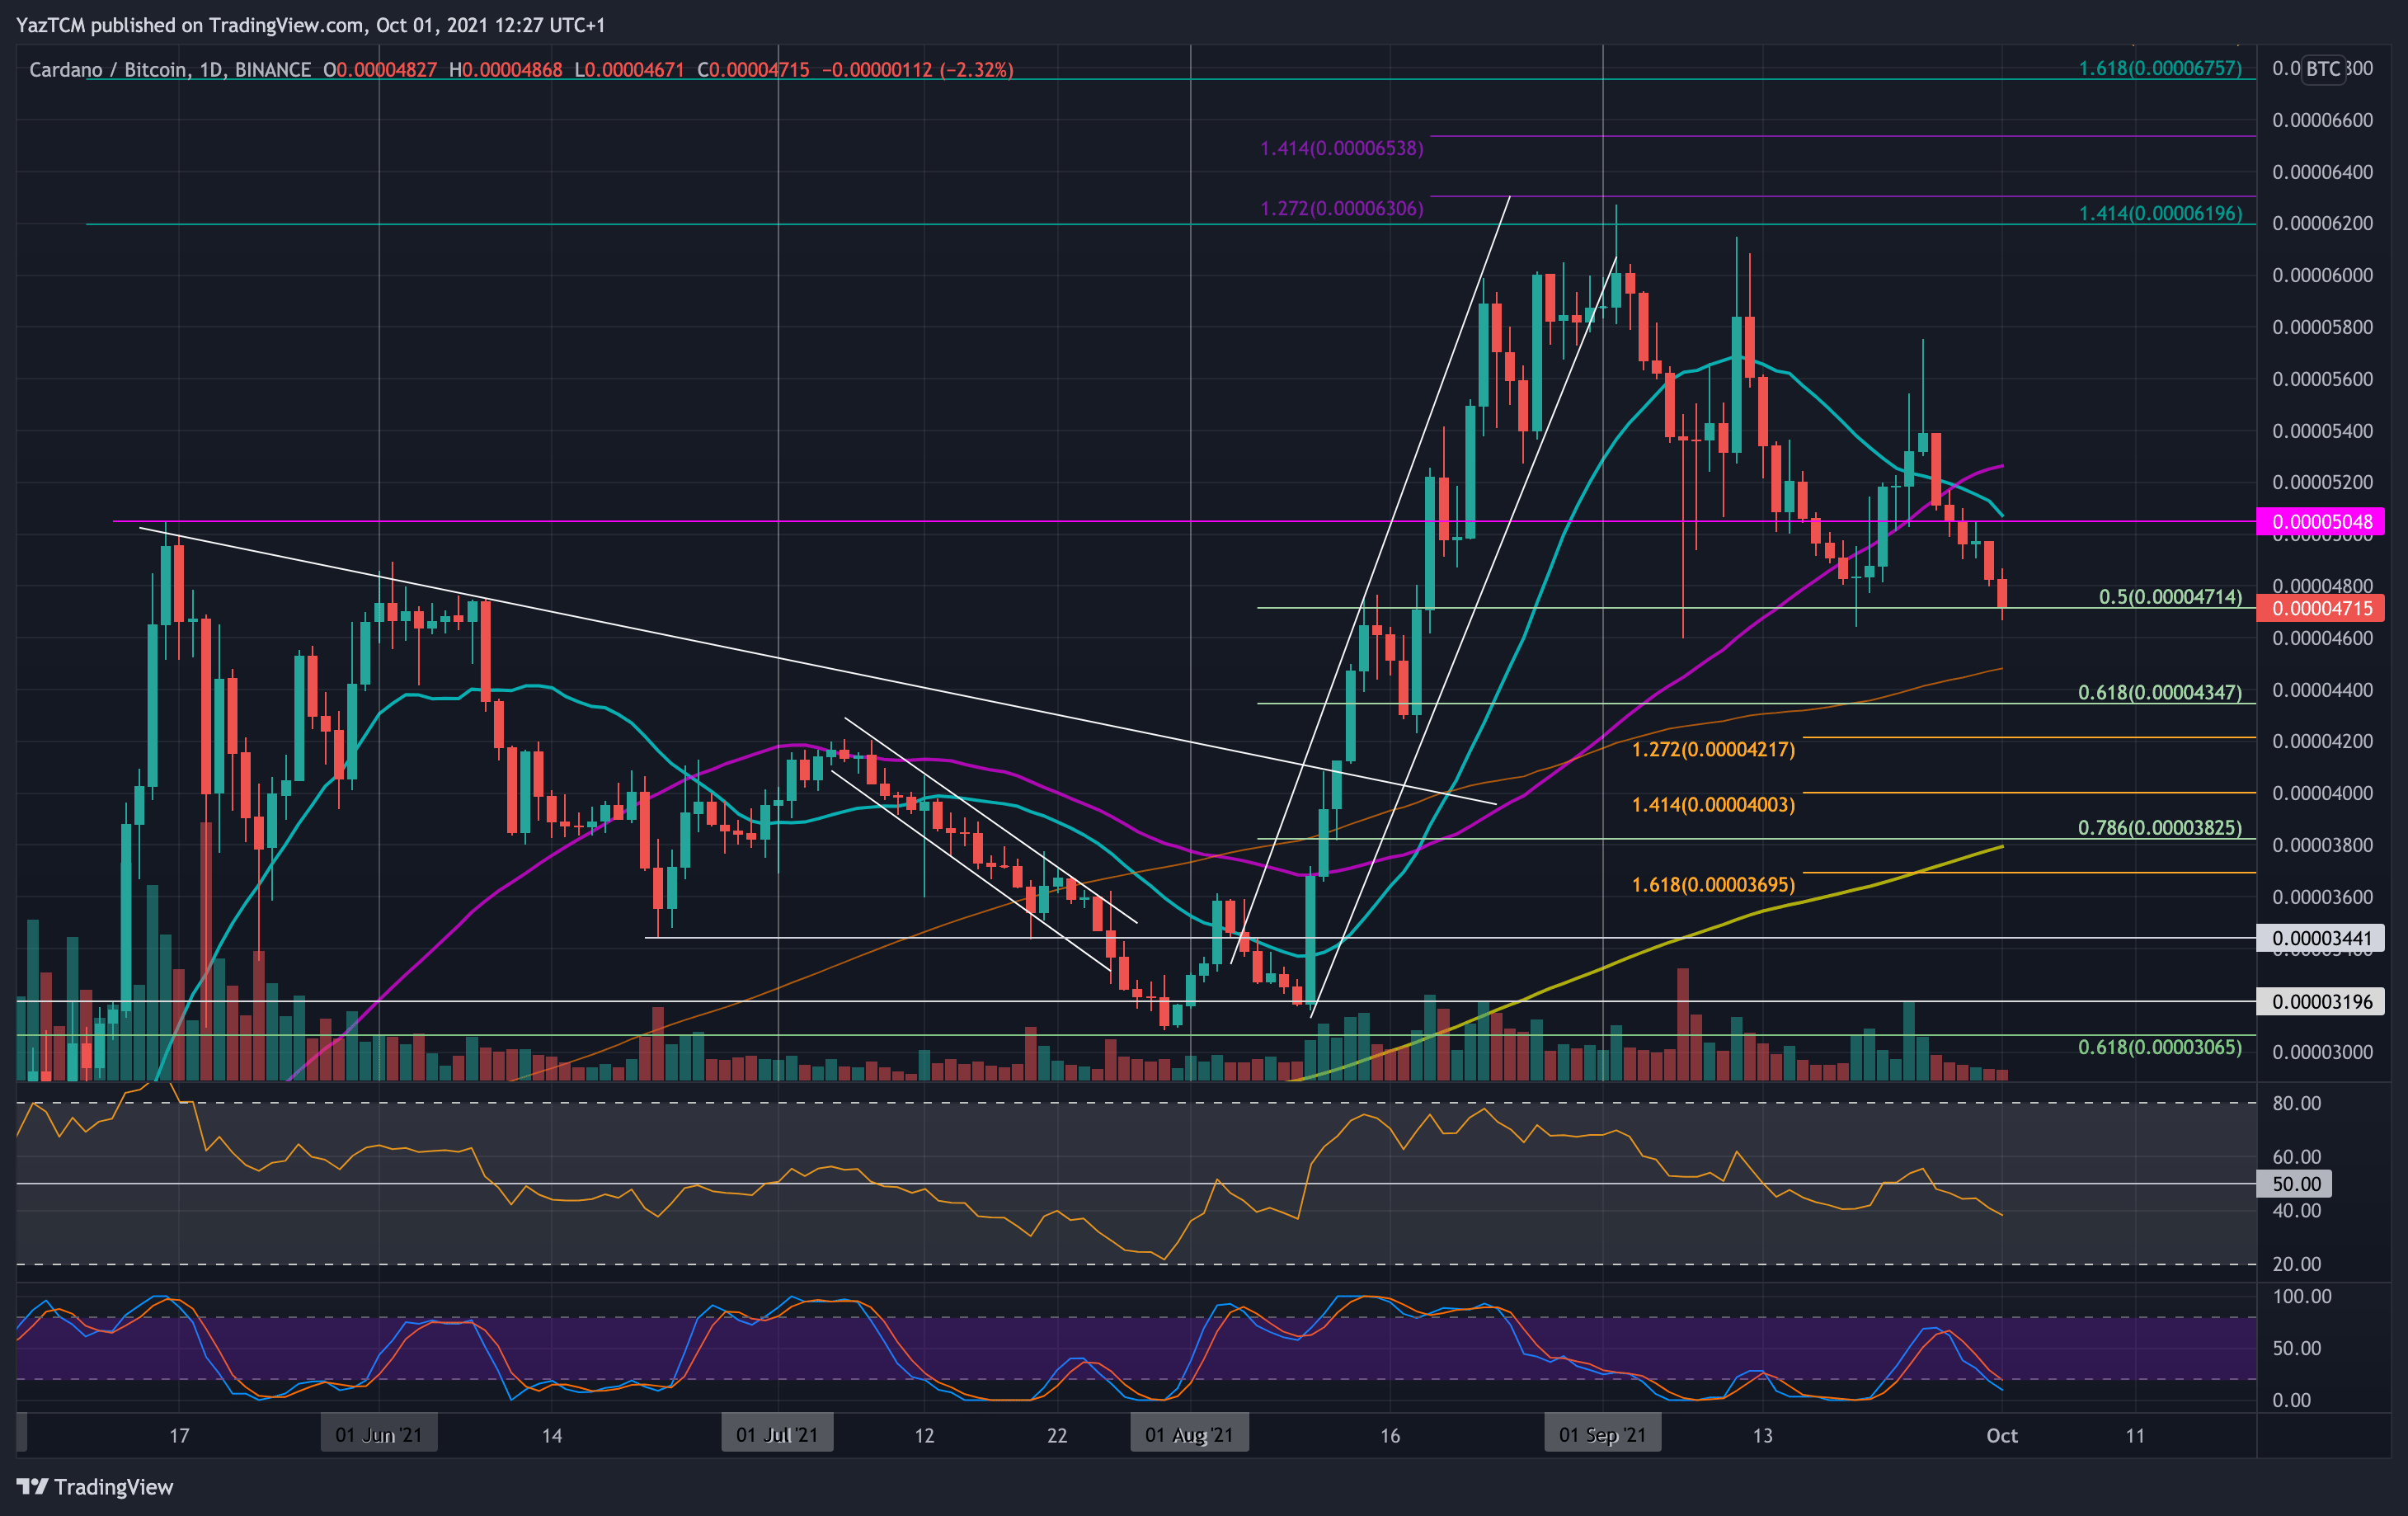
ADA is under bearish pressure against BTC as it battles to stay above the September support today. The cryptocurrency started the week at around 5400 SAT. Unfortunately, it could not overcome this resistance and ended up rolling over beneath the 50-day MA from there.
It continued to fall throughout the week until support was found today at 4715 SAT (.5 Fib Retracement).
Looking ahead, if the bears push beneath 4715 SAT, the first support lies at 4600 SAT. This is followed by 4500 SAT (100-day MA), 4350 SAT (.618 Fib), and 4220 SAT (downside 1.272 Fib Extension).
On the other side, the first resistance lies at 4800 SAT. This is followed by 5000 SAT, 5200 SAT (50-day MA), 5400 SAT, and 5800 SAT.
Binance Coin
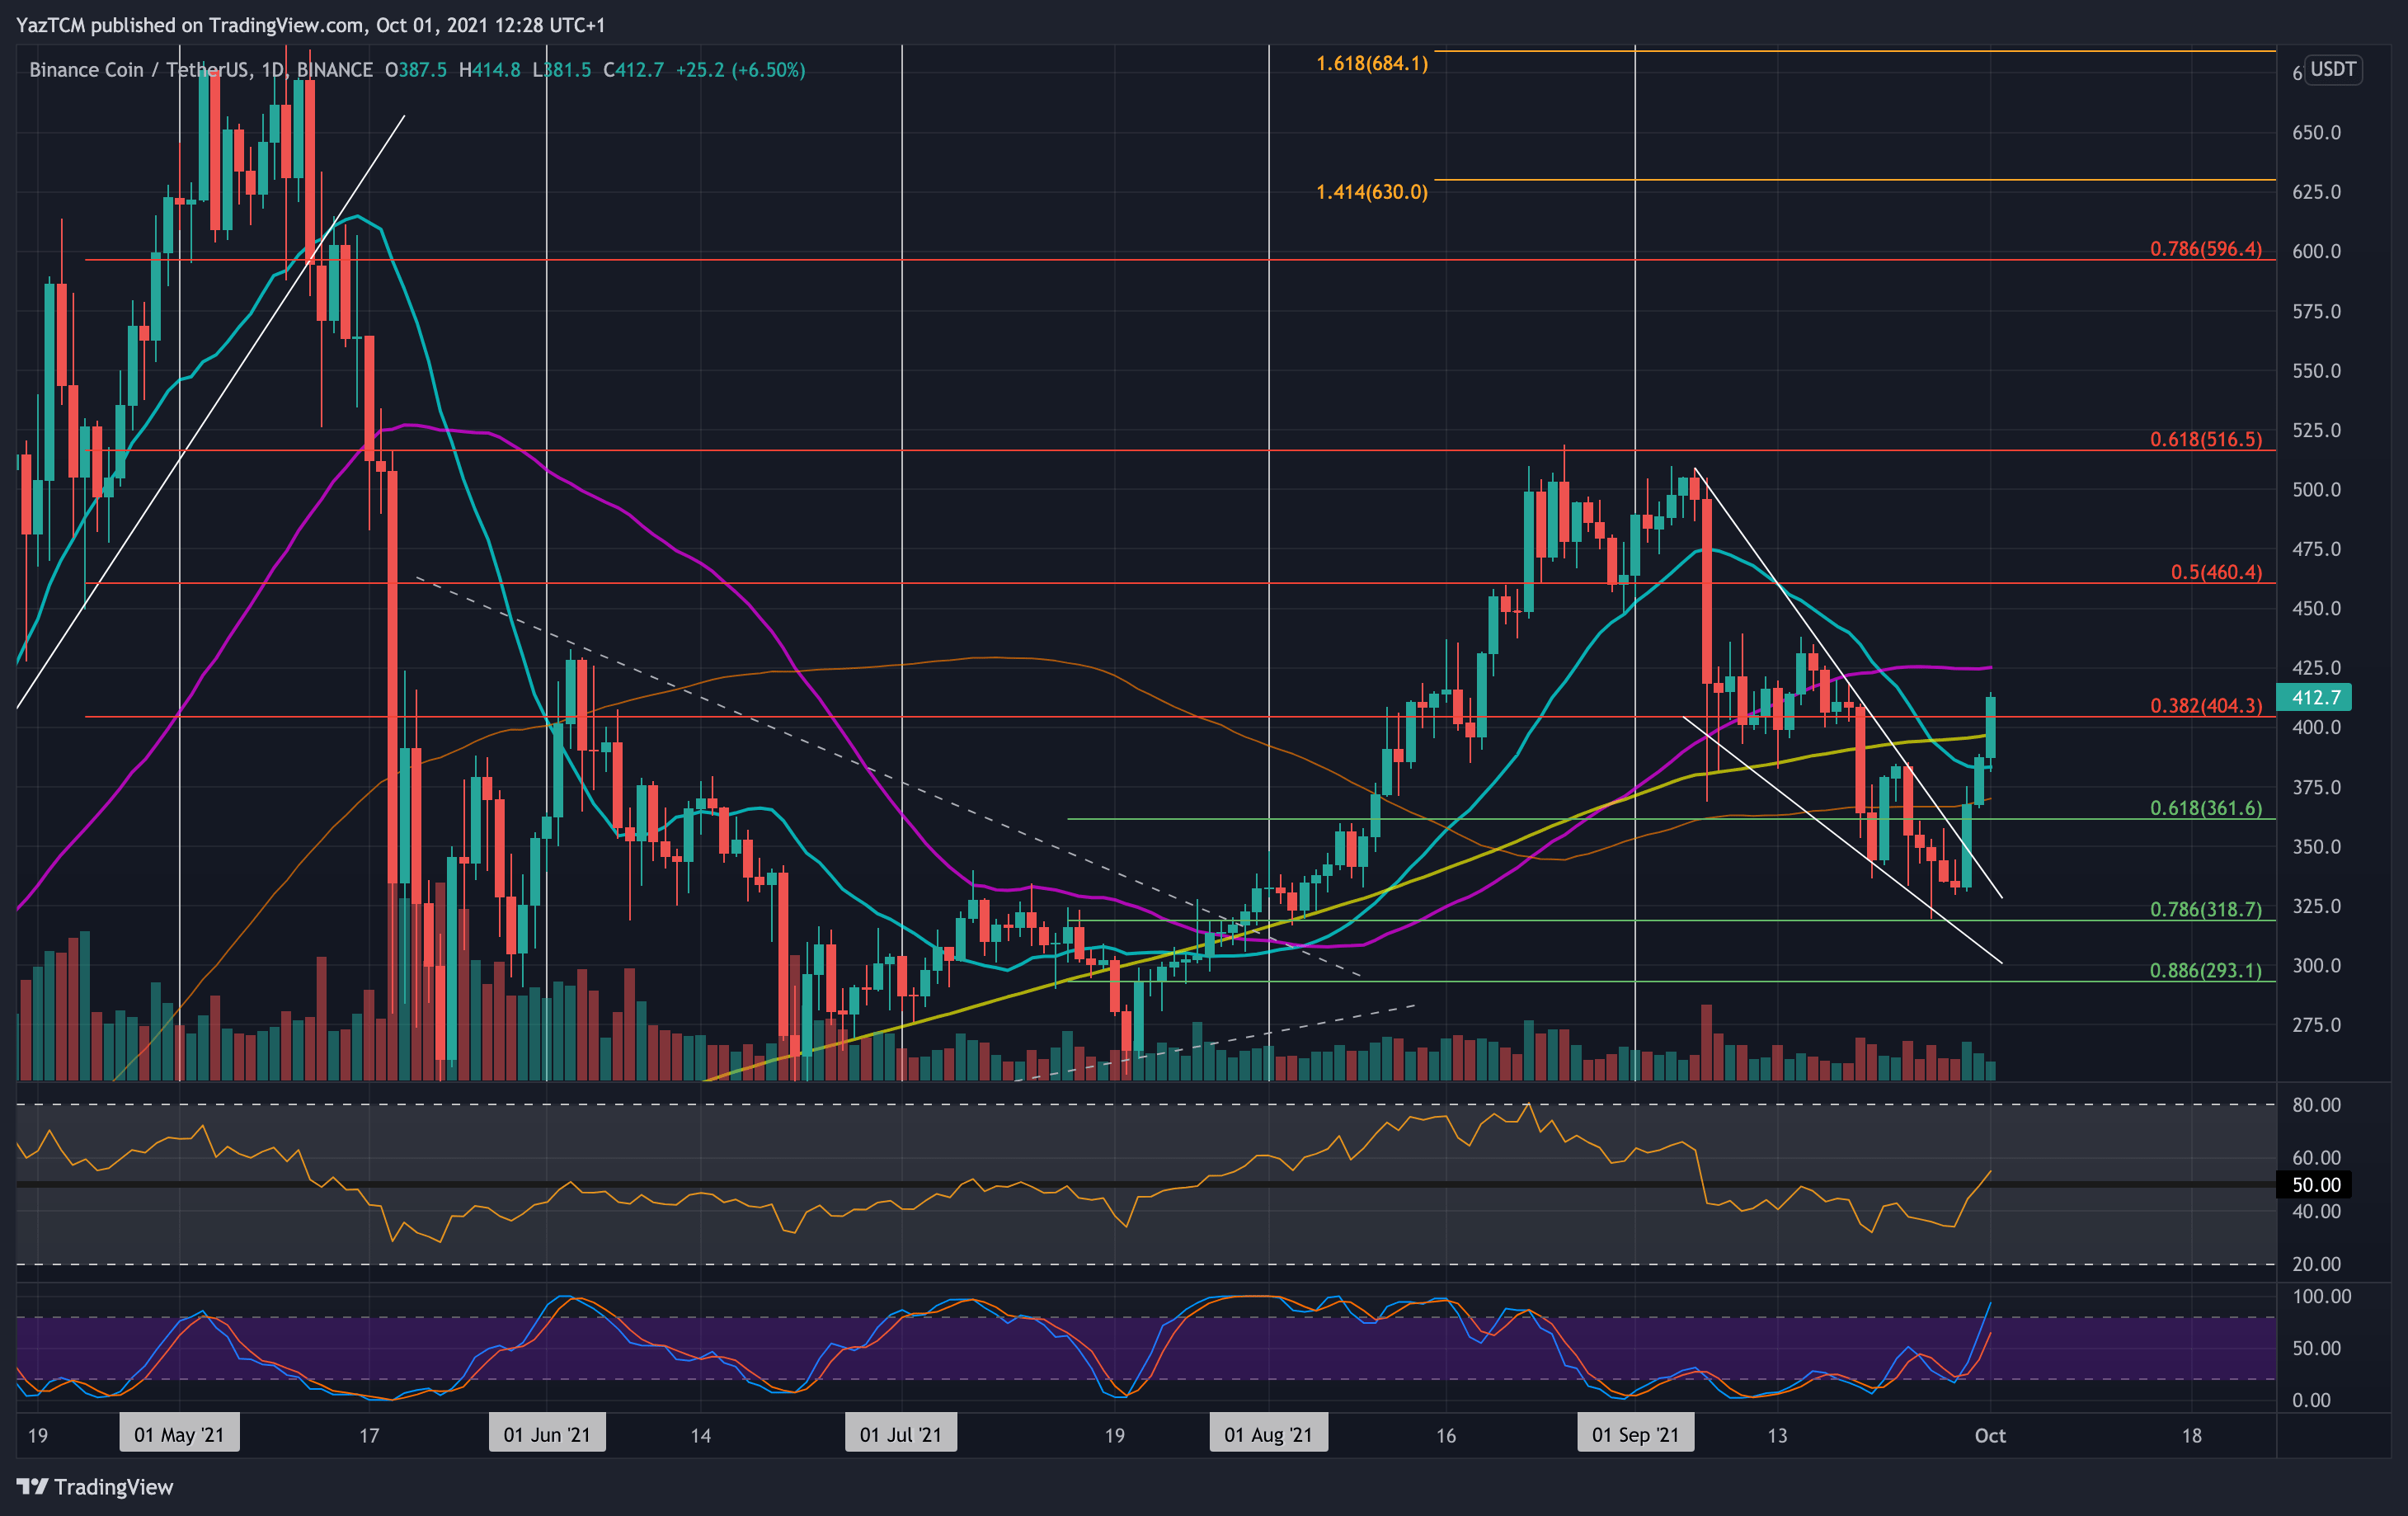
BNB is up by a solid 8.2% over the week as the coin breaks back above $400 again to reach $412 today. It was trading inside a falling wedge pattern for the entire period of September.
On Wednesday, BNB finally reversed and broke toward the upside of the pattern to meet resistance at the 100-day MA. The 100-day MA resistance was penetrated yesterday and it continued to climb above $400 and the 200-day MA today to reach $412.
Looking ahead, the first resistance lies at $425 (50-day MA). This is followed by $450, $460 (bearish .5 Fib ), $475, and $500. Added resistance lies at $516 (bearish .618 Fib) and $550.
On the other side, the first support lies at $400 (200-day MA). This is followed by $380 (20-day MA), $375 (20-day MA), $260 (.618 Fib), and $350.
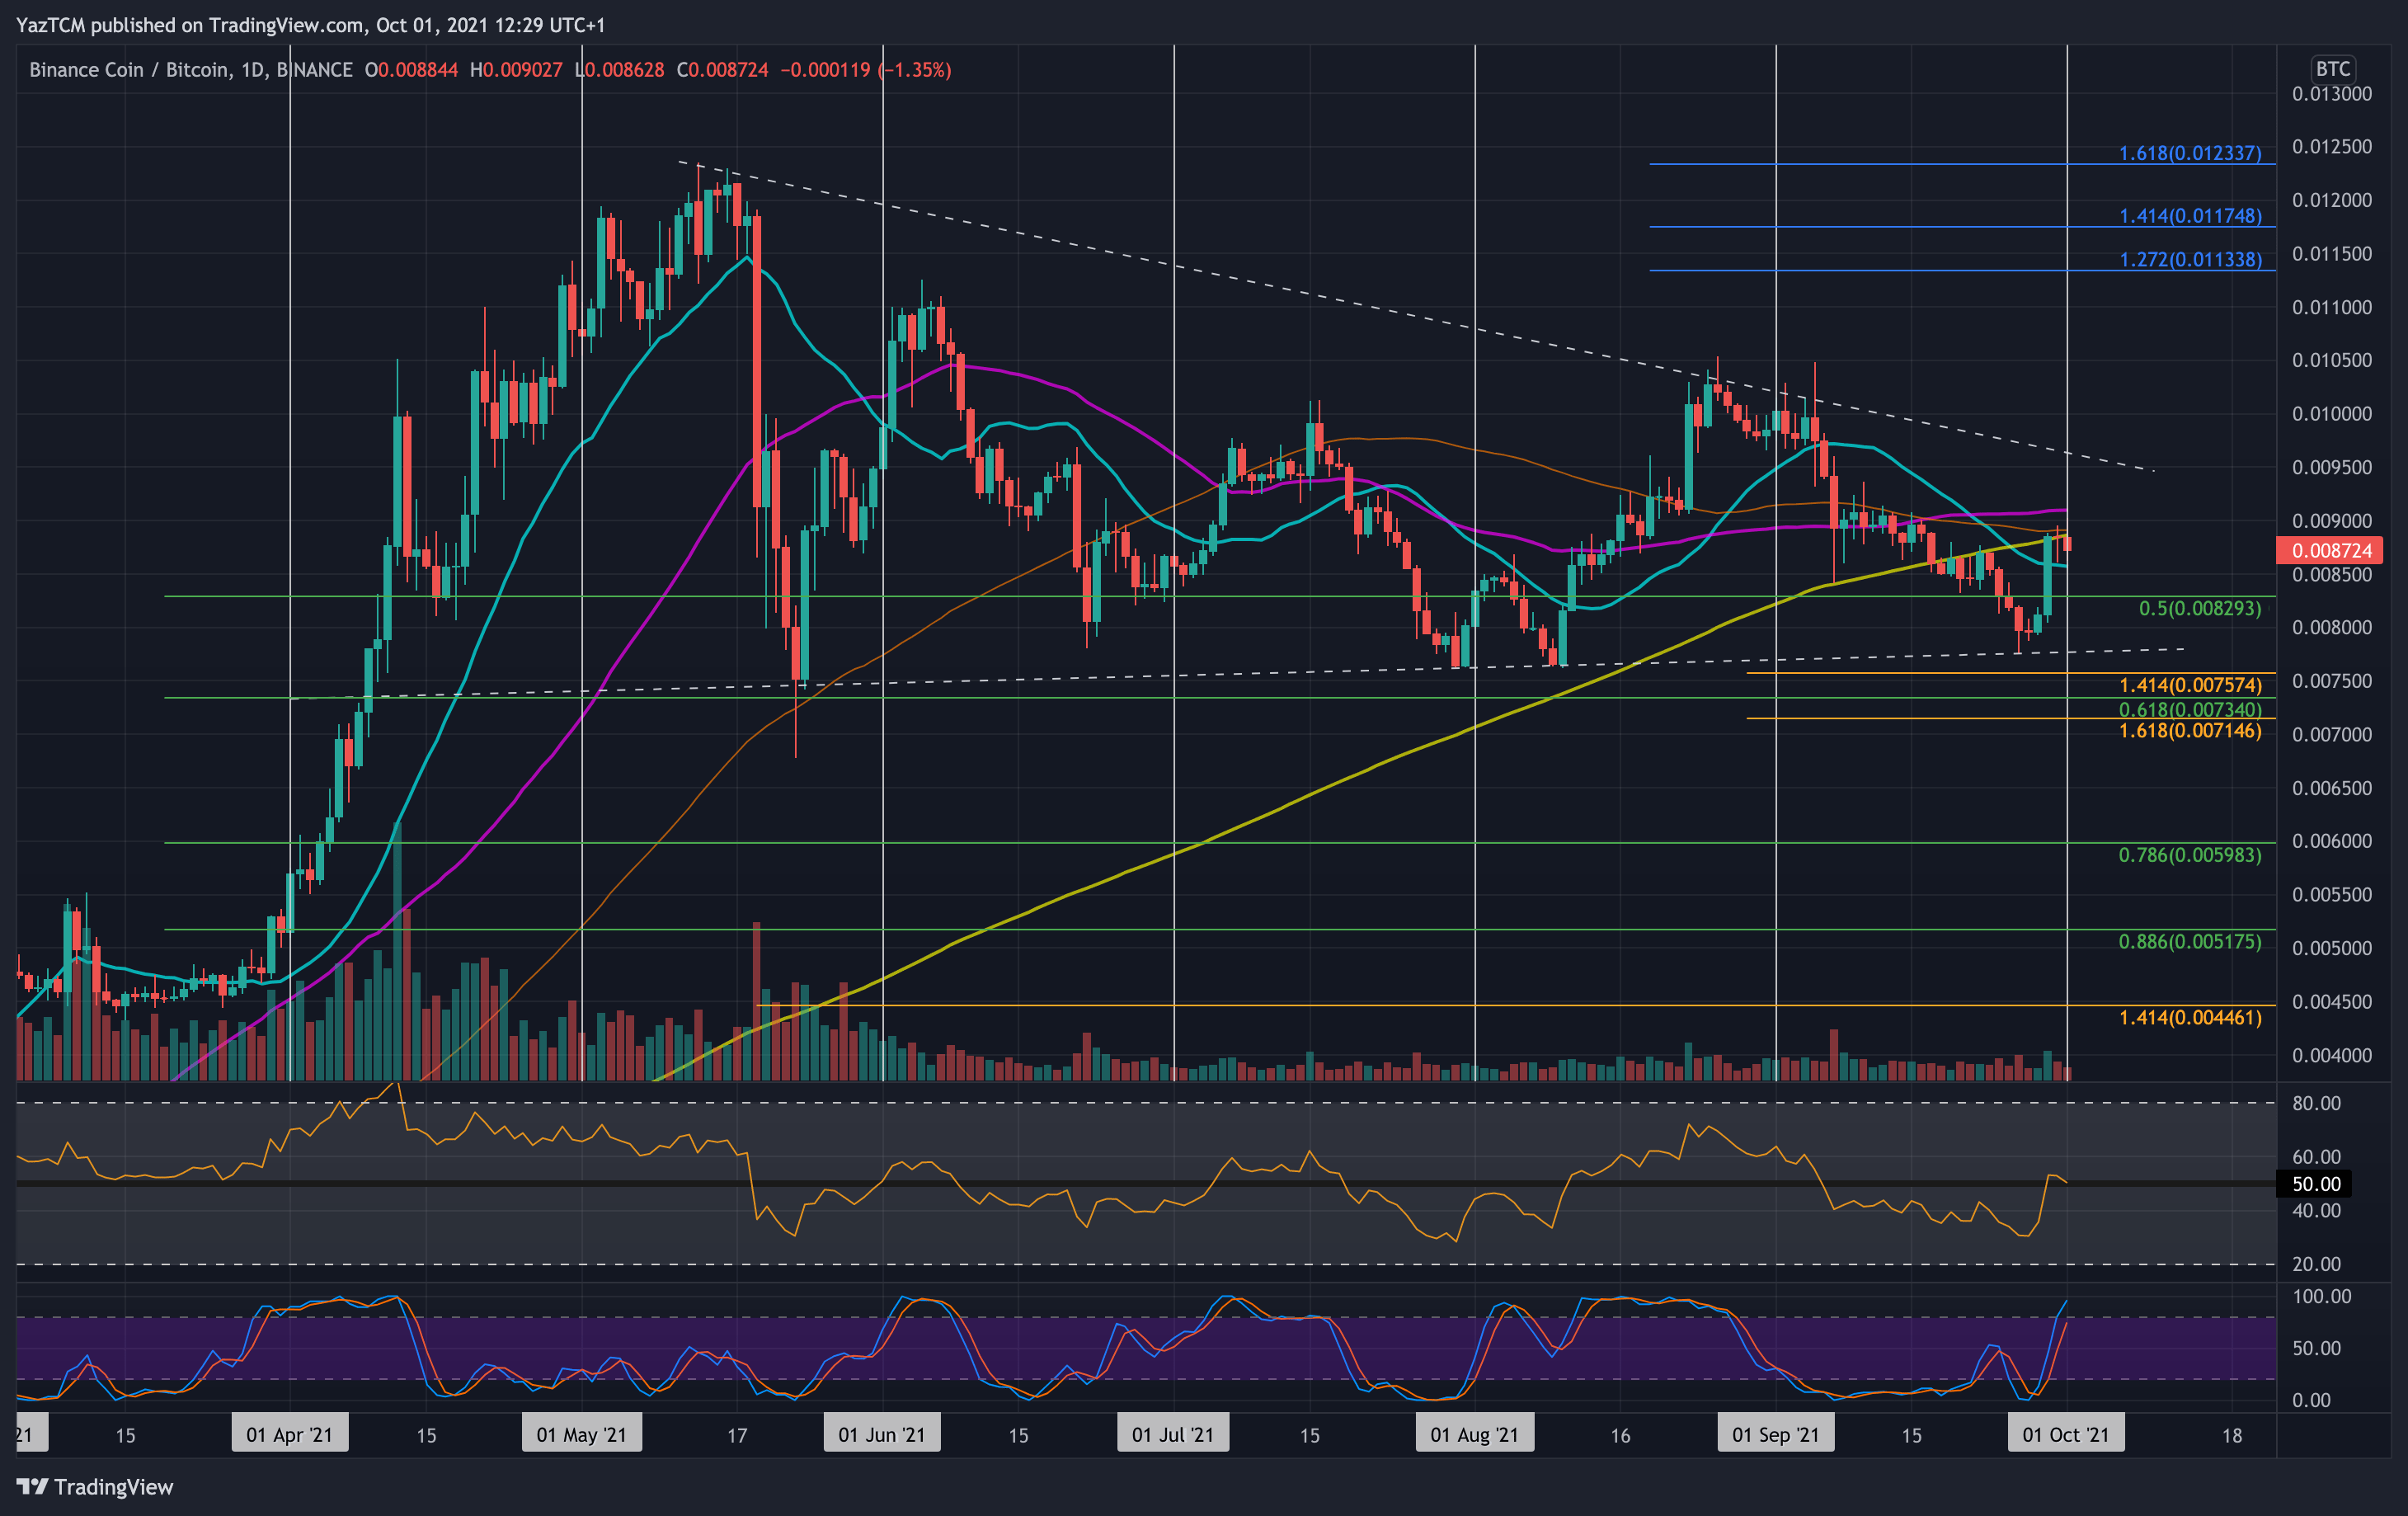
BNB is very flat against BTC as the coin currently sits inside a long-term descending triangle pattern. It started in September at around 0.01 BTC and headed lower throughout the entire month.
Last weekend, BNB managed to find support at the lower angle of the long-term triangle. From there, it rebounded through the week as it pushed back above 0.008 BTC. On Wednesday, BNB exploded higher as it reached as high as 0.009 BTC (200-day MA). It has remained local to this resistance over the past two days.
Looking ahead, the first support lies at 0.0085 BTC (20-day MA). This is followed by 0.00829 BTC (.5 Fib), 0.008 BTC, and 0.00757 BTC.
On the other side, the first resistance lies at 0.009 BTC (50-day MA). This is followed by 0.0095 BTC, 0.01 BTC, 0.0105 BTC, and 0.011 BTC (1.272 Fib Extension).
Uniswap
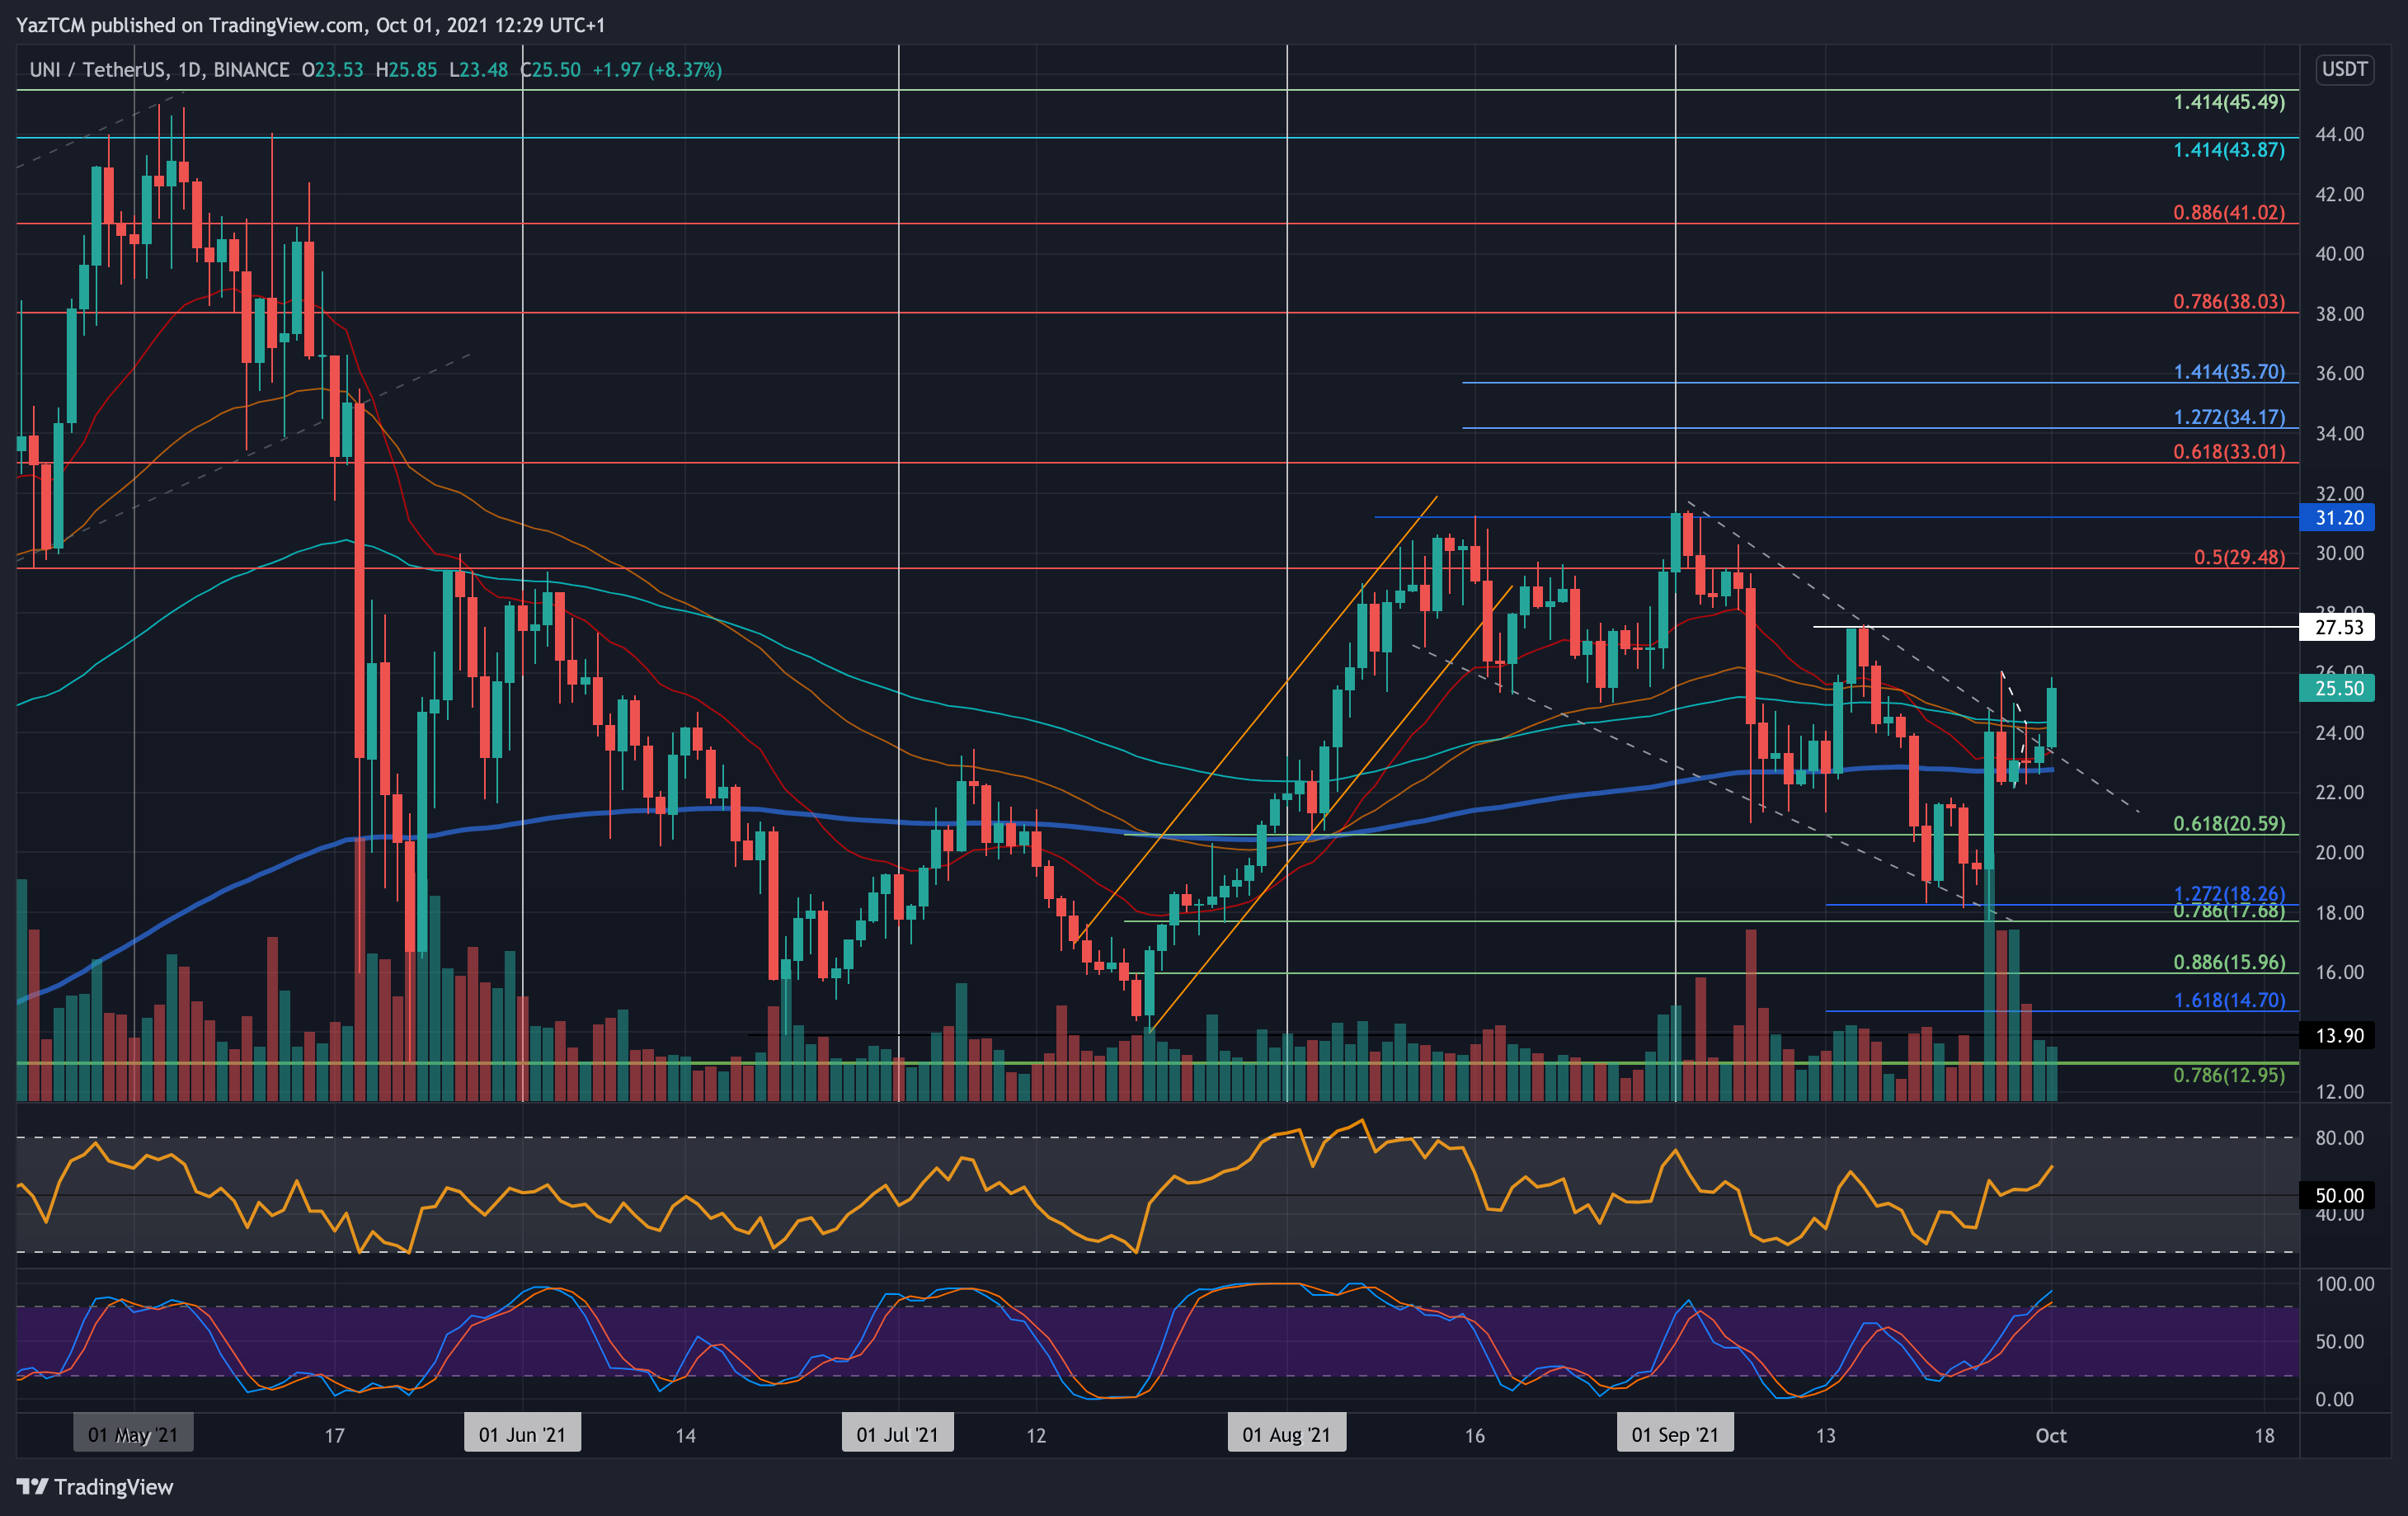
UNI is up by an impressive 19.7% over the week as the coin breaks back above $25. It was trading inside a descending wedge formation during September. The cryptocurrency found support at $18.25 (downside 1.272 Fib Extension) on Sunday and rebounded higher into the $24 resistance (50-day MA).
The breakout of the wedge finally came today as UNI pushed above $25.
Looking ahead, the first resistance lies at $27.50. This is followed by $30 (bearish .5 Fib), $31.20 (September highs), and $33 (bearish .618 Fib).
On the other side, the first support lies at $24 (20-day MA). This is followed by $23 (200-day MA), $22, $20.60 (.618 Fib), and $20.
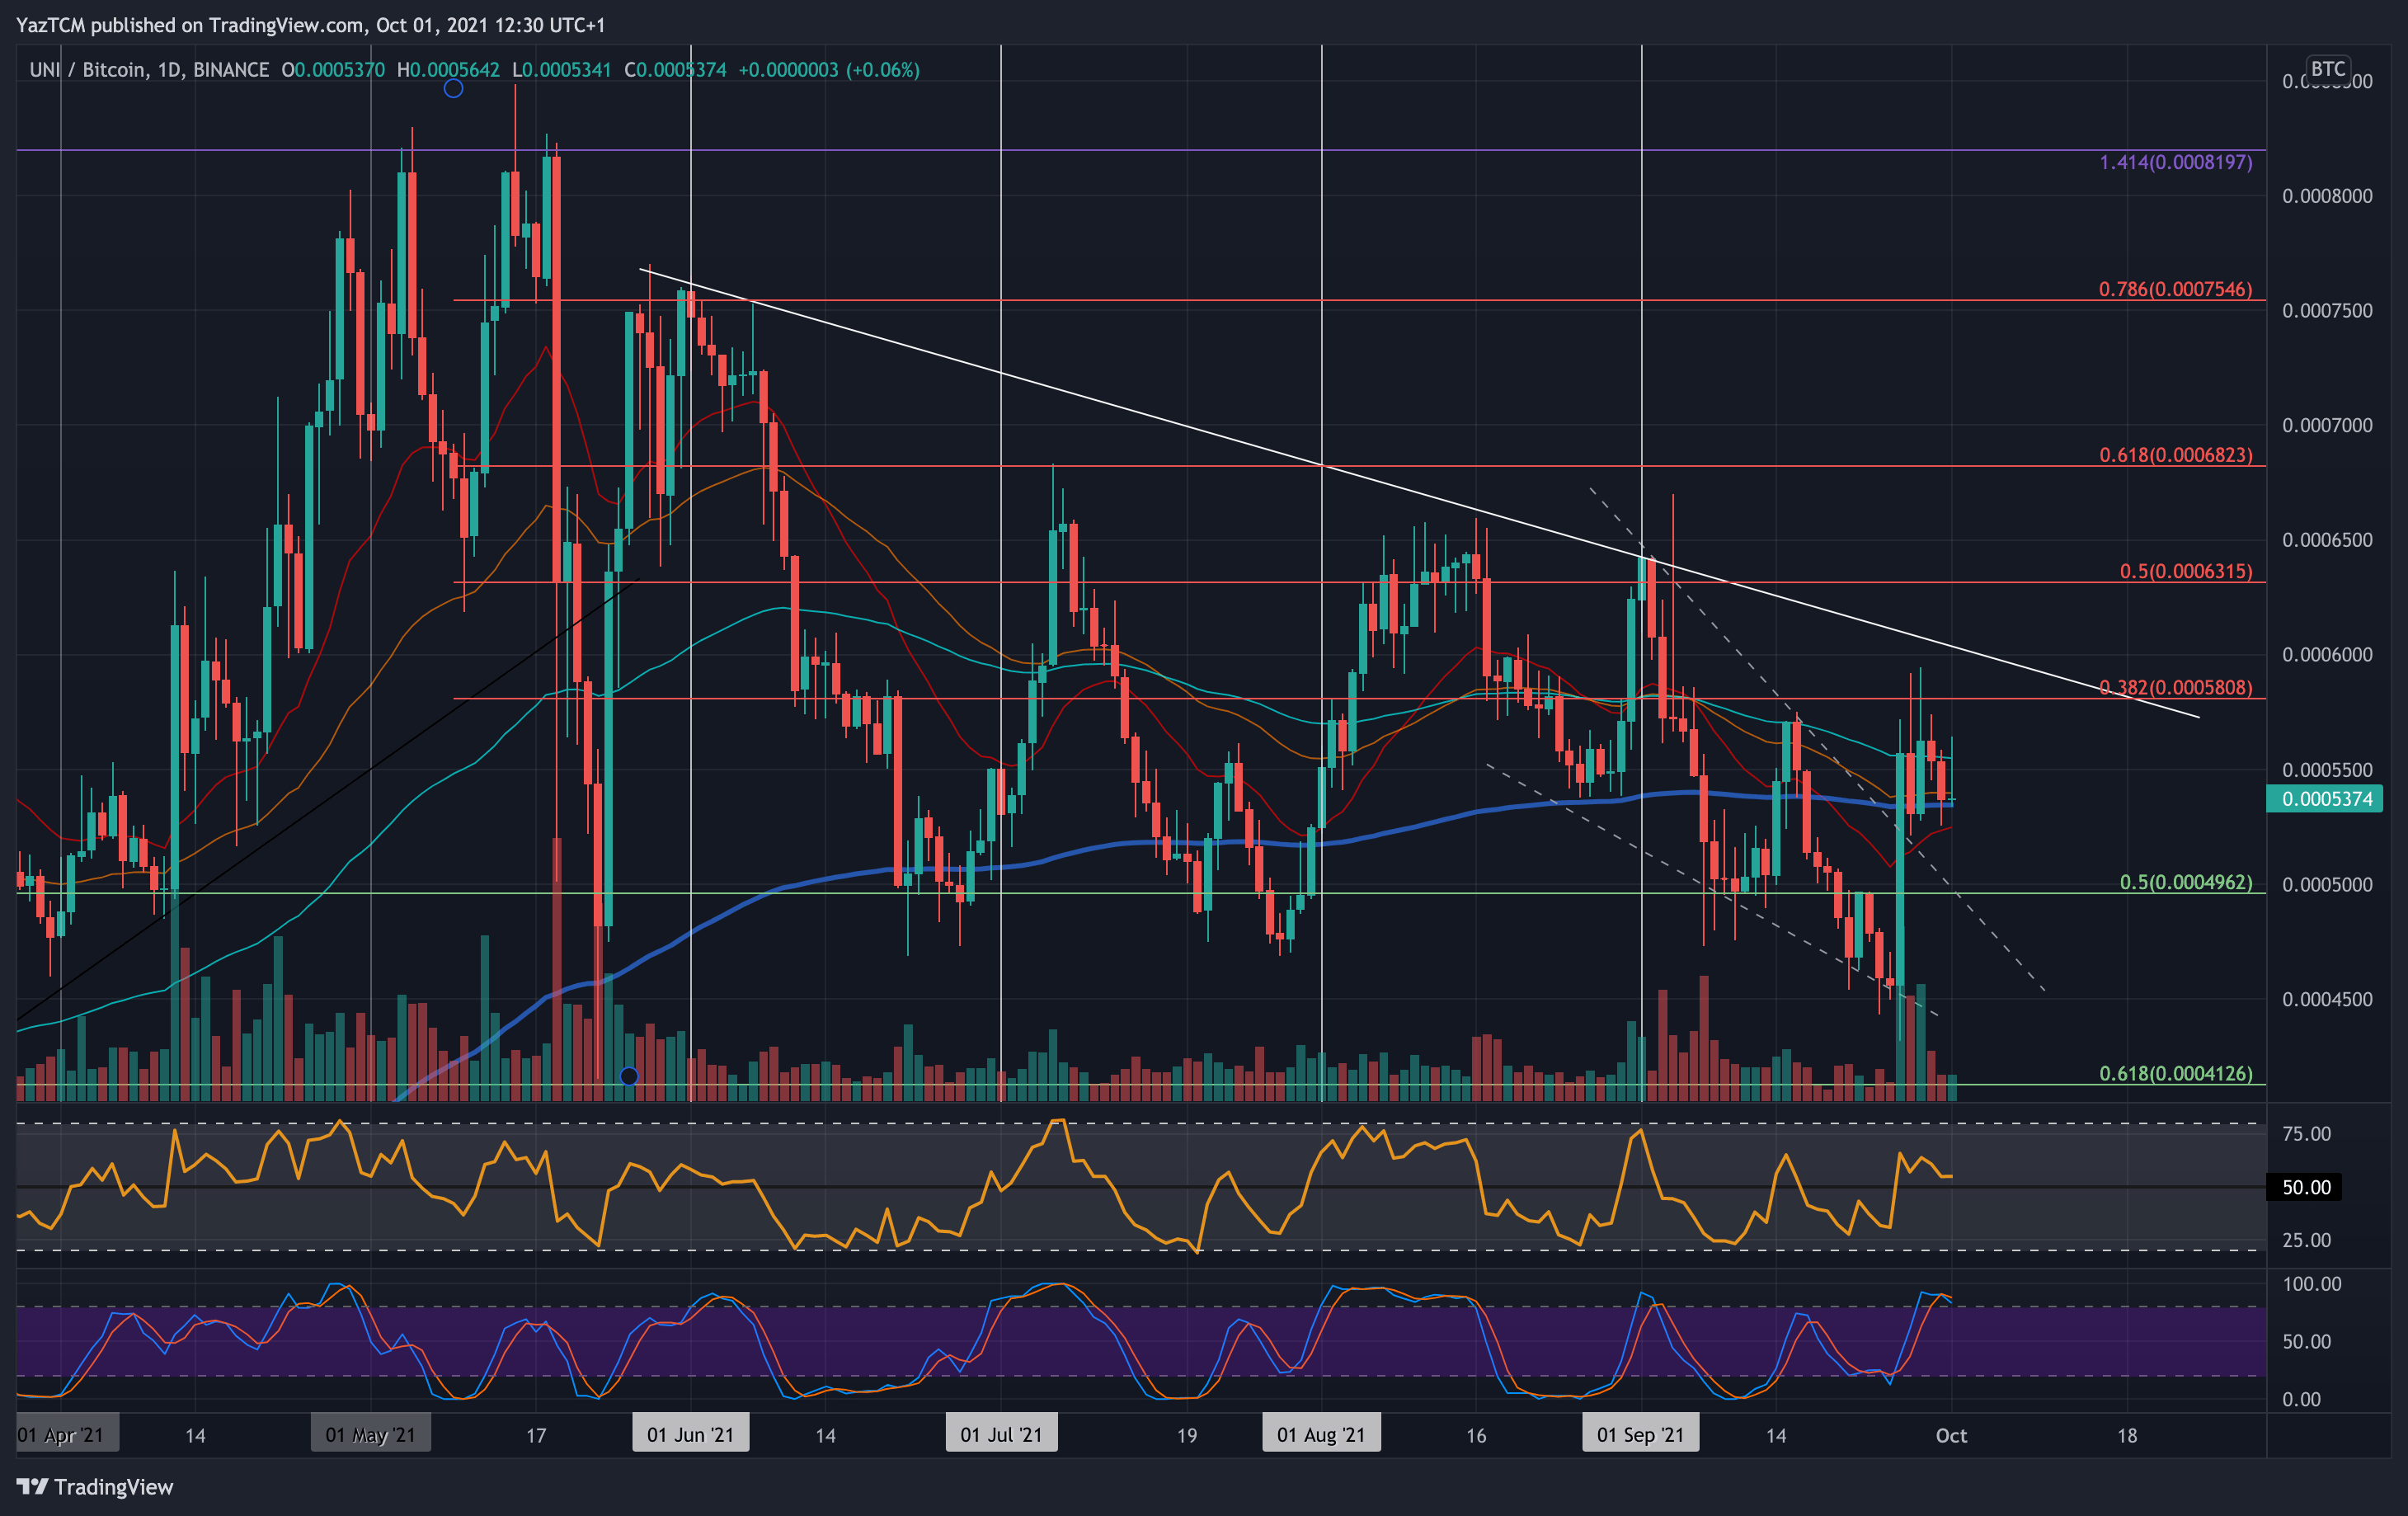
BNB also managed to break above a wedge formation against BTC this week. The coin currently is trading back above the 200-day MA at 0.000537 BTC after finding support at 0.00045 BTC on Sunday.
Looking ahead, the first strong resistance lies at 0.0005800 BTC (bearish .382 Fib). This is followed by 0.0006 BTC, 0.0006315 BTC (bearish .5 Fib), and 0.00065 BTC.
On the other side, the first support lies at 0.00053 BTC (200-day MA). This is followed by 0.0005 BTC (.5 Fib), 0.00045 BTC, and 0.000412 BTC (.618 Fib).