Ethereum Ethereum is up by a very solid 27% over the past week of trading as the cryptocurrency makes its way back to the 00 level. The cryptocurrency was trading inside an ascending triangle pattern since hitting resistance at 50 (bearish .618 Fib) earlier in August. On Tuesday, ETH finally surged beyond 50 to reach 00. It continued higher throughout the week and continued to surge today to reach the current 75 resistance (1.272 Fib Extension). Looking ahead, the first strong resistance lies at 00. This is followed by 60 (1.414 Fib Extension – blue), 00 (1.414 Fib Extension – orange), and 00 (1.618 Fib Extension – blue). Added resistance lies at 35 (1.618 Fib Extension – orange) and 00. On the other side, the first support lies at 00.
Topics:
Yaz Sheikh considers the following as important: ADABTC, ADAUSD, Cardano (ADA) Price, DOTBTC, DOTUSD, DOTUSDT, ETH Analysis, ETHBTC, Ethereum (ETH) Price, ethusd, Polkadot (DOT) Price, Price Analysis, Ripple (XRP) Price, Solana (SOL) Price, SOLBTC, SOLUSD, XRP Analysis, xrpbtc, xrpusd
This could be interesting, too:
Jordan Lyanchev writes Ripple’s (XRP) Surge to Triggers Over Million in Short Liquidations
Jordan Lyanchev writes Cardano (ADA) Surpasses Dogecoin After 55% Surge
Jordan Lyanchev writes Trump Confirms Work on Strategic Crypto Reserve: XRP, ADA, SOL Included
Mandy Williams writes Ethereum Derivatives Metrics Signal Modest Downside Tail Risk Ahead: Nansen
Ethereum
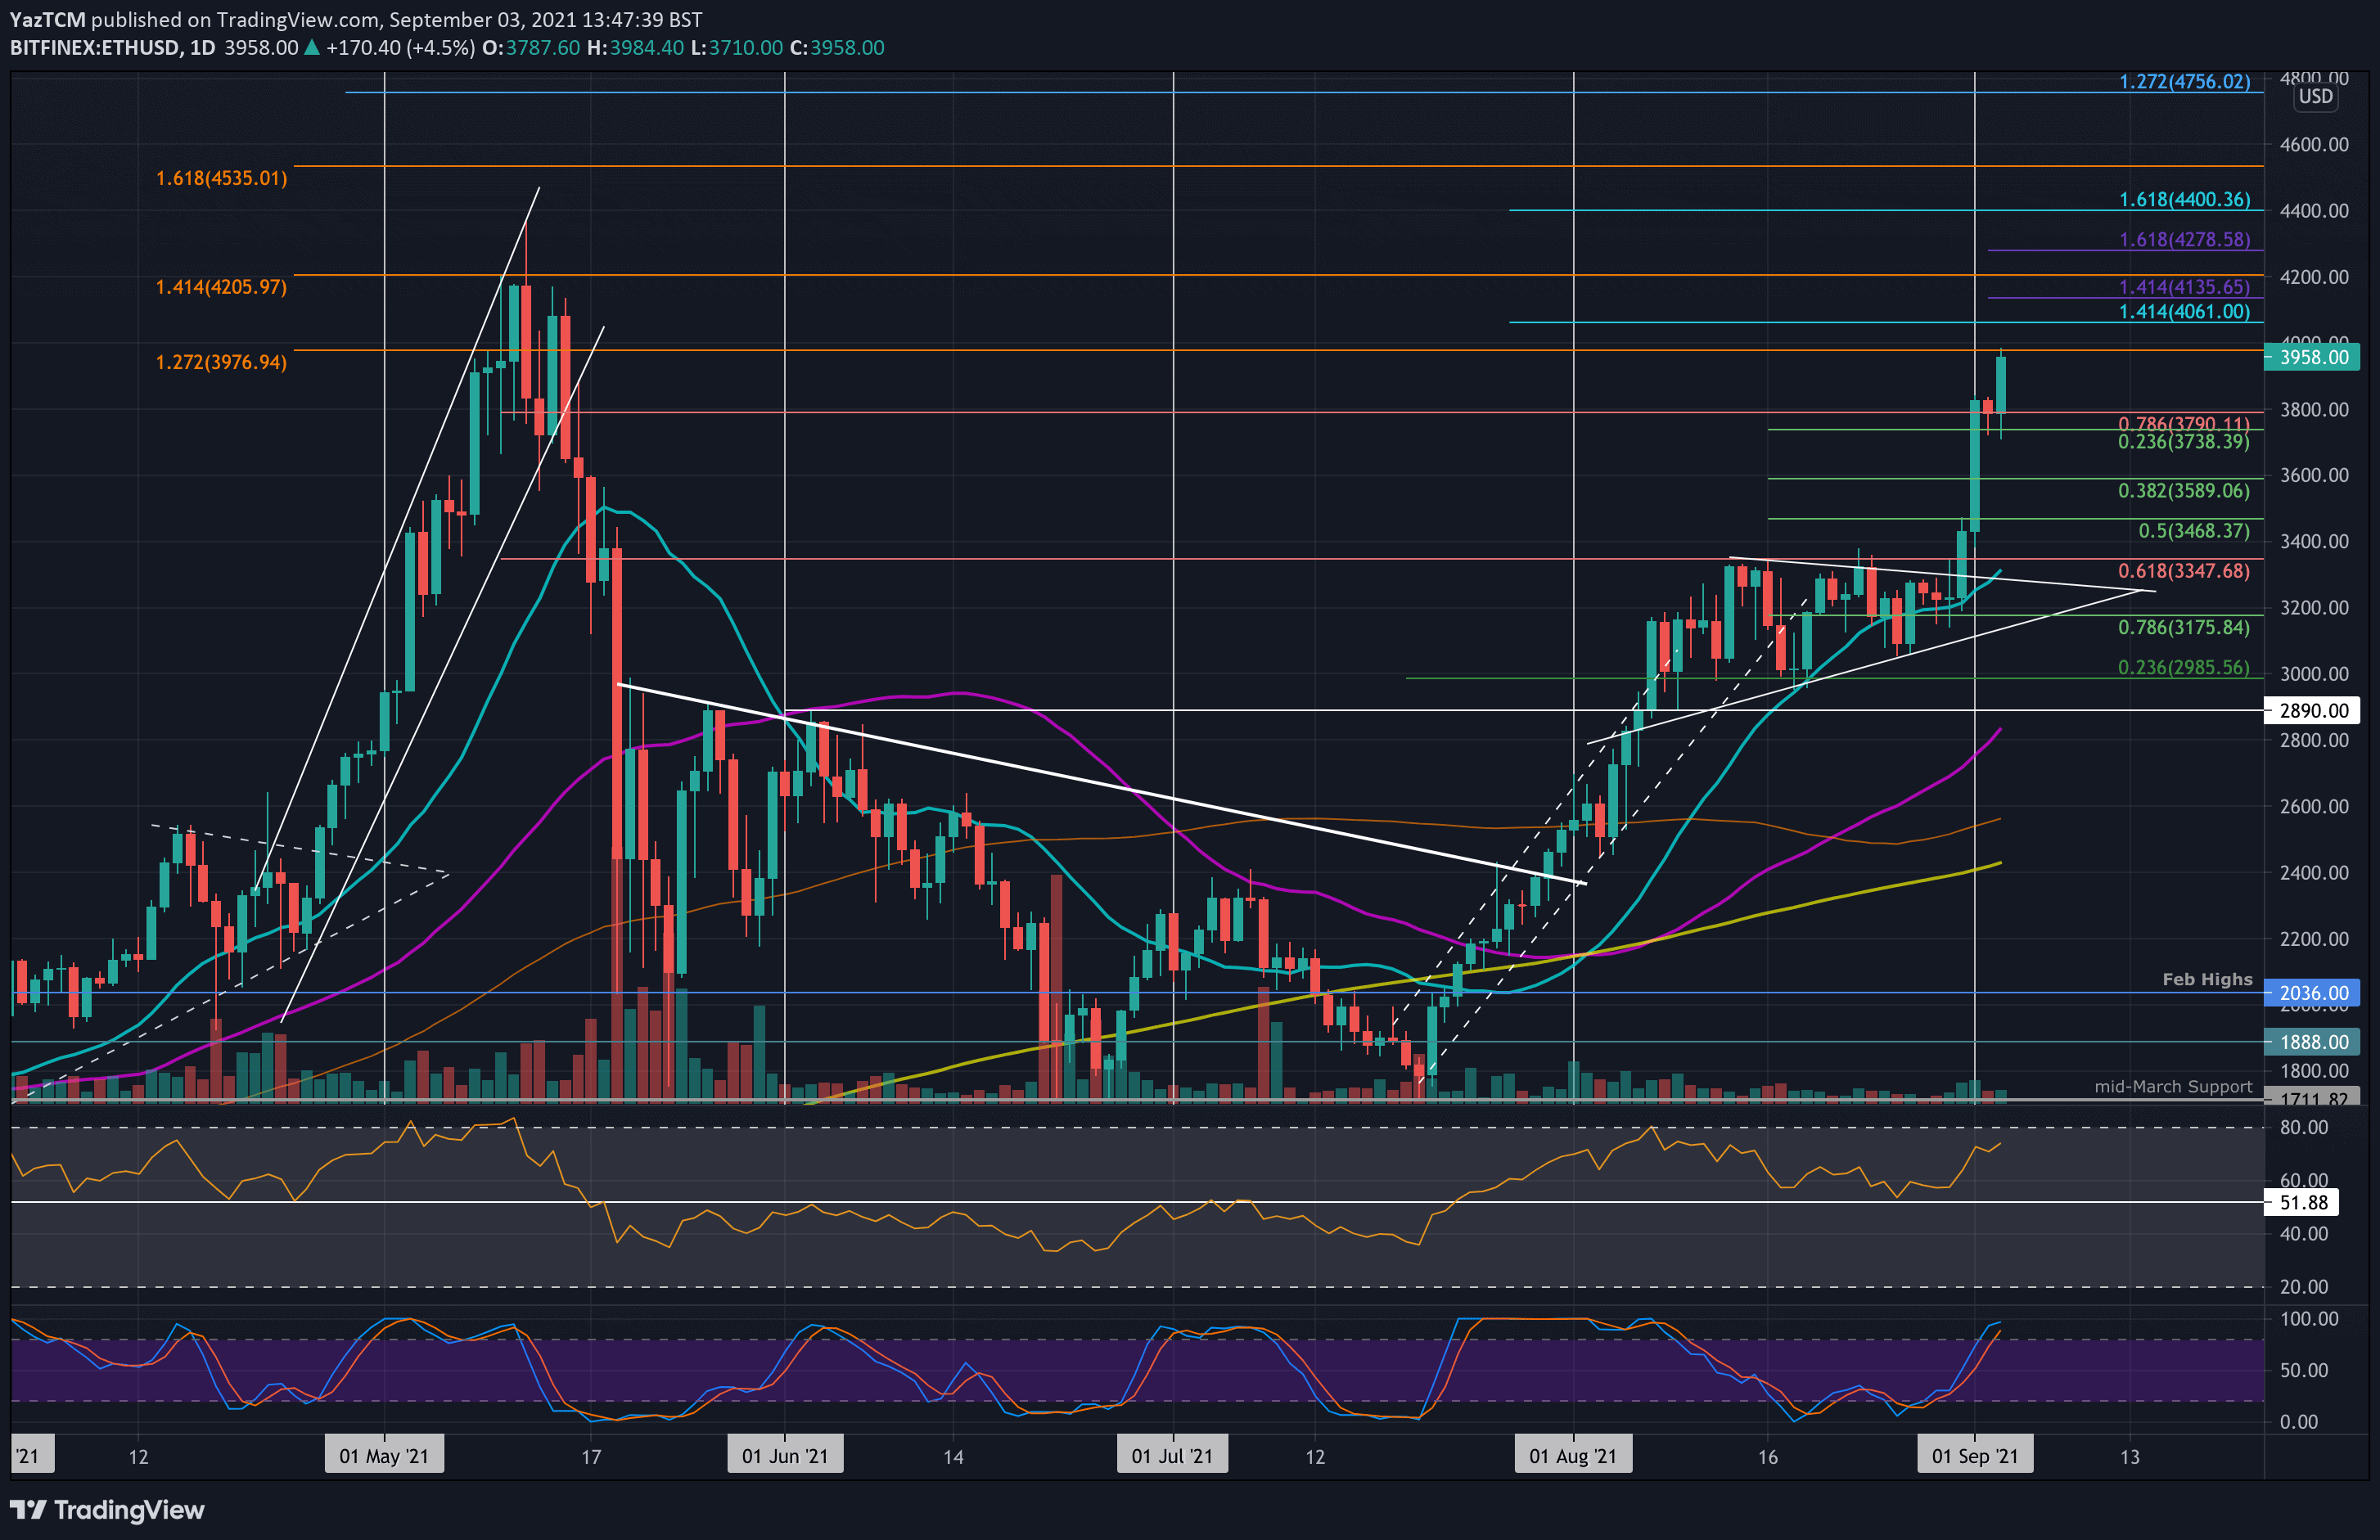
Ethereum is up by a very solid 27% over the past week of trading as the cryptocurrency makes its way back to the $4000 level. The cryptocurrency was trading inside an ascending triangle pattern since hitting resistance at $3350 (bearish .618 Fib) earlier in August.
On Tuesday, ETH finally surged beyond $3350 to reach $3400. It continued higher throughout the week and continued to surge today to reach the current $3975 resistance (1.272 Fib Extension).
Looking ahead, the first strong resistance lies at $4000. This is followed by $4060 (1.414 Fib Extension – blue), $4200 (1.414 Fib Extension – orange), and $4400 (1.618 Fib Extension – blue). Added resistance lies at $4535 (1.618 Fib Extension – orange) and $4600.
On the other side, the first support lies at $3800. This is followed by $3740 (.236 Fib), $3590 (.382 Fib), $3470 (.5 Fib0, and $3350 (20-day MA).
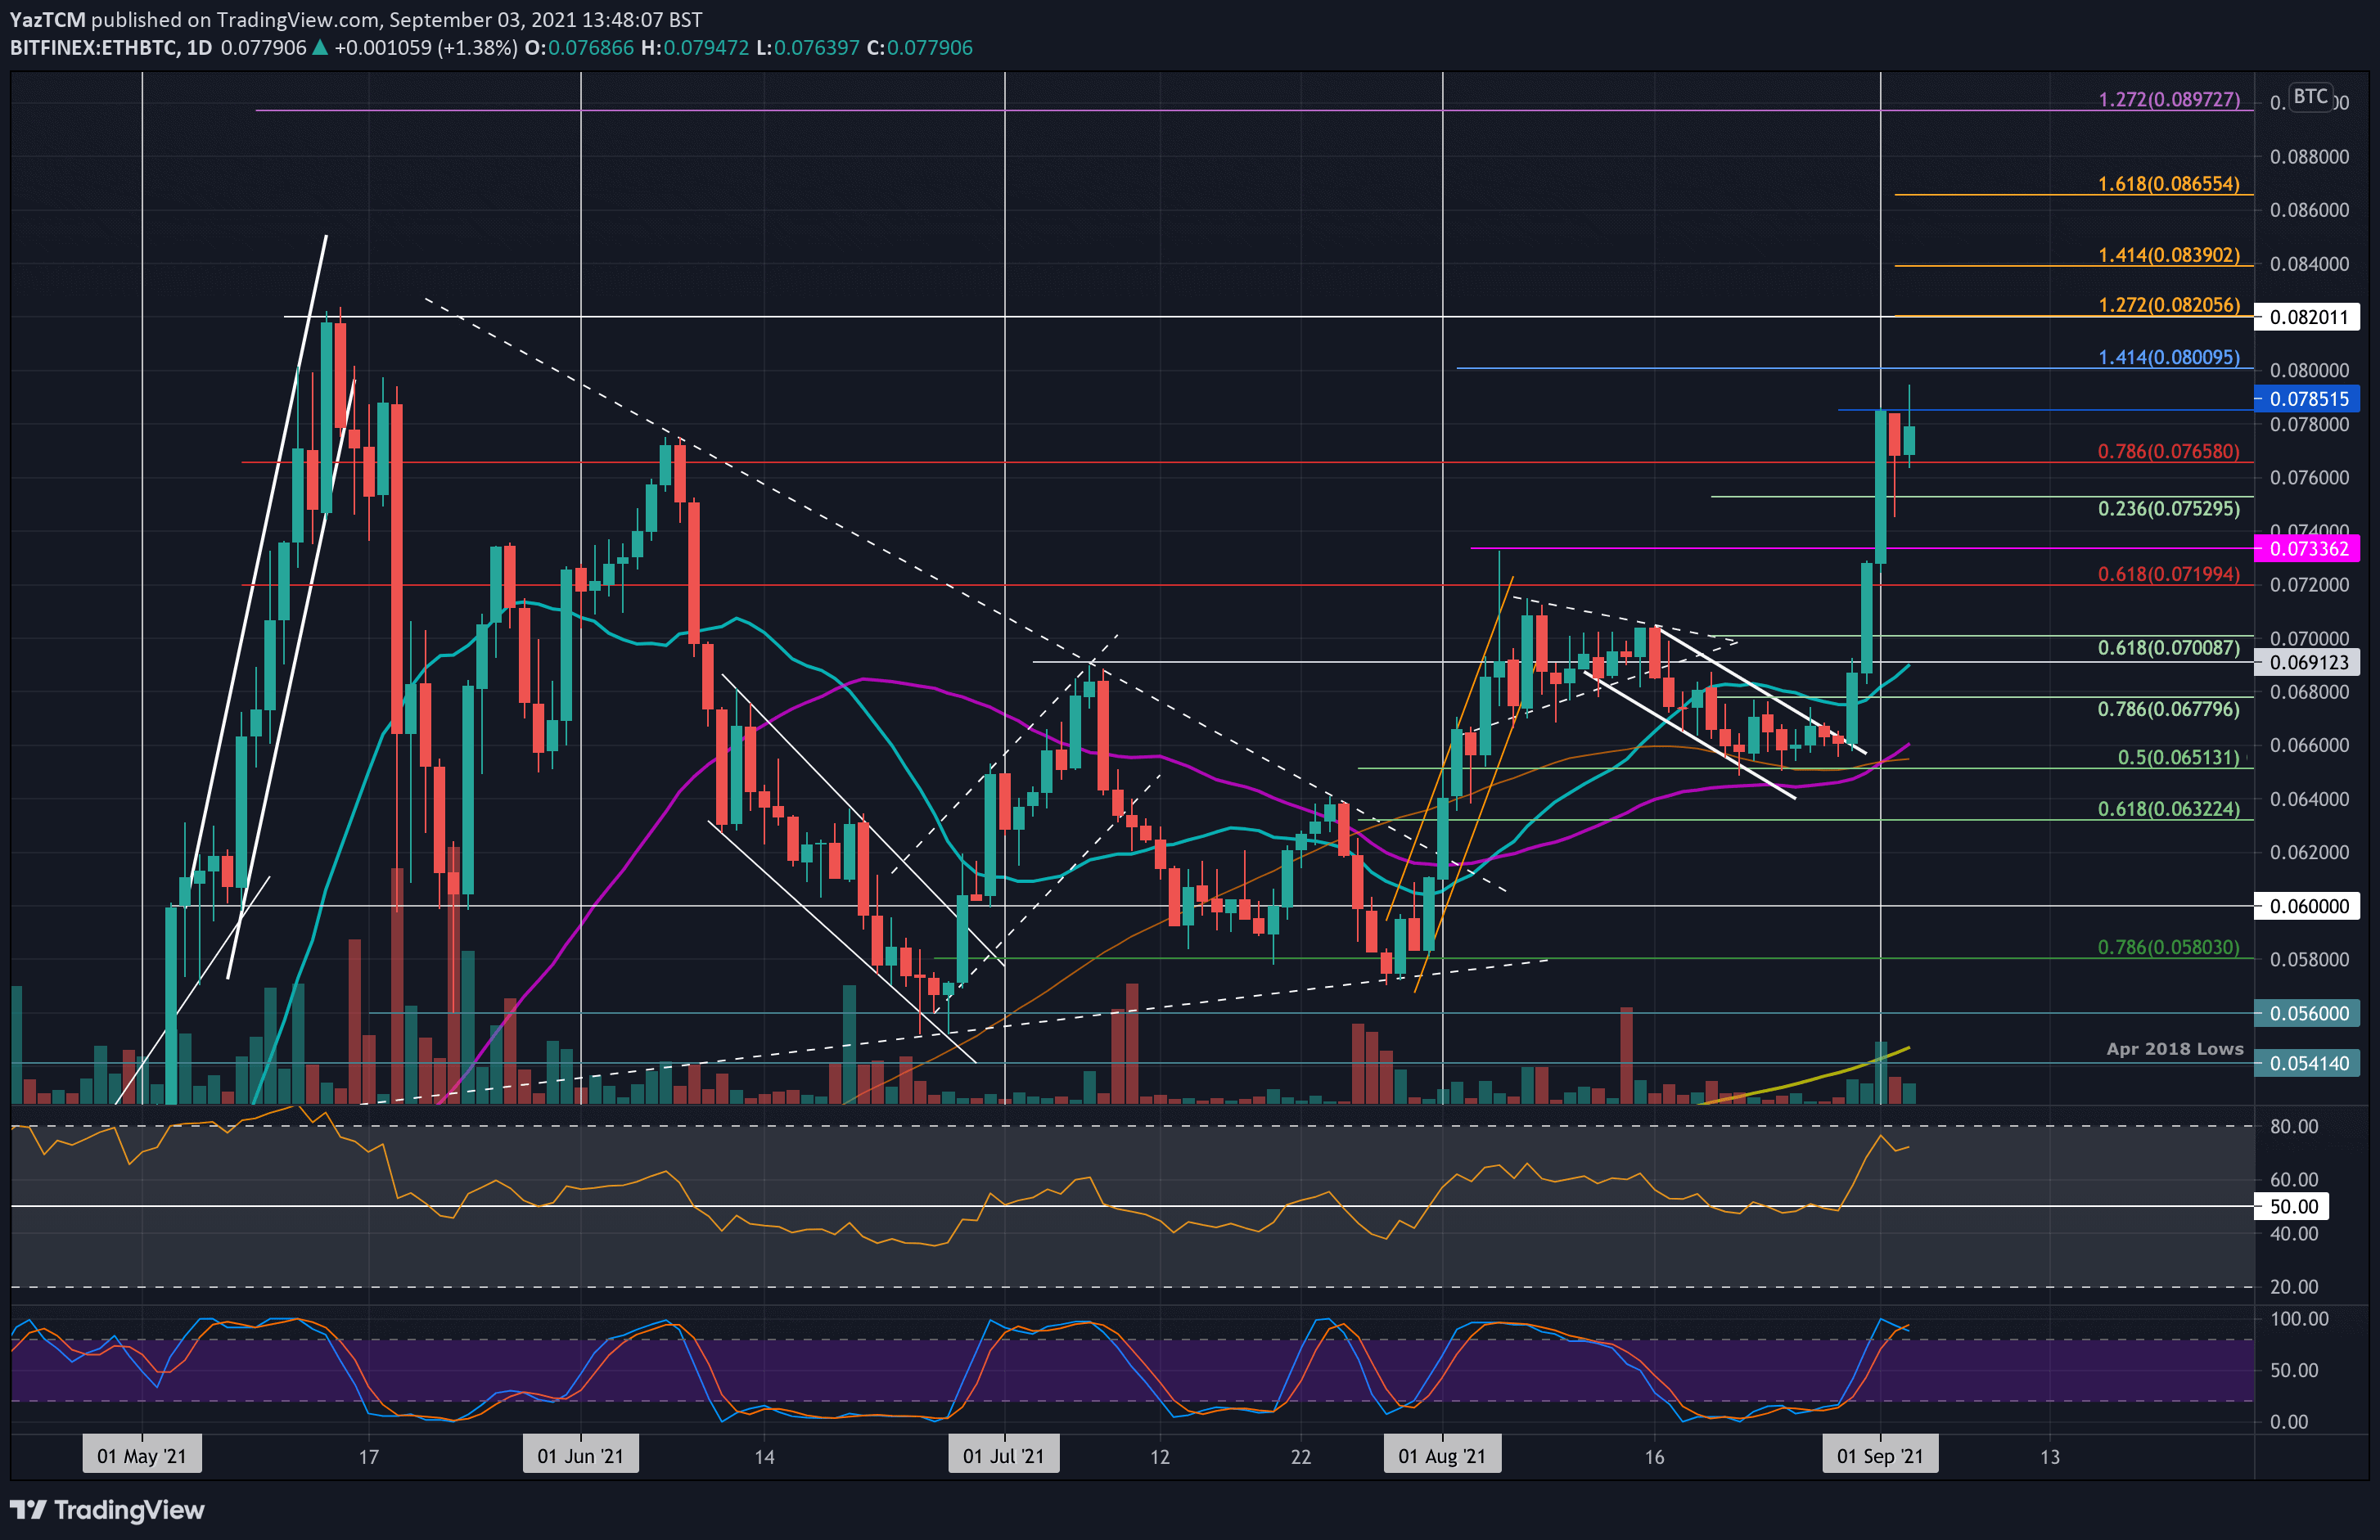
ETH is also performing well against BTC this week as it hits three-month highs at around 0.0785 BTC. The coin was trading inside a descending price channel since mid-August when it failed to break 0.07 BTC.
On Monday, ETH finally broke above this channel and started to climb beyond the 20-day MA. By Wednesday, ETH had reached as high as 0.0785 BTC to set the new three-month high. It has since dropped from the weekly high but is doing well to hold support around 0.0765 BTC.
Looking ahead, once the bulls break 0.0785 BTC, the first resistance lies at 0.08 BTC. This is followed by 0.082 BTC (May highs), 0.0839 BTC (1.414 Fib Extension), 0.0865 BTC (1.618 Fib Extension), and 0.088 BTC.
On the other side, the first support lies at 0.0765 BTC. This is followed by 0.0752 BTC (.236 Fib), 0.0733 BTC (August highs), 0.072 BTC, 0.07 BTC (.618 Fib).
Ripple
XRP is up by a respectable 17% this week as the cryptocurrency breaks back above the 2018 highs at $1.25. The coin was trading inside a symmetrical triangle pattern throughout the second half of August and broke toward the upside of this triangle on Tuesday.
Since breaking the triangle, XRp started to push higher to meet the current $1.28 resistance (beraish .618 Fib) and is still beneath the August highs of $1.36 (1.618 Fib Extension).
Looking ahead, if the buyers break $1.30, the first resistance lies at $1.36. This is followed by resistance at $1.50 (bearish .786 Fib), $1.55 (1.414 Fib Extension), $1.62 (bearish .886 Fib), and $1.72.
On the other side, the first support lies at $1.25 (Feb 2018 highs). This is followed by $1.20 (20-day MA), $1.10 (.382 Fib), $1.00, and $0.928 (.618 Fib & 50-day MA).

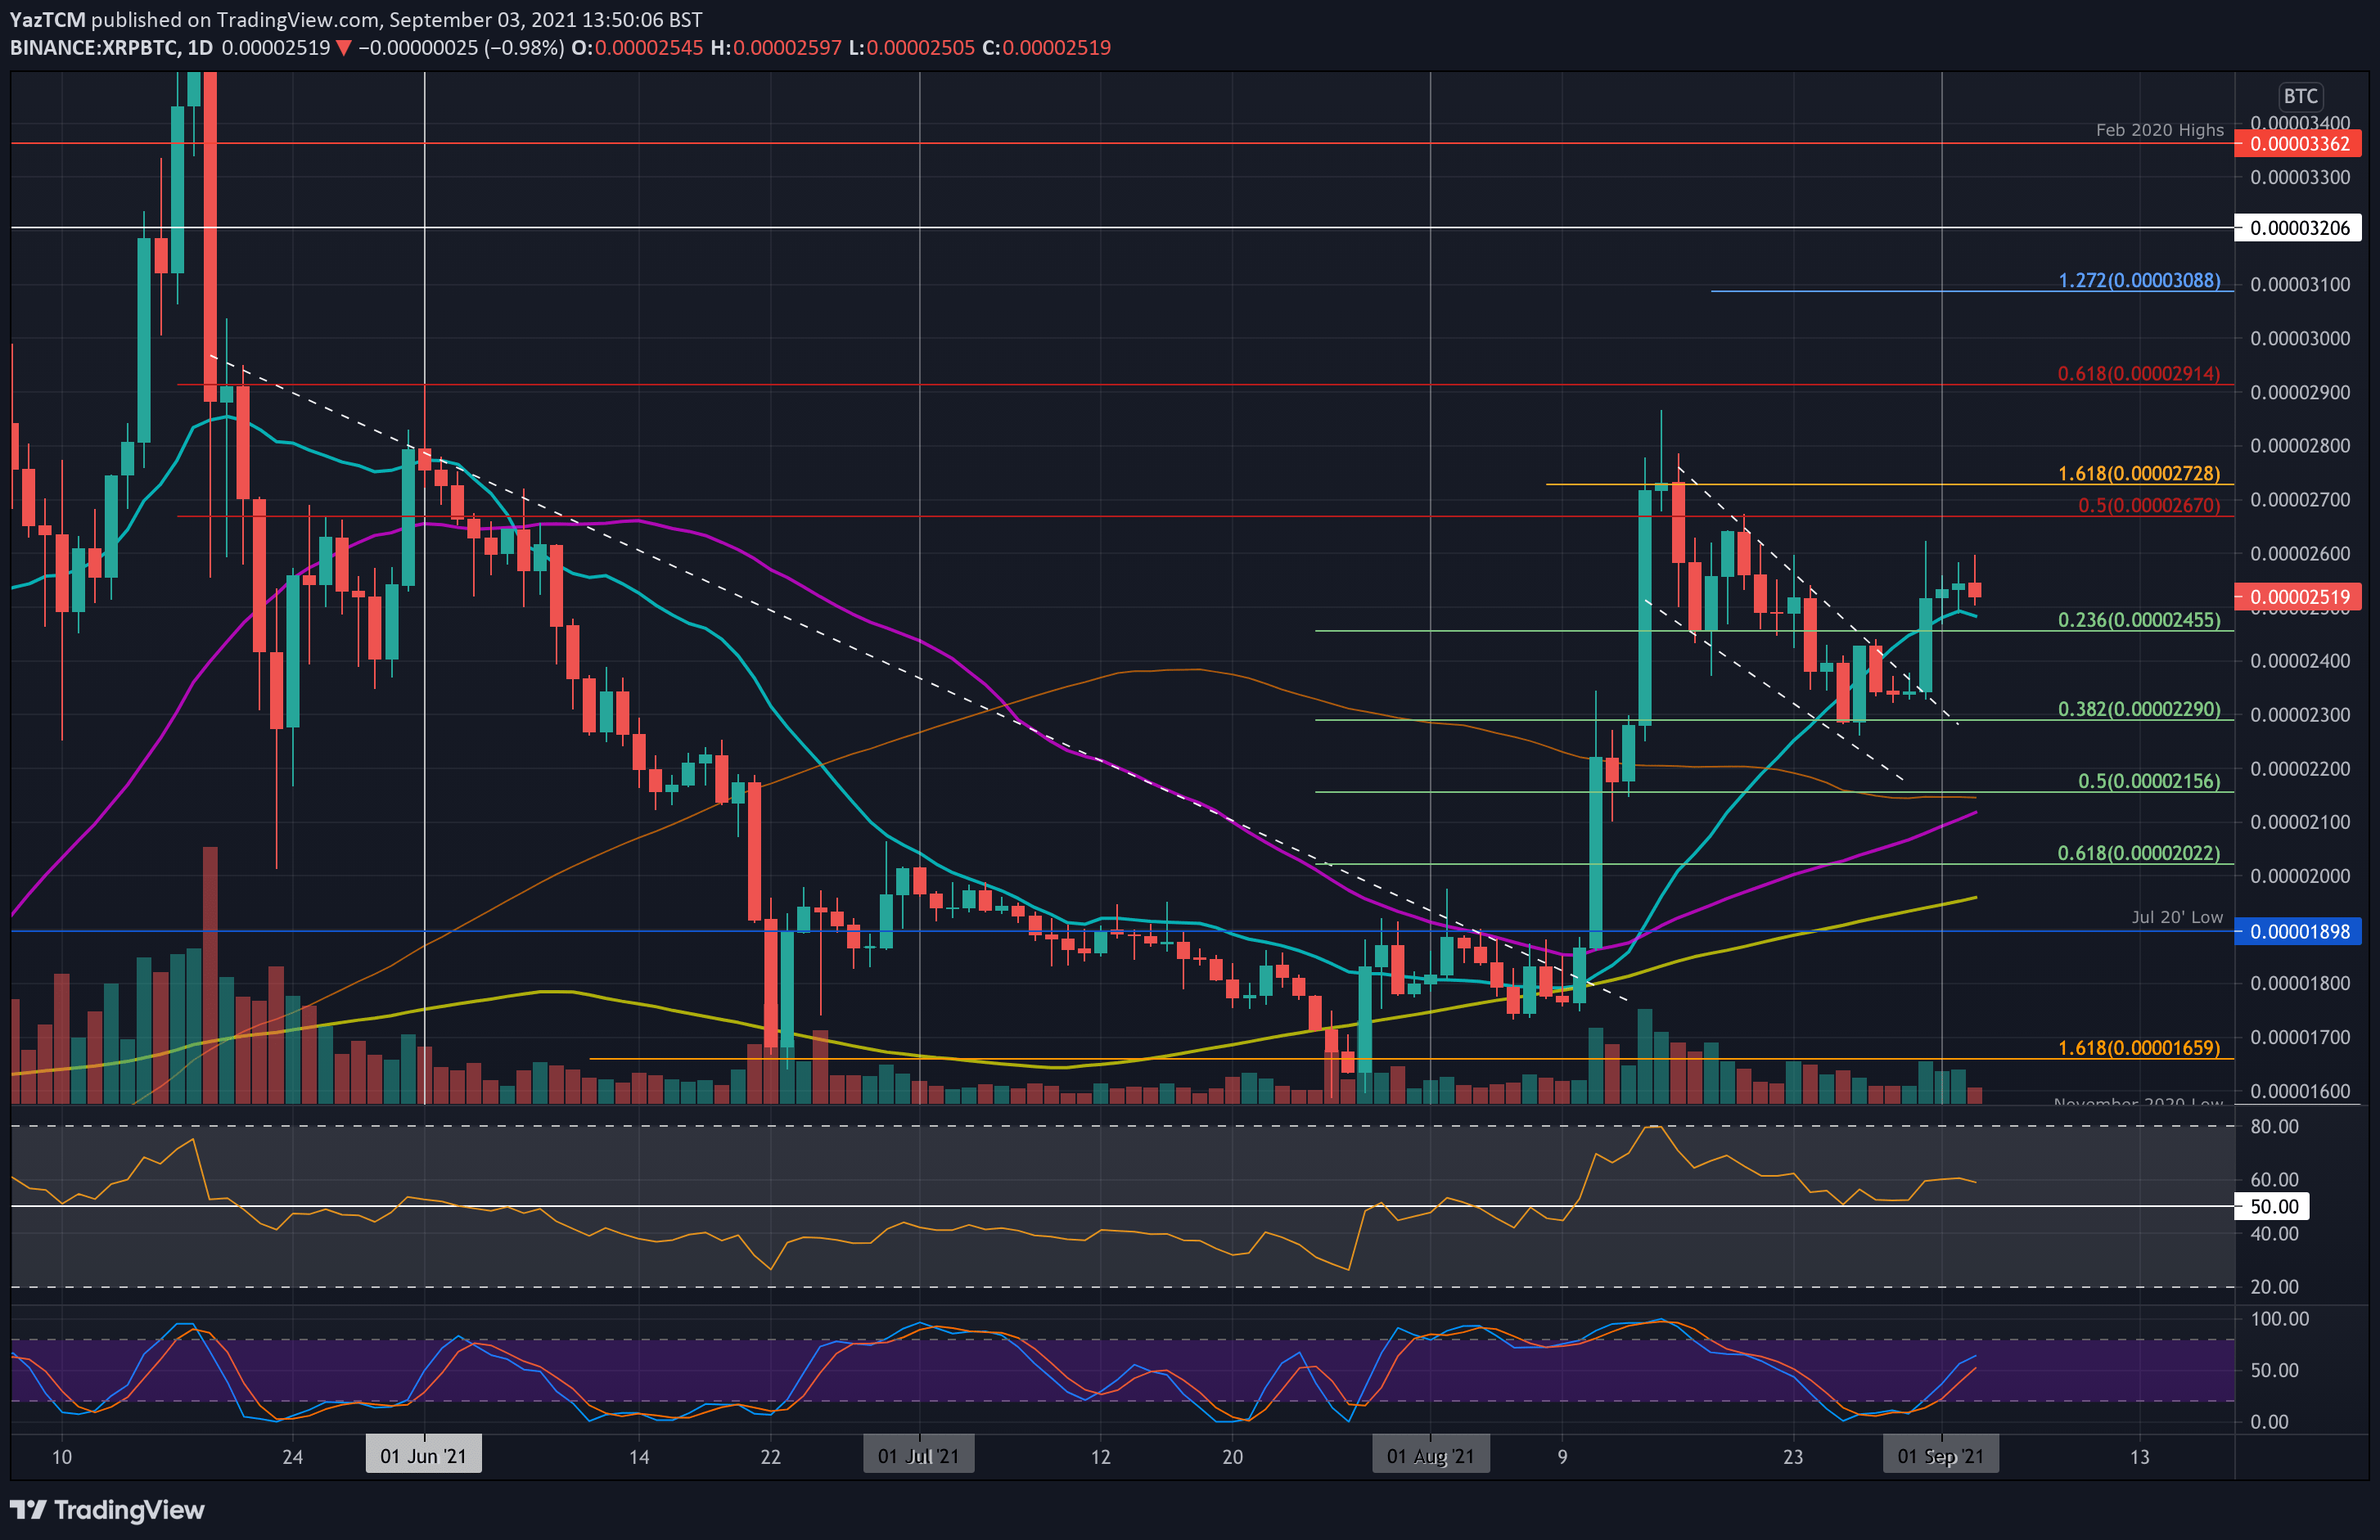
XRP is pushing higher against BTC this week as it breaks above the 20-day MA at around 2500 SAT. The cryptocurrency was trading in a descending wedge formation but found support at 2290 SAT (.382 Fib) toward the end of August.
On Tuesday, XRP surged above the descending wedge and surged beyond the 20-day MA. XRP managed to hit 2600 SAT so far during the week but is struggling to push beyond this level.
Looking ahead, the first resistance lies at 2600 SAT. This is followed by 2730 SAT (1.618 Fib Extension), 2800 SAT, 2915 SAT (bearish .618 Fib), and 3000 SAT.
On the other side, the first support lies at 2500 SAT (20-day MA). This is followed by 2290 SAT (.382 Fib)m 2150 SAT (.5 Fib & 100-day MA), and 2000 SAT.
Cardano
ADA is up by a total of 15.6% this week as the coin set a new ATH price at $3.16. The cryptocurrency has been trading inside an ascending broadening wedge since the first week of August, which allowed the coin to reach as high as $2.95.
This week, ADA found support at $2.75 and bounced from the lower boundary of the wedge on Wednesday. Yesterday, it spiked above $3.00 to set the new ATH but failed to close beyond $3.00. Today, ADA still sits beneath $3.00 as the buyers battle to gain support above the level.
Looking ahead, if the bulls break $3, the first strong resistance lies at $3.20. This is followed by $3.42 (1.272 Fib Extension – purple), $3.66 (1.414 Fib Extension – purple), $3.85 (1.414 Fib Extension – blue), and $4.00.
On the other side, the first support lies at $2.90 (lower angle of the wedge). This is followed by $2.5 (.236 Fib), $2.60 (20-day MA), $2.50 (.382 Fib), and $2.25 (.5 Fib).

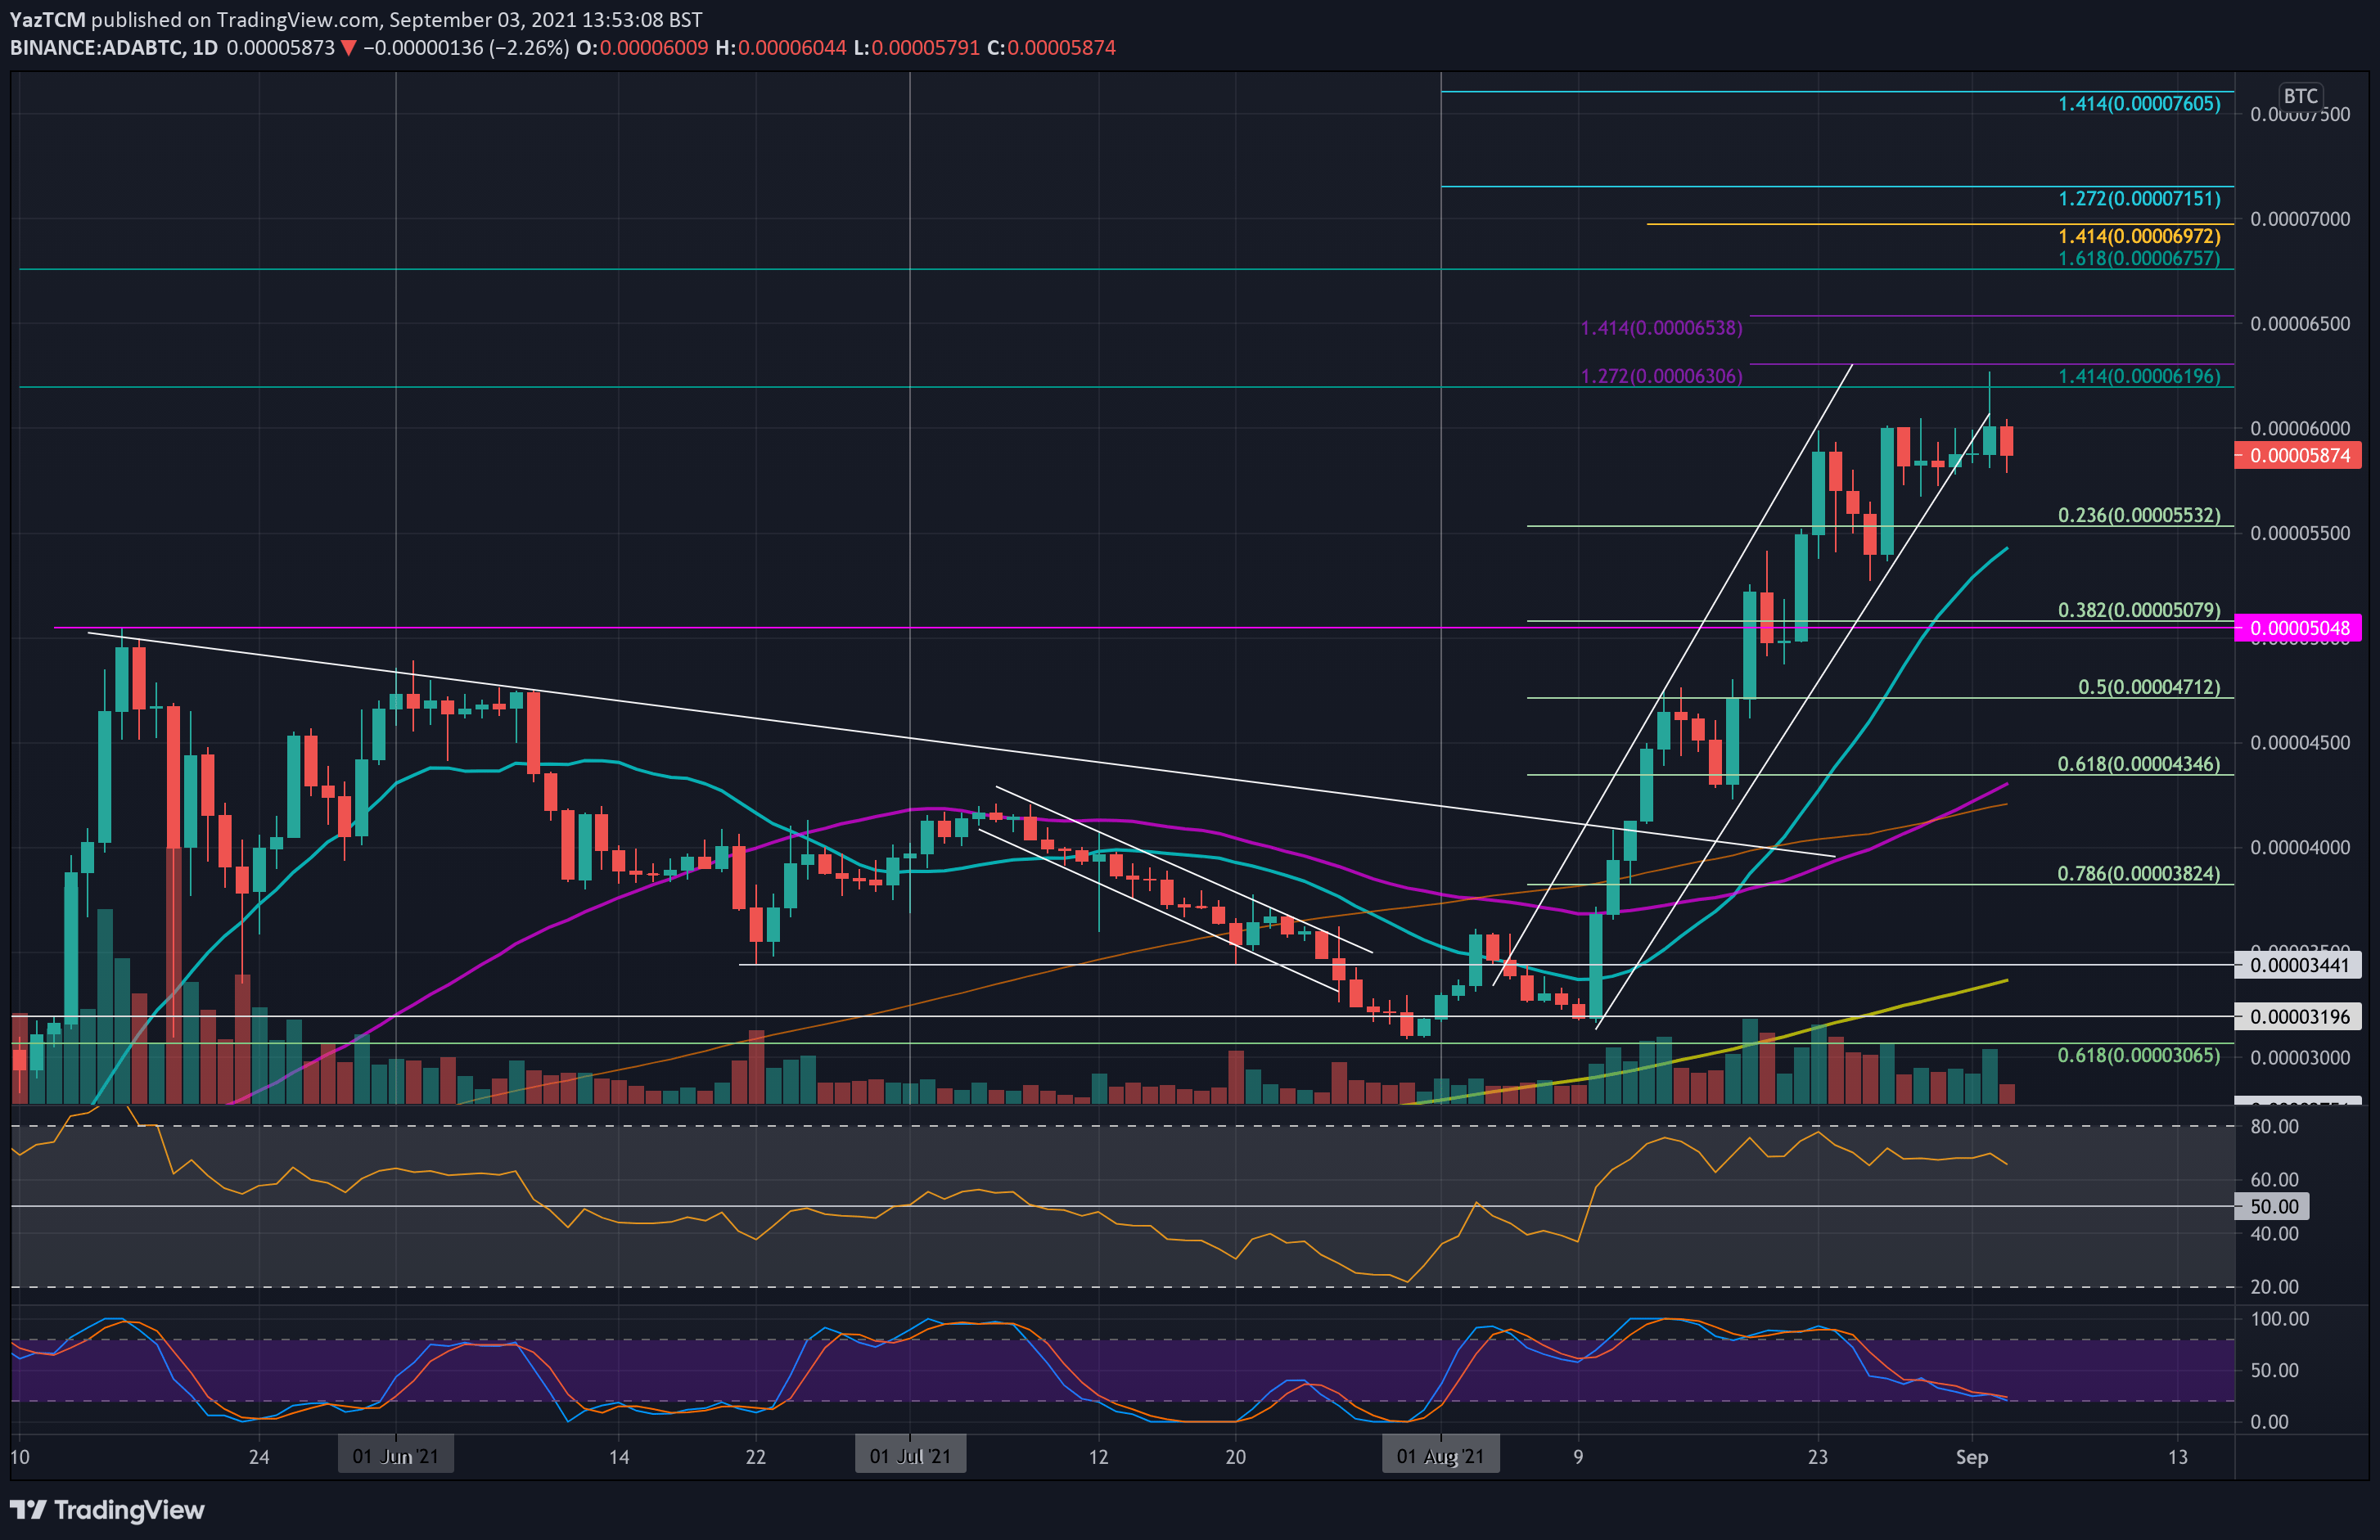
ADA is performing well against BTC but continues to struggle to close above the 6000 SAT resistance. It reached this resistance for the first time earlier in August and has struggled to close a daily candle above it after making numerous attempts.
Yesterday, ADA did spike above 6000 SAT but failed again to close above it. It also closed beneath the ascending price channel it was trading within – but a break above 6000 SAT would allow the bull swing to continue.
Looking ahead, the first resistance lies at 6000 SAT. This is followed by 6300 SAT (1.272 Fib Extension), 6540 SAT (1.414 Fib Extension), 6760 SAT (1.618 Fib Extension), and 7000 SAT.
On the other side, the first support lies at 5500 SAT (.236 Fib & 20-day MA). This is followed by 5100 SAT .382 Fib), 5000 SAT, and 4710 SAT (.5 Fib).
Solana
SOL saw a stunning 84% price hike this week as the cryptocurrency set a new ATH price around $145. SOL has been trading inside a steep ascending price channel since mid-August and has climbed higher within its boundaries ever since.
On Monday, SOL broke beyond the $100 level as it reached $110. The resistance at $110 was cleared yesterday as SOL hit $128 (1.414 Fib Extension). Today, SOL continued to climb to reach the $145 resistance (1.618 Fib Extension).
Looking ahead, the first resistance above $145 lies at $150. This is followed by $170 (1.272 Fib Extension), $180 (1.414 Fib Extension), $190, and $200.
On the other side, the first support lies at $128, This is followed by $117 (.236 Fib), $110, $100 (.382 Fib), $90, and $85 (.5 Fib & 20-day MA).

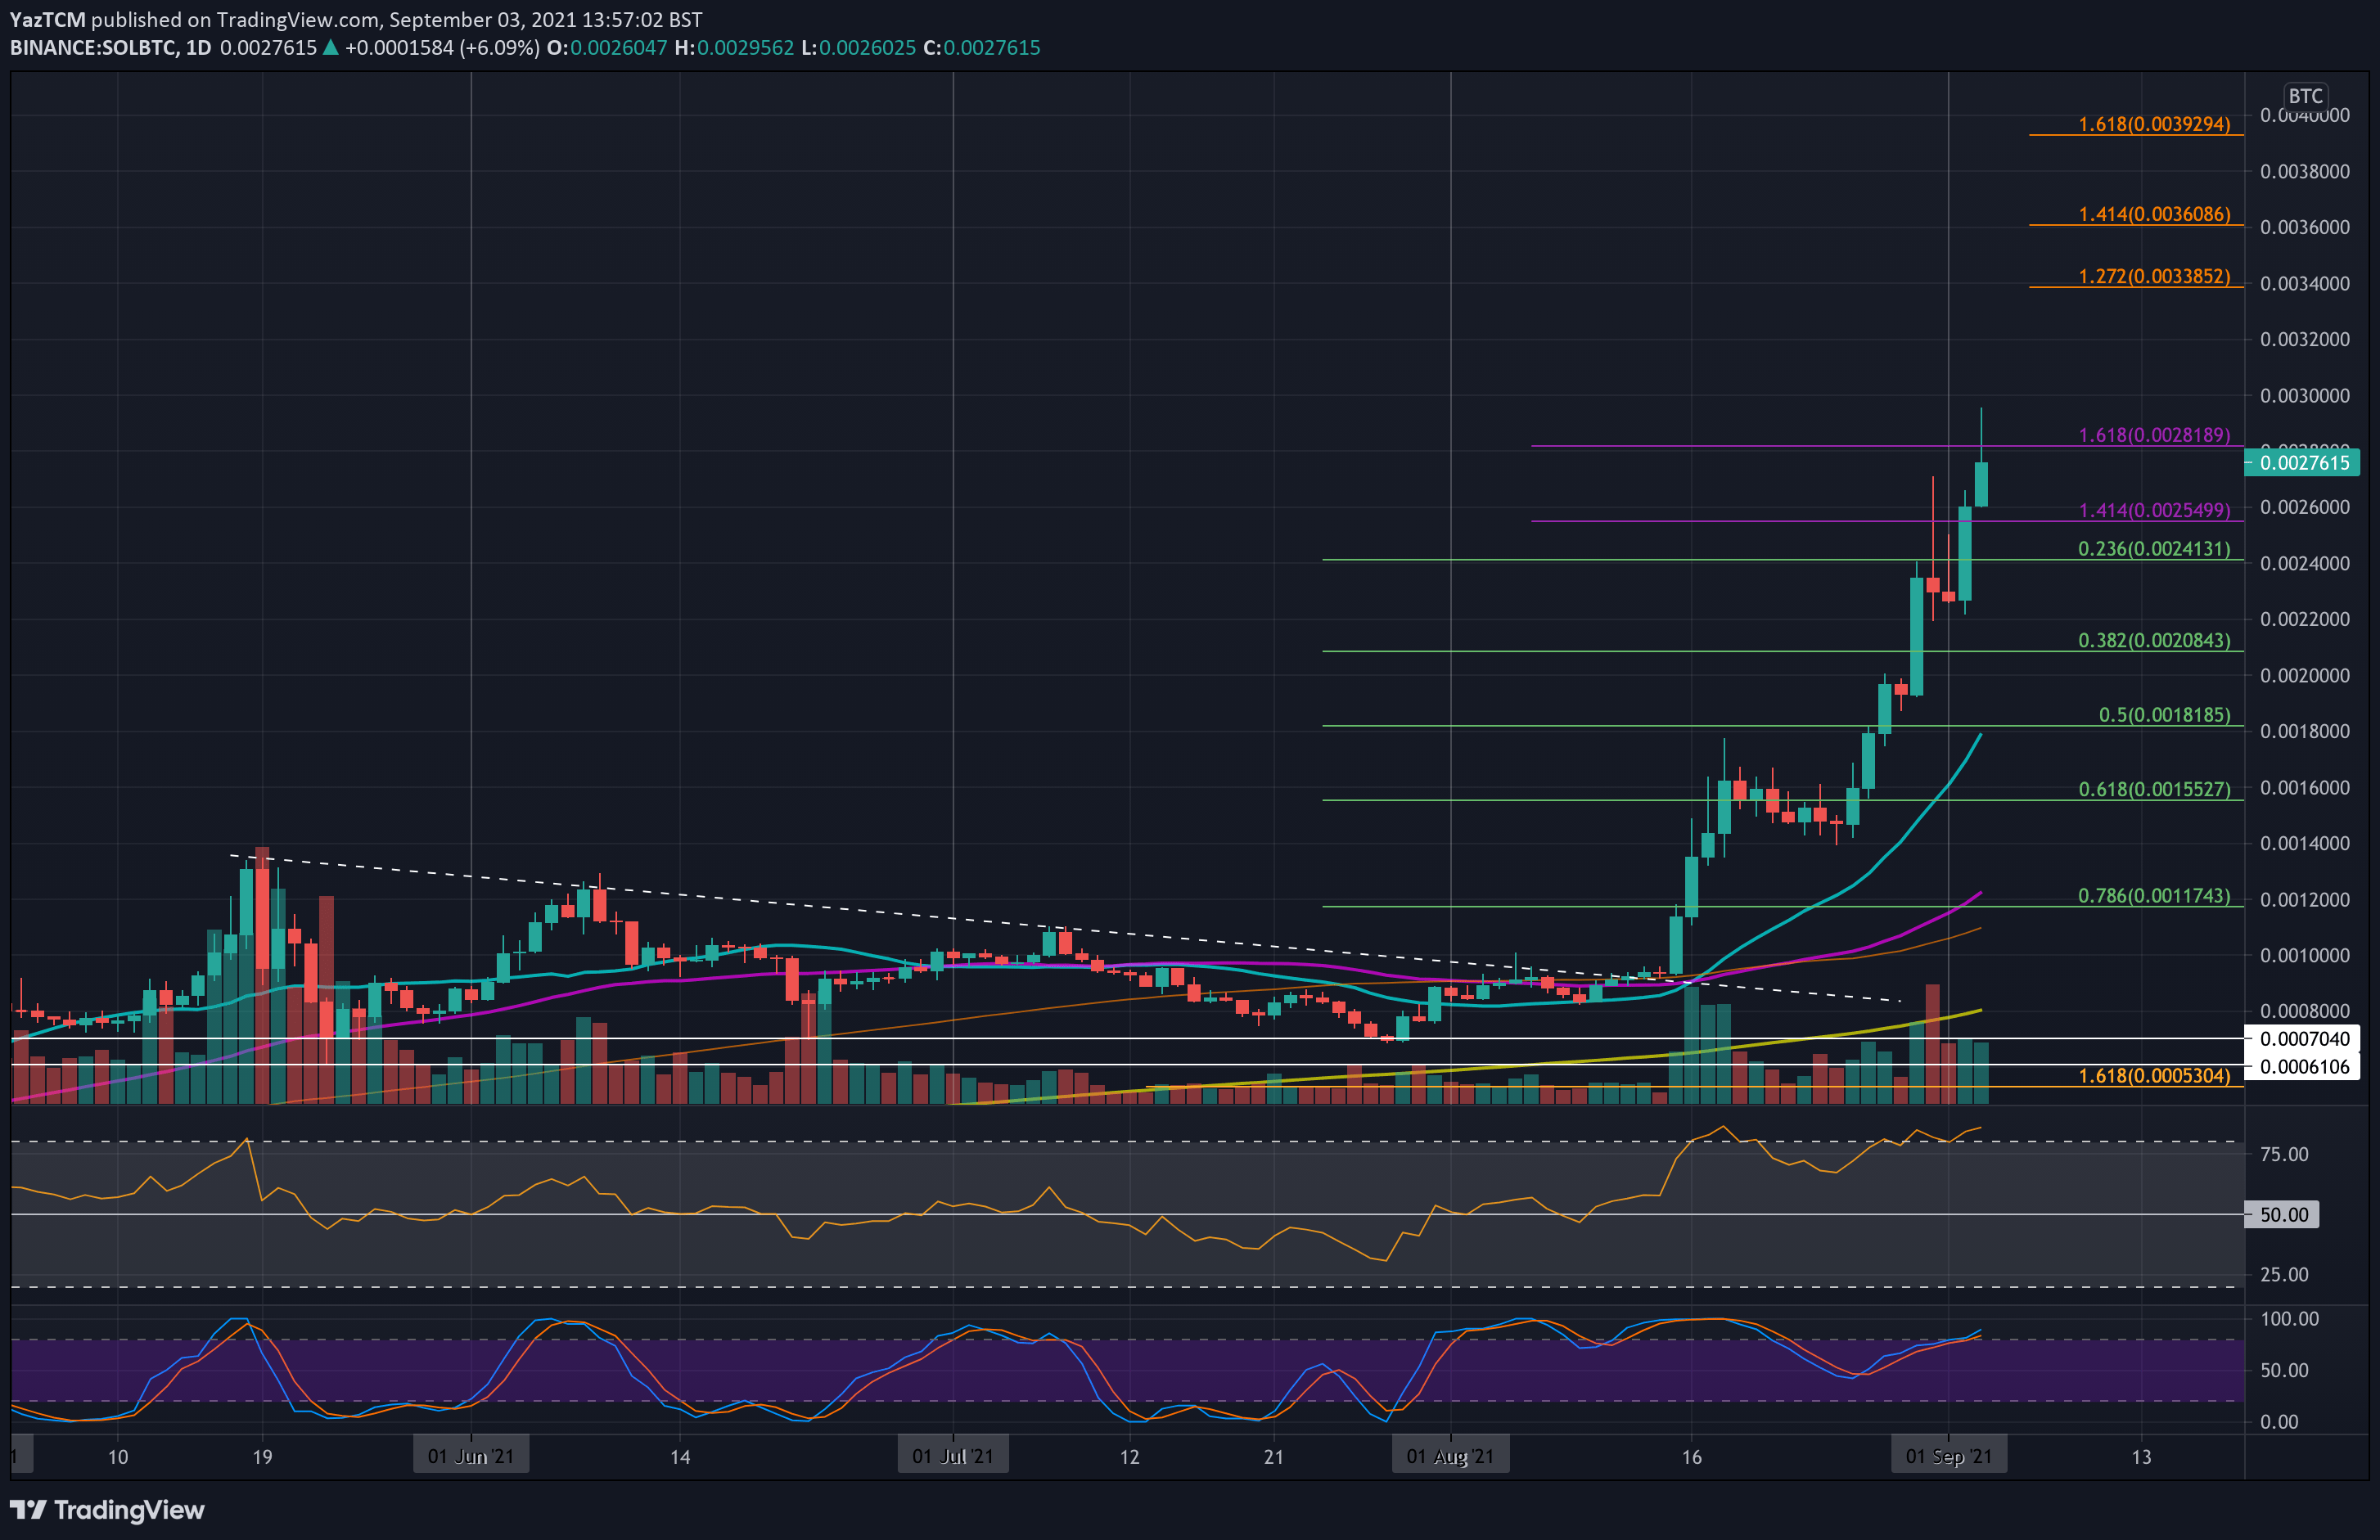
SOL also continues to perform well against BTC as it nearly hits 0.003 BTC this week. It had rebounded from 0.0014 BTC at the end of August to meet 0.0022 BTC at the start of September.
The cryptocurrency surged from 0.0024 BTC yesterday to meet 0.0026 BTC. It continued further today to break 0.0026 BTC and reach almost as high as 0.003 BTC.
Looking ahead, the first resistance lies at 0.00282 BTC (1.618 Fib Extension). This is followed by 0.003 BTC, 0.0032 BTC, 0.00338 BTC (1.272 Fib Extension), and 0.0036 BTC (1.414 Fib Extension).
On the other side, the first support lies at 0.0026 BTC. This is followed by 0.00241 BTC (.236 Fib), 0.0022 BTC, 0.002 BTC, and 0.00181 BTC (.5 Fib & 20-day MA).
Polkadot
DOT is up by a strong 35% over the past week of trading as the coin breaks above $30. It was trading at around $25 on Monday but went on to surge above the 200-day MA at $27.50 on Tuesday and reached as high as $32.61 (1.272 Fib Extension).
DOT has climbed higher from here but is struggling to gain ground above $34.
The first resistance above $34 lies at $35.30 (bearish .618 Fib). This is followed by $38.66 (1.618 Fib Extension), $40, $42.10 (bearish .786 Fib), and $46.12 (bearish .886 Fib).
On the other side, the first support lies at $30. This is followed by $28.85 (.236 Fib), $27.50 (200-day MA), $25.30 (.382 Fib), and $22.45 (.5 Fib).

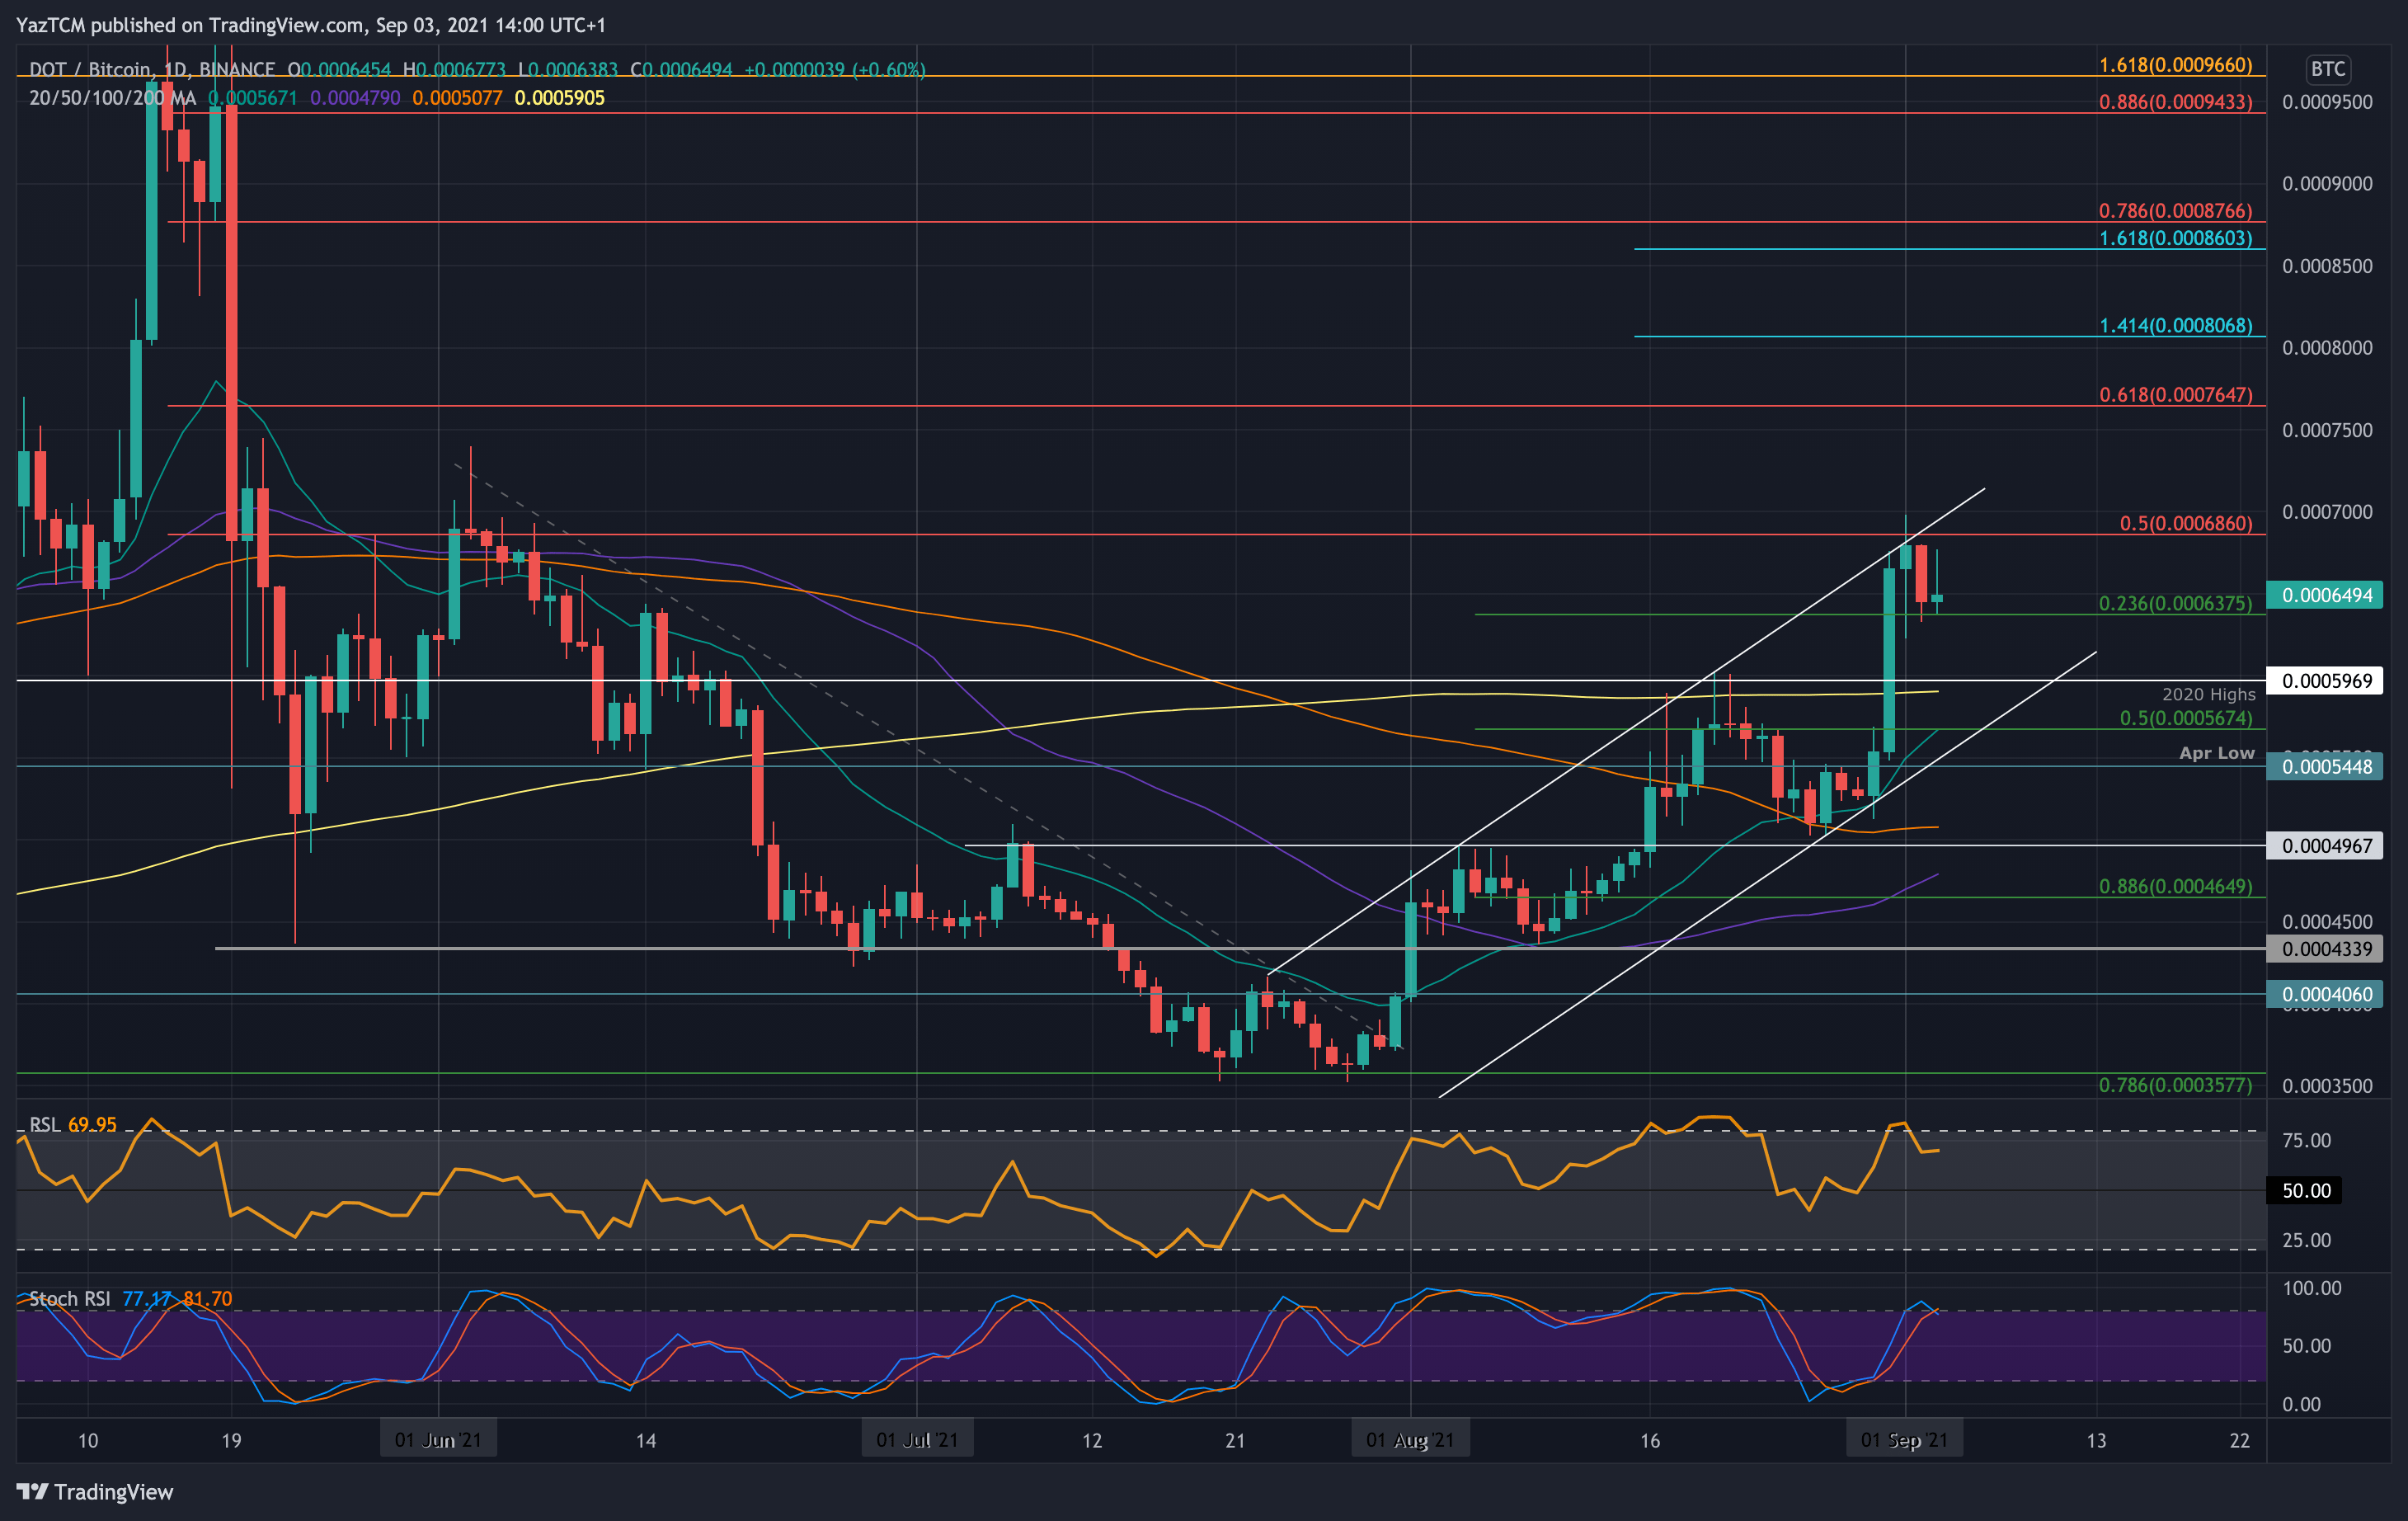
DOT is also performing very well against BTC as it trades around 0.00065 BTC. The coin is trading inside an ascending price channel and used the support of the lower boundary, around 0.0005 BTC, to rebound from at the start of the week.
By Wednesday, DOT reached resistance at 0.000686 BTC (bearish .5 Fib & upper boundary of the price channel). It has since dropped from there but is holding support at 0.0006375 BTC (.236 Fib).
Looking ahead, the first resistance lies at 0.000686 BTC (bearish .5 Fib). This is followed by 0.0007 BTC, 0.000764 BTC (bearish .618 Fib), 0.0008 BTC, and 0.0008600 BTC (1.618 Fib Extension).
On the other side, the first support lies at 0.0006375 BTC (.236 Fib). This is followed by 0.0006 BTC (2020 high), 0.0005675 BTC (.5 Fib), 0.00055 BTC (April lows), and 0.0005 BTC (100-day MA).