ETH/USD – Market Returns To January 2018 Previous ATHKey Support Levels: 00, 91, 50, 00.Key Resistance Levels: 00, 65, 00, 00.Ethereum is now down by a total of 30% over the past seven days of trading. The cryptocurrency had spiked above 00 only last week as it hit the upper boundary of the following marked ascending price channel. From there, the coin retraced, broke down the price channel and lost over 0 of its value.It happened on Monday, that ETH price closed the daily candle beneath the ascending price channel, confirming the breakdown. It then continued to slide over the week until support was met at the previous ATH price, from January 2018, at around 00 – 40.Today, with another 7% price drop, Ethereum lost the previous ATH price as it dropped
Topics:
Yaz Sheikh considers the following as important: ETH Analysis, ETHBTC, Ethereum (ETH) Price, ethusd
This could be interesting, too:
Mandy Williams writes Ethereum Derivatives Metrics Signal Modest Downside Tail Risk Ahead: Nansen
Jordan Lyanchev writes Weekly Bitcoin, Ethereum ETF Recap: Light at the End of the Tunnel for BTC
CryptoVizArt writes Will Weak Momentum Drive ETH to .5K? (Ethereum Price Analysis)
Jordan Lyanchev writes Bybit Hack Fallout: Arthur Hayes, Samson Mow Push for Ethereum Rollback
ETH/USD – Market Returns To January 2018 Previous ATH
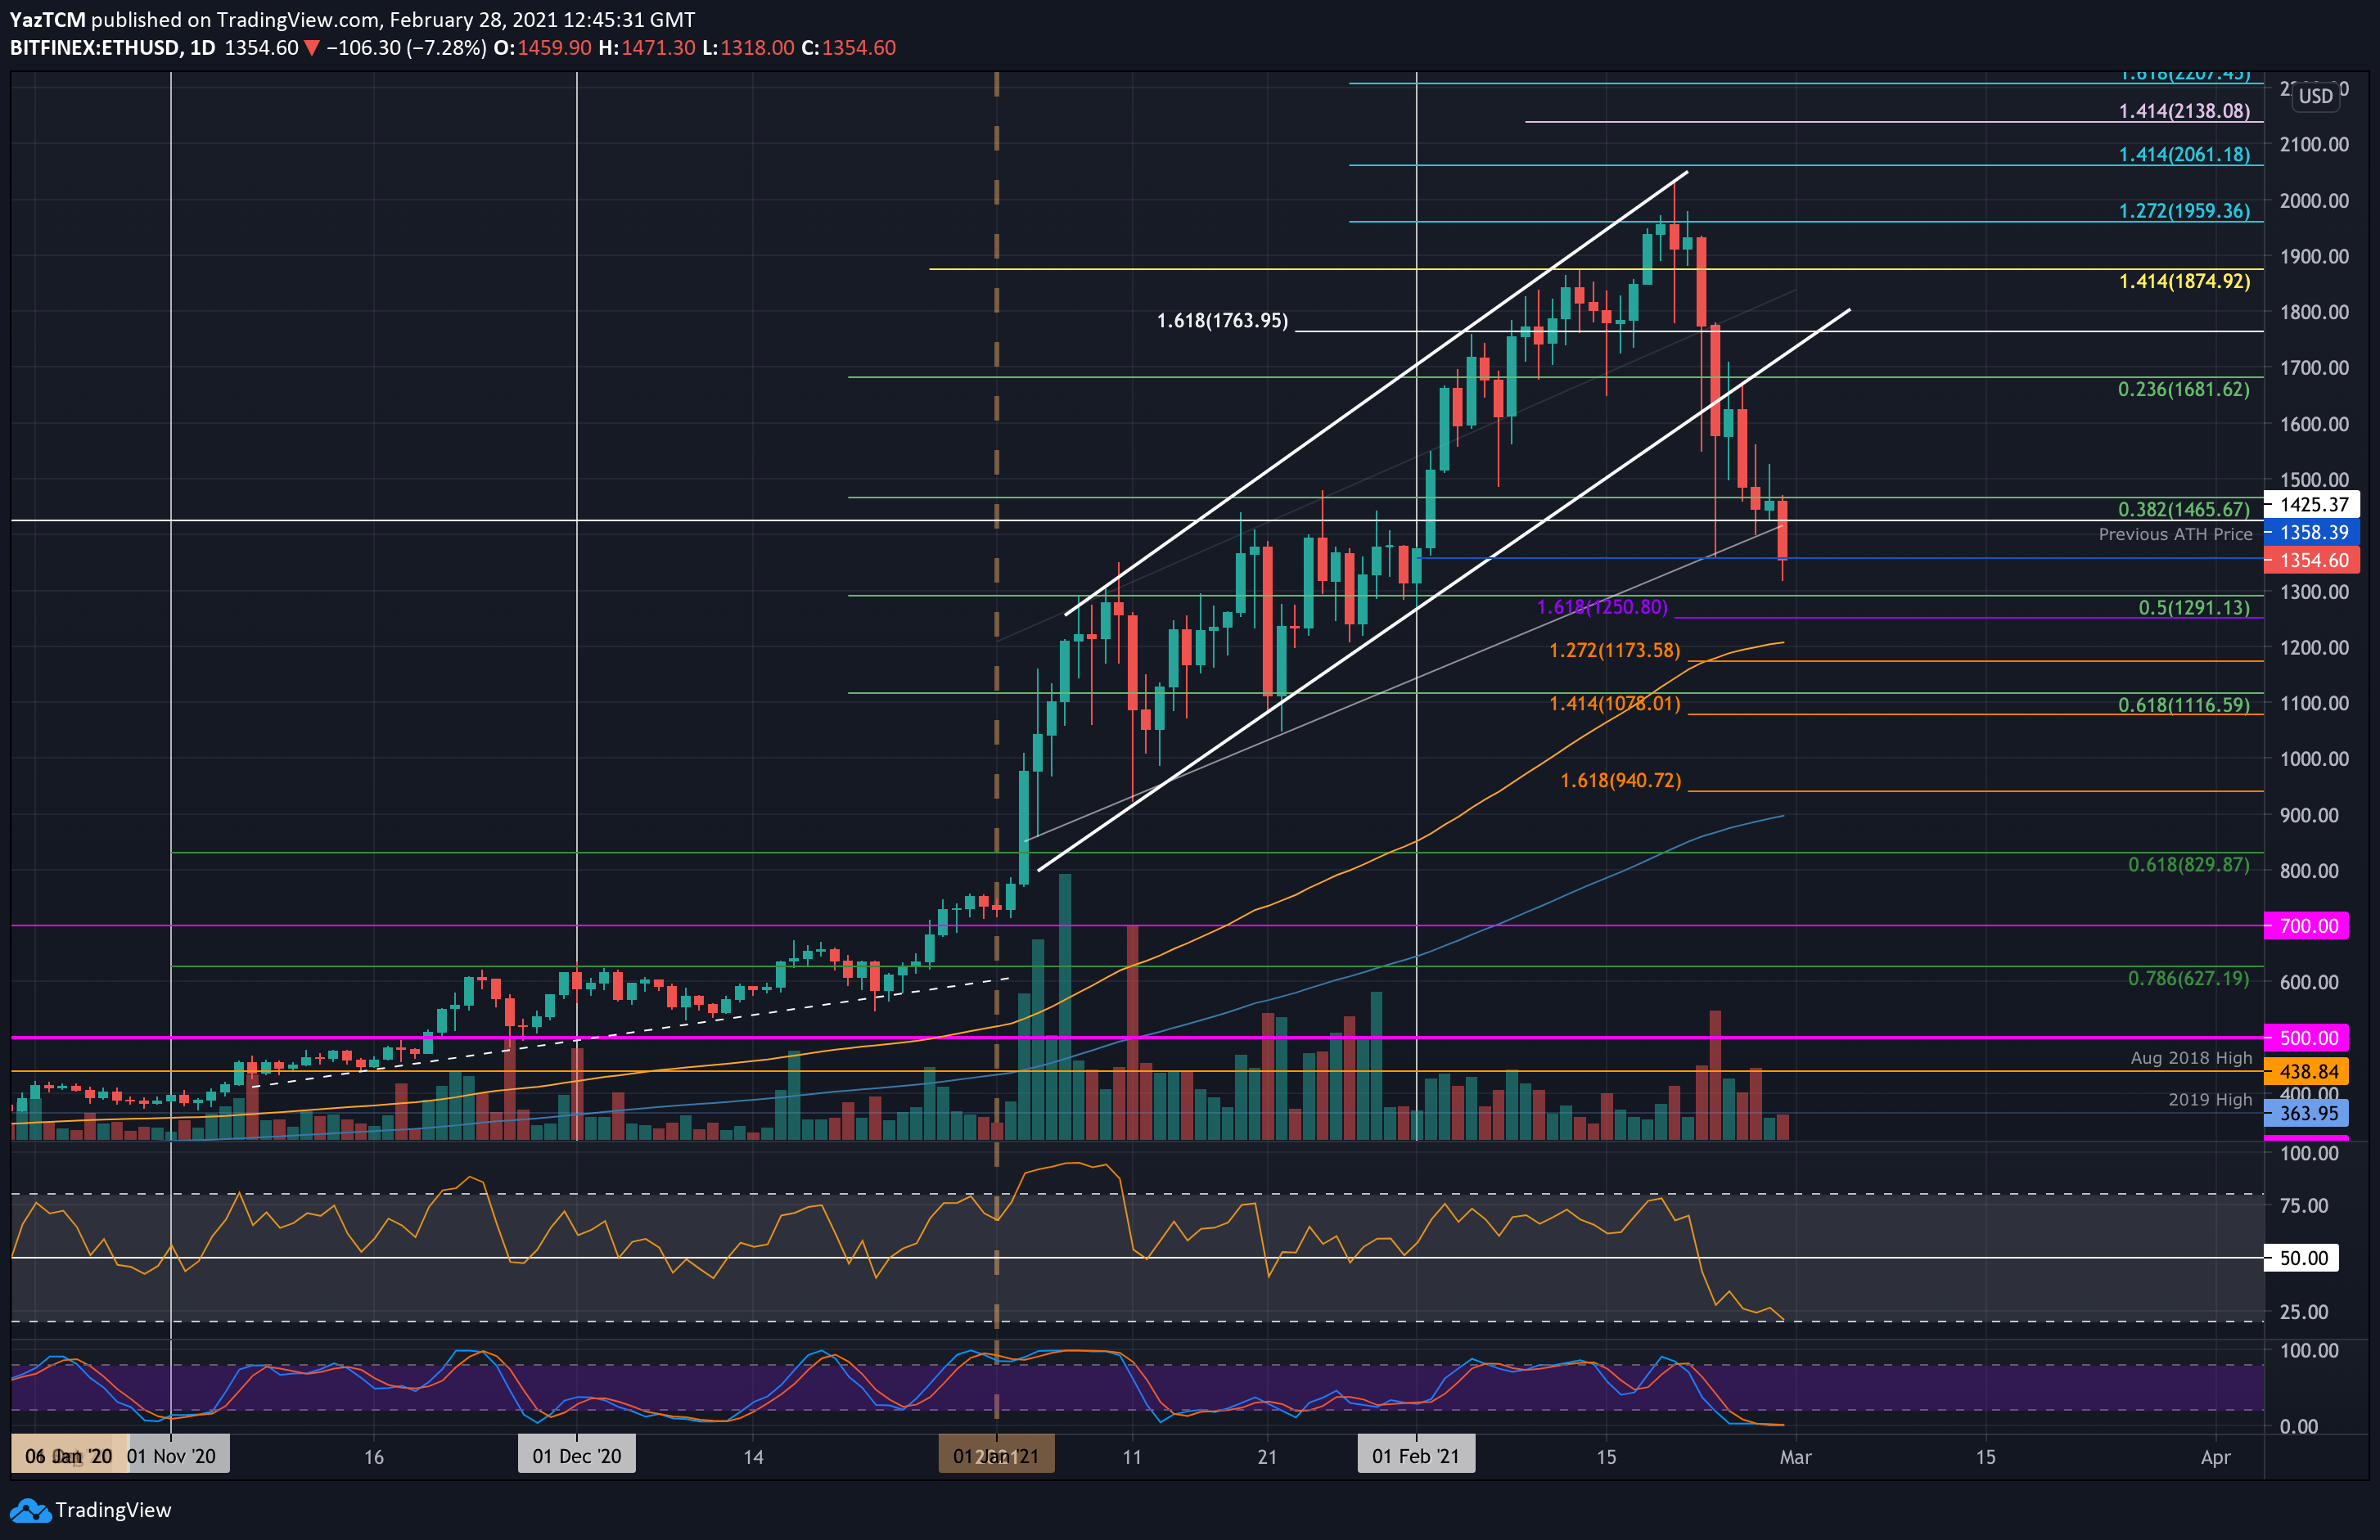
Key Support Levels: $1400, $1291, $1250, $1200.
Key Resistance Levels: $1400, $1465, $1500, $1600.
Ethereum is now down by a total of 30% over the past seven days of trading. The cryptocurrency had spiked above $2000 only last week as it hit the upper boundary of the following marked ascending price channel. From there, the coin retraced, broke down the price channel and lost over $600 of its value.
It happened on Monday, that ETH price closed the daily candle beneath the ascending price channel, confirming the breakdown. It then continued to slide over the week until support was met at the previous ATH price, from January 2018, at around $1400 – $1440.
Today, with another 7% price drop, Ethereum lost the previous ATH price as it dropped to as low as $1315 on Bitstamp. Additionally, the price drop caused Ethereum to break beneath an ascending trend line that dates back to the start of the year. It has since bounced and is now testing the early February support at around $1358.
For ETH, it will be critical to maintaining the $1400 support on today’s candle close (at midnight UTC). The last time ETH’s daily closed below $1400 was on the first day of February.
ETH-USD Short Term Price Prediction
Looking ahead, if the bearish action continues and ETH can’t reclaim $1400, the first level of support lies at $1315 (today’s low), along with $1291 (.5 Fib level). This is followed by $1250 (downside 1.618 Fib Extension – purple), $1200 (100-days EMA), and $1173 (downside 1.272 Fib extension – orange).
On the other side, in the case of a bullish retracement beyond $1400, the first resistance now lies at $1465. This is followed by $1500, $1600, and $1681.
The RSI is now approaching extremely overbought conditions as it sits at 21, a level not seen since March 2020. This shows the bears are extremely overextended and the downtrend might reach exhaustion pretty soon.
ETH/BTC – Bears Push To 0.03 BTC lows
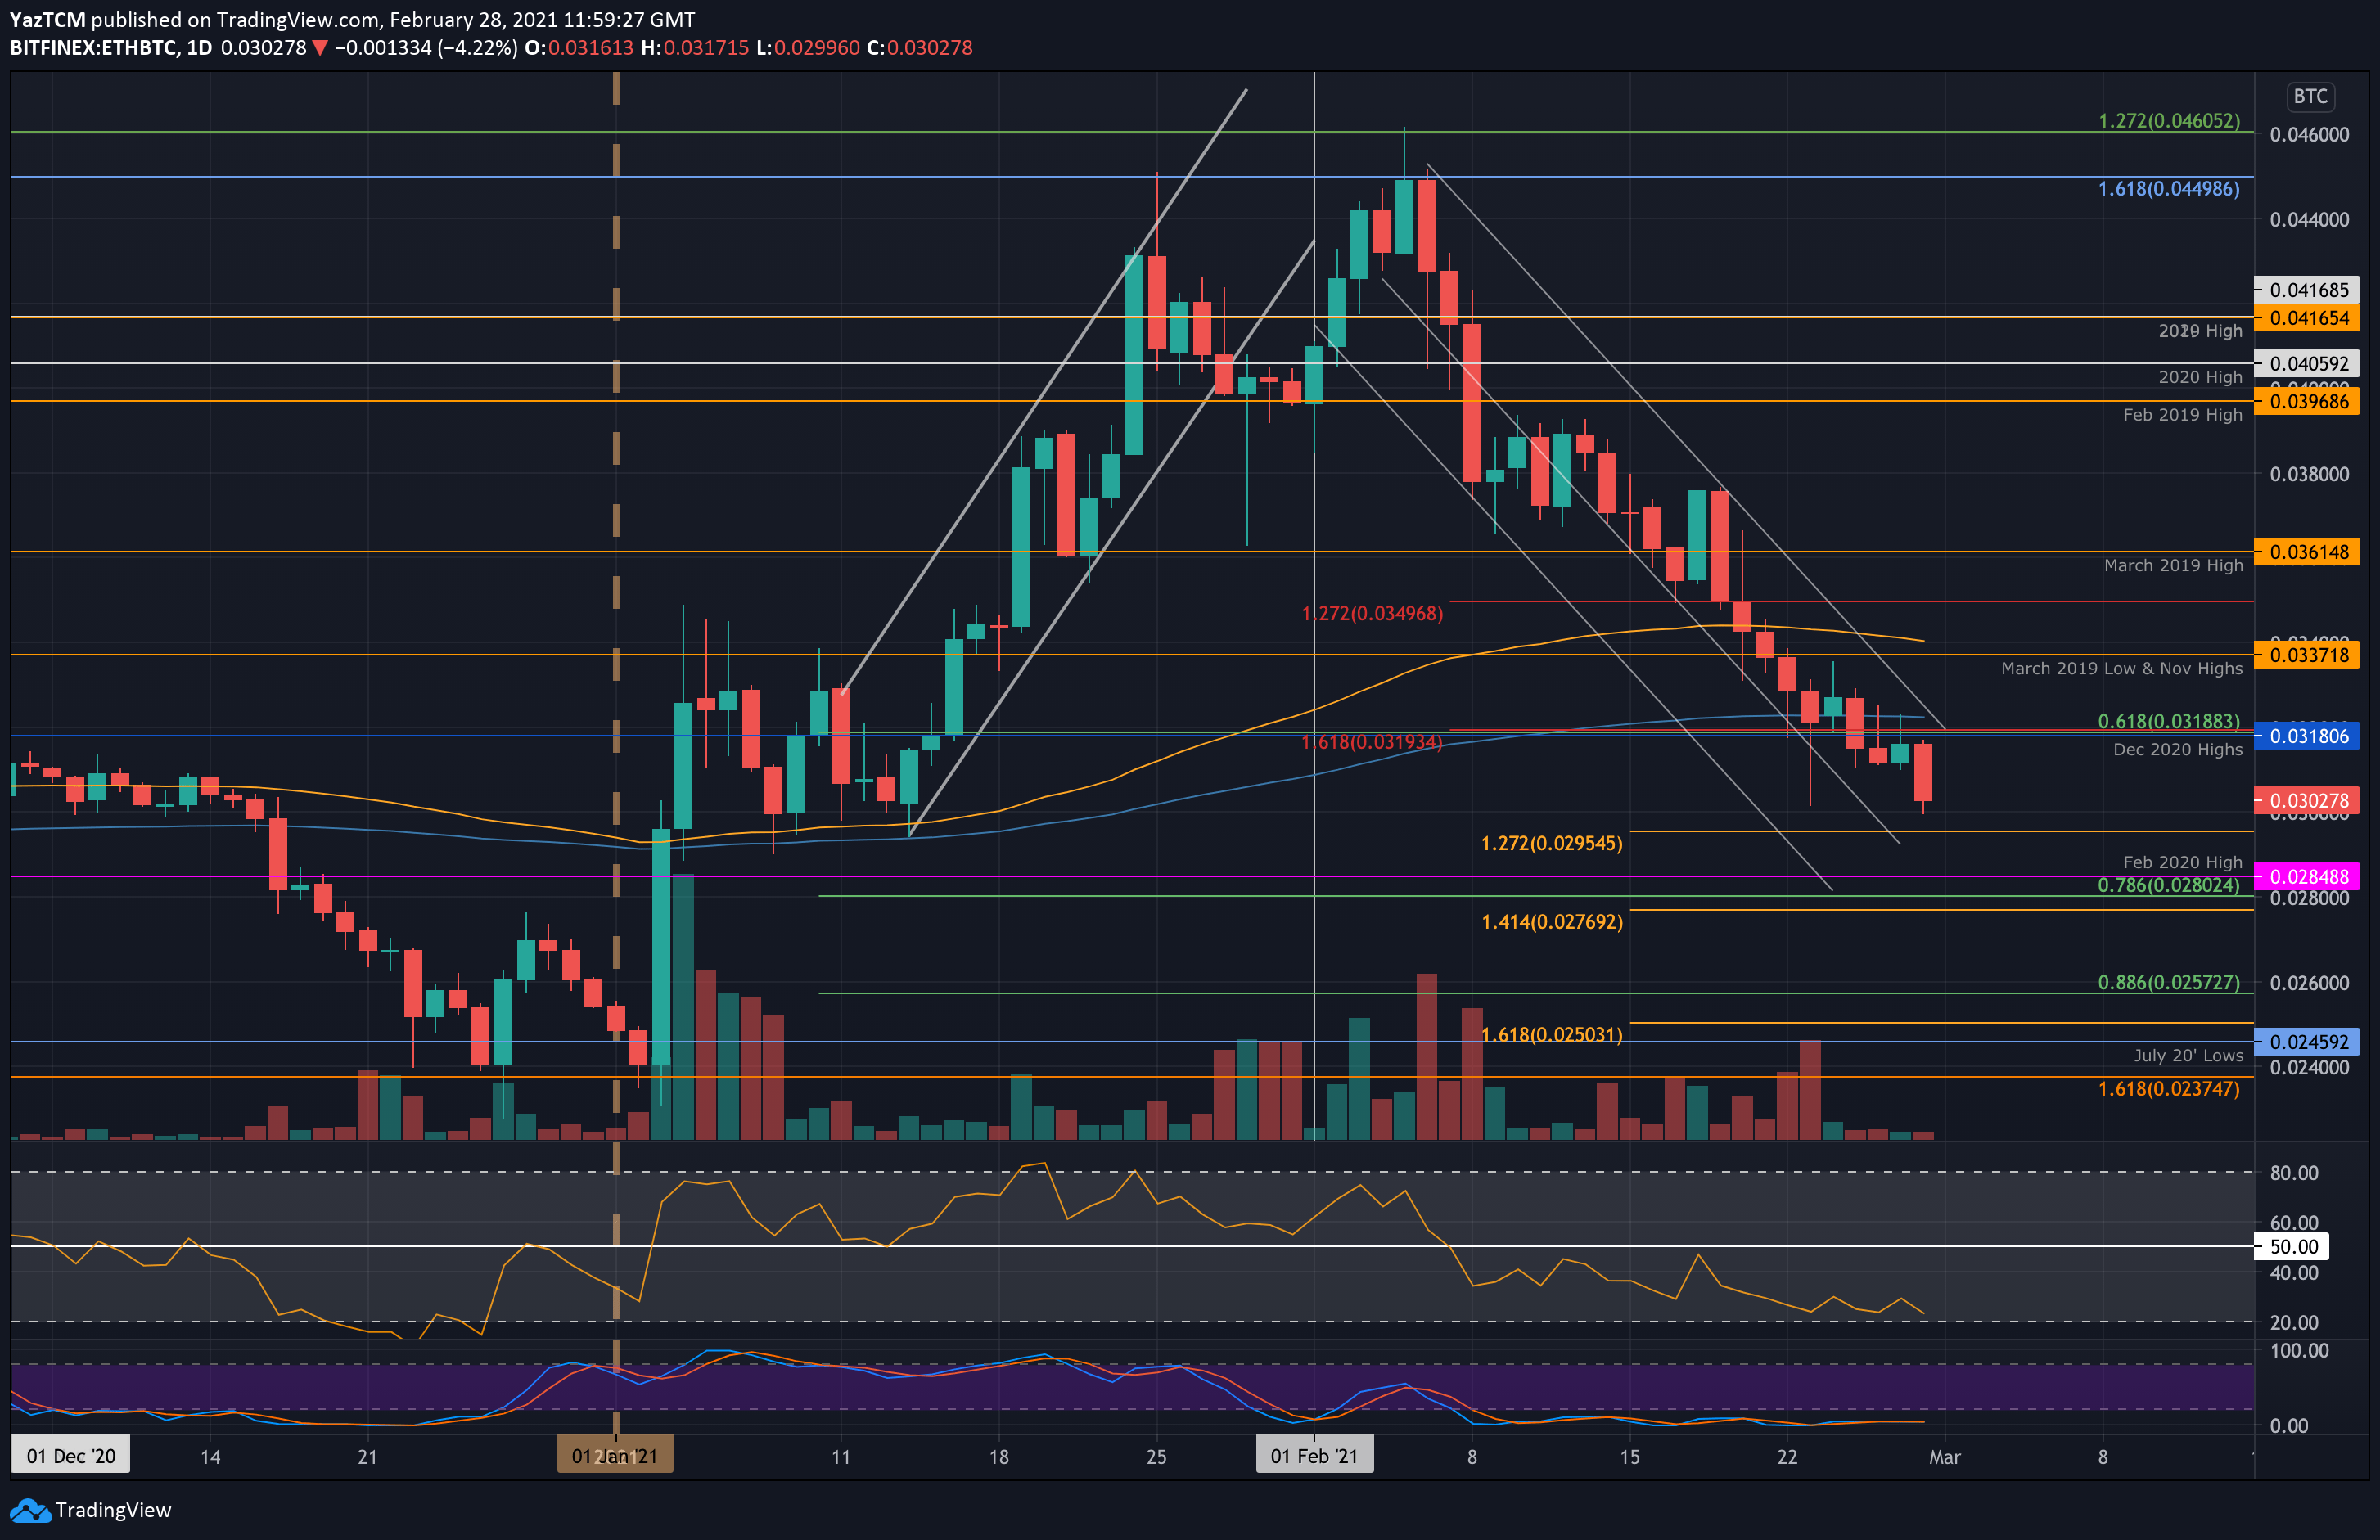
Key Support Levels: 0.03 BTC, 0.0295 BTC, 0.0284 BTC.
Key Resistance Levels: 0.0318 BTC, 0.0337 BTC, 0.034 BTC.
Ethereum has been struggling against Bitcoin throughout the entire month of February. It started the month by hitting a high of 0.046 BTC. From there, Etheruem has dropped by a total of 34% to reach the current 0.03 BTC level. Just like ETH/USD, ETH/BTC also facing a critical support level at 0.003 BTC.
The coin is trading inside a descending price channel and 0.03 BTC is the early January 2021 support. A break beneath here is likely to send Ethereum back to the 2021 lows of around 0.0237 BTC.
ETH-BTC Short Term Price Prediction
Looking ahead, the first support lies at 0.03 BTC. This is followed by 0.0295 BTC (downside 1.272 Fib Extension), 0.0284 BTC (Feb 2020 high), and 0.028 BTC (.786 Fib).
On the other side, the first resistance now lies at 0.0318 BTC (Dec 2020 highs & 200-days EMA). Above this, resistance is found at 0.0337 BTC (Nov 2020 Highs), 0.034 BTC (100-days EMA), and 0.035 BTC.
Likewise, the RSI is reaching extremely oversold conditions here, indicating the sellers must be reaching exhaustion pretty soon.