ETH/USD – Ether Stalls At Bearish .382 Fib & 20-day MA Key Support Levels: 00, 36, 00.Key Resistance Levels: 60, 40, 00. Ethereum rebounded from support at 10 (mid-March support) over the weekend and went on to recover by a total of 25% from the low to reach the current 42 level. After rebounding, it immediately broke above the 200-day MA and continued beyond 00 on Monday. Since breaking 00, ETH reached as high as 40 yesterday but failed to close a daily candle above 60. The resistance here is provided by a bearish .382 Fib Retracement and the 20-day MA. Additionally, a falling trendline that spans the month of June is also located there. ETH/USD Daily Chart. Source: TradingView.ETH-USD Short Term Price Prediction Looking ahead, if the
Topics:
Yaz Sheikh considers the following as important: ETH Analysis, ETHBTC, Ethereum (ETH) Price, ethusd
This could be interesting, too:
Mandy Williams writes Ethereum Derivatives Metrics Signal Modest Downside Tail Risk Ahead: Nansen
Jordan Lyanchev writes Weekly Bitcoin, Ethereum ETF Recap: Light at the End of the Tunnel for BTC
CryptoVizArt writes Will Weak Momentum Drive ETH to .5K? (Ethereum Price Analysis)
Jordan Lyanchev writes Bybit Hack Fallout: Arthur Hayes, Samson Mow Push for Ethereum Rollback
ETH/USD – Ether Stalls At Bearish .382 Fib & 20-day MA
Key Support Levels: $2100, $2036, $2000.
Key Resistance Levels: $2160, $2240, $2300.
Ethereum rebounded from support at $1710 (mid-March support) over the weekend and went on to recover by a total of 25% from the low to reach the current $2142 level. After rebounding, it immediately broke above the 200-day MA and continued beyond $2000 on Monday.
Since breaking $2000, ETH reached as high as $2240 yesterday but failed to close a daily candle above $2160. The resistance here is provided by a bearish .382 Fib Retracement and the 20-day MA. Additionally, a falling trendline that spans the month of June is also located there.
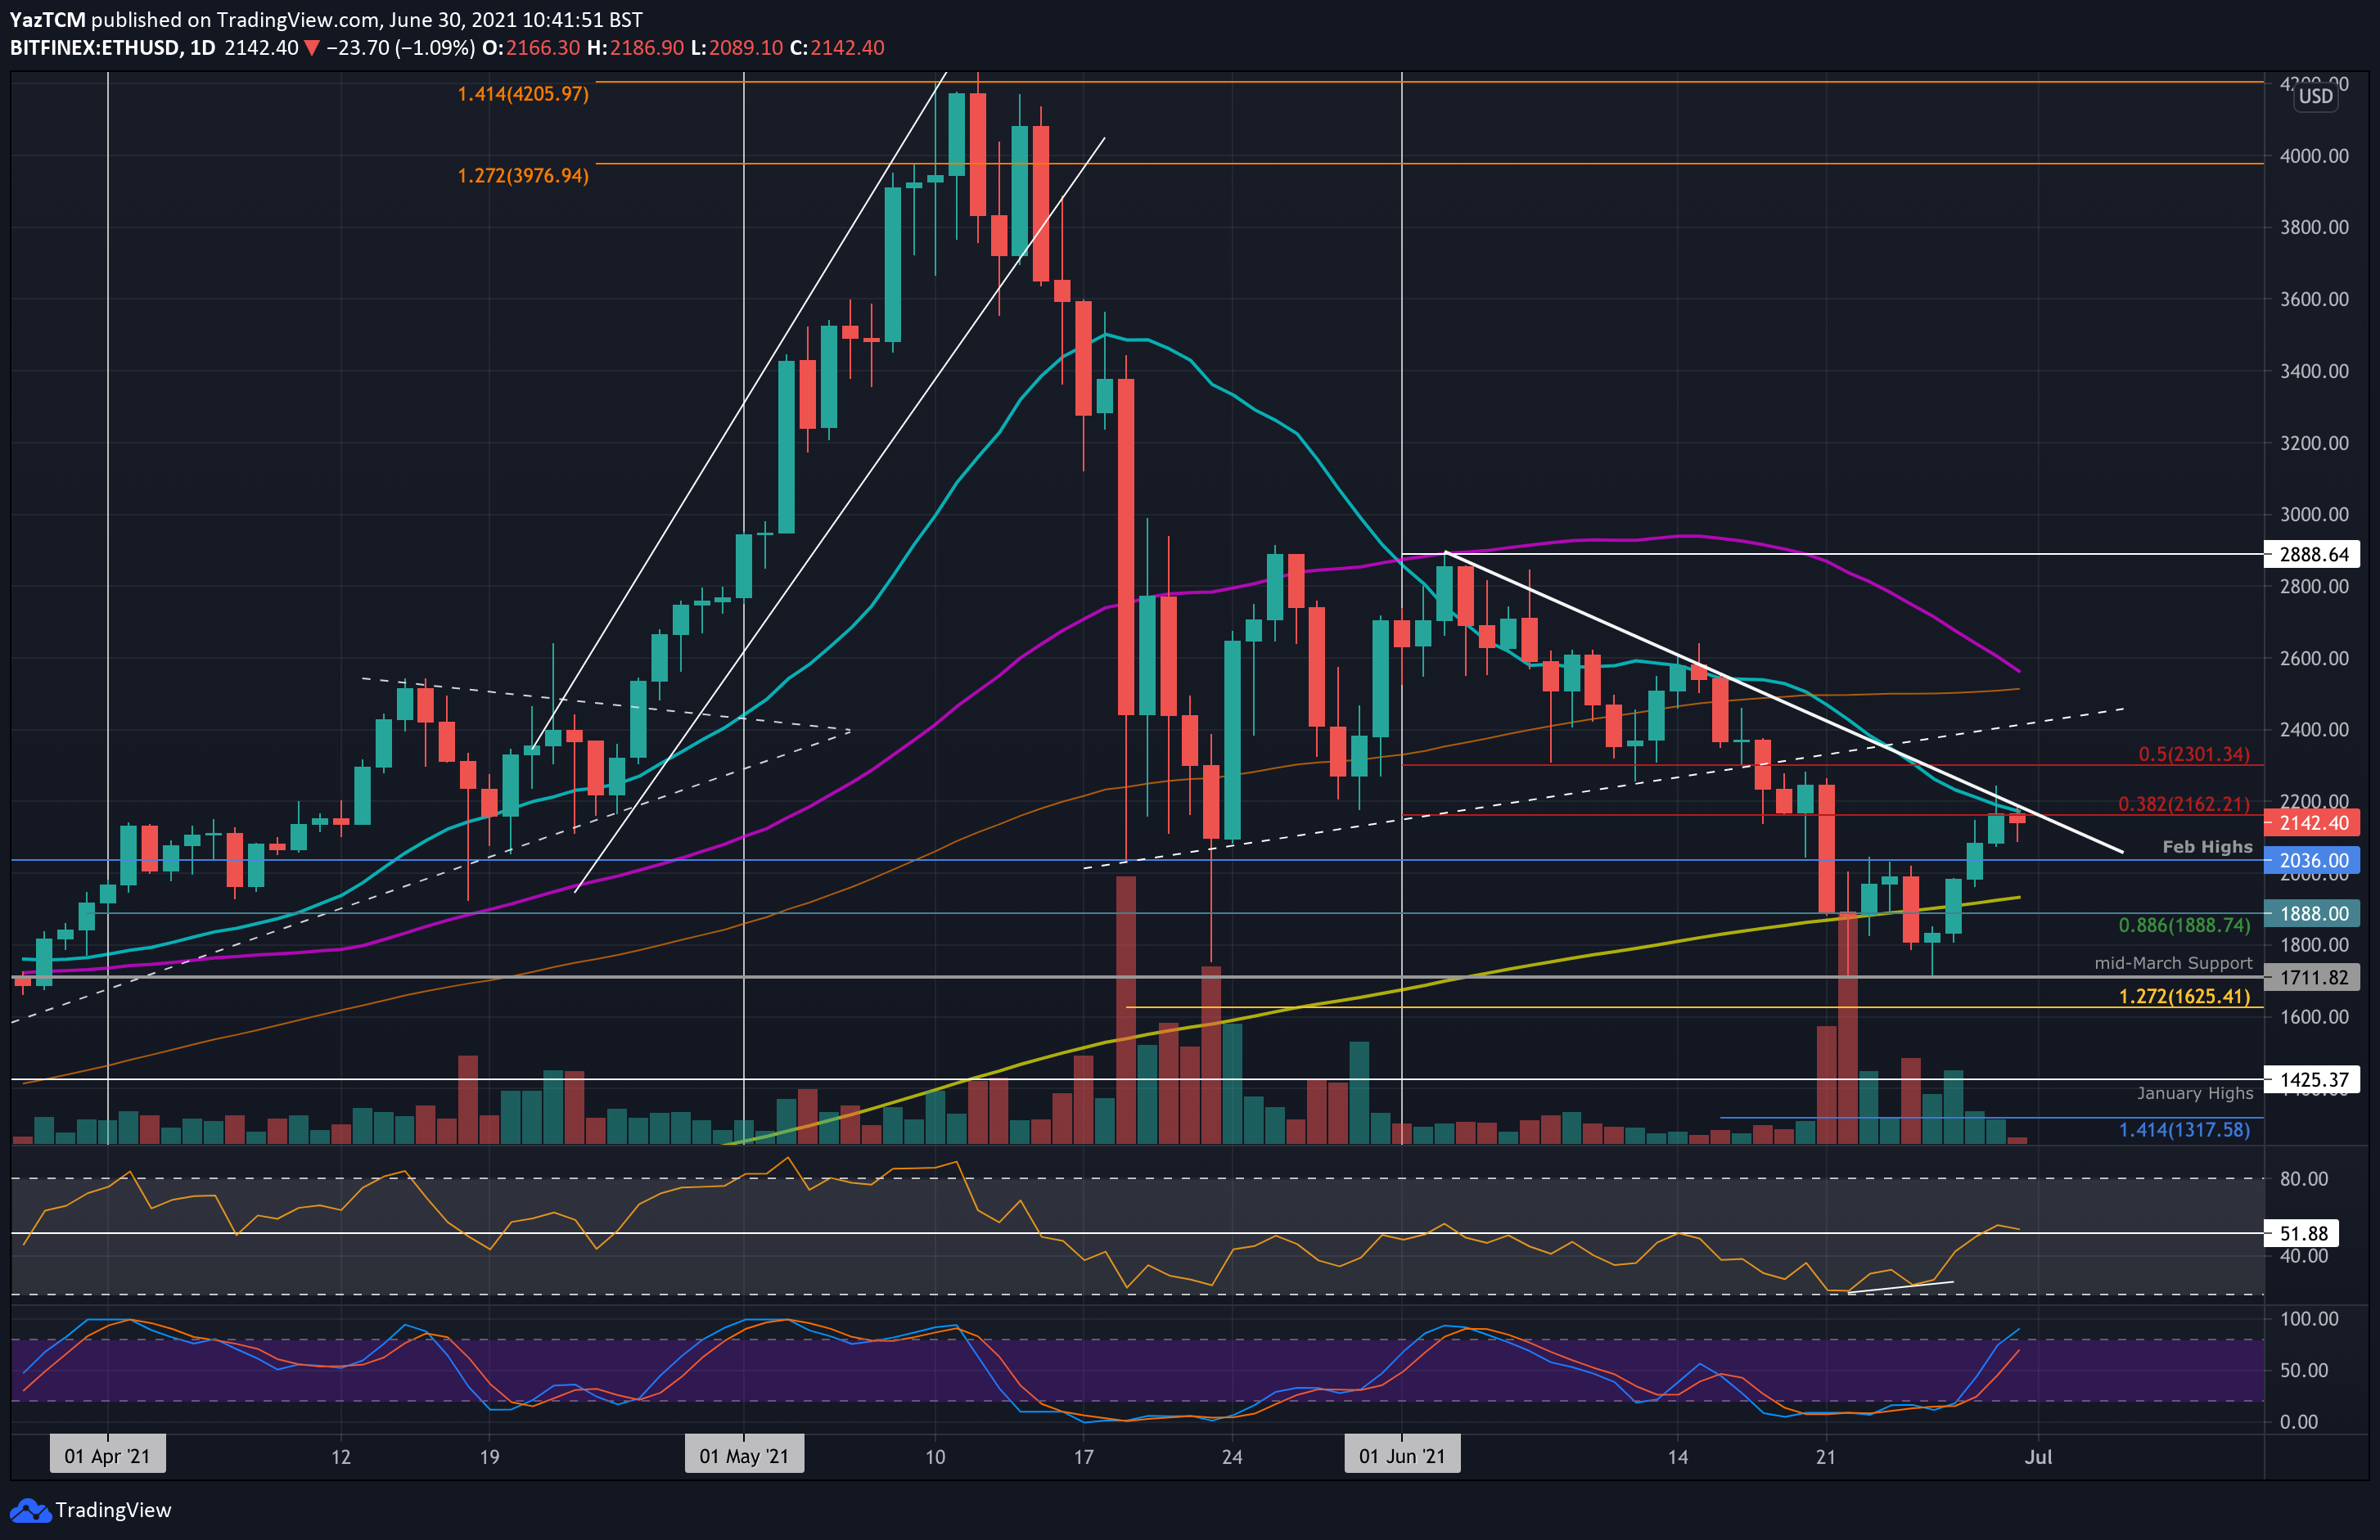
ETH-USD Short Term Price Prediction
Looking ahead, if the buyers can close a daily candle above $2160, the first resistance lies at $2240 (weekly high). This is followed by $2300 (bearish .5 Fib), $2400, and then between $2500 (100-day MA) and $2565 (50-day MA).
On the other side, the first support lies at $2100. This is followed by $2036 (Feb 2021 highs), $2000, $1925 (200-day MA), and $1888 (.886 Fib).
The daily RSI is sitting on the midline, indicating that the bearish momentum has faded, and there is now indecision within the market about the next direction.
ETH/BTC – Buyers Reclaim 0.06 BTC.
Key Support Levels: 0.06 BTC, 0.057 BTC, 0.056 BTC.
Key Resistance Levels: 0.0636 BTC, 0.065 BTC, 0.066 BTC.
Etheruem is also performing well against BTC. It was trading in a descending price channel for most of June and found support at the lower boundary around 0.055 BTC over the weekend. It went on to rebound from this support and broke above the price channel on Monday.
Despite breaking above the price channel, ETH is struggling to close a daily candle above the 20-day MA around 0.0612 BTC but has established support at 0.06 BTC.
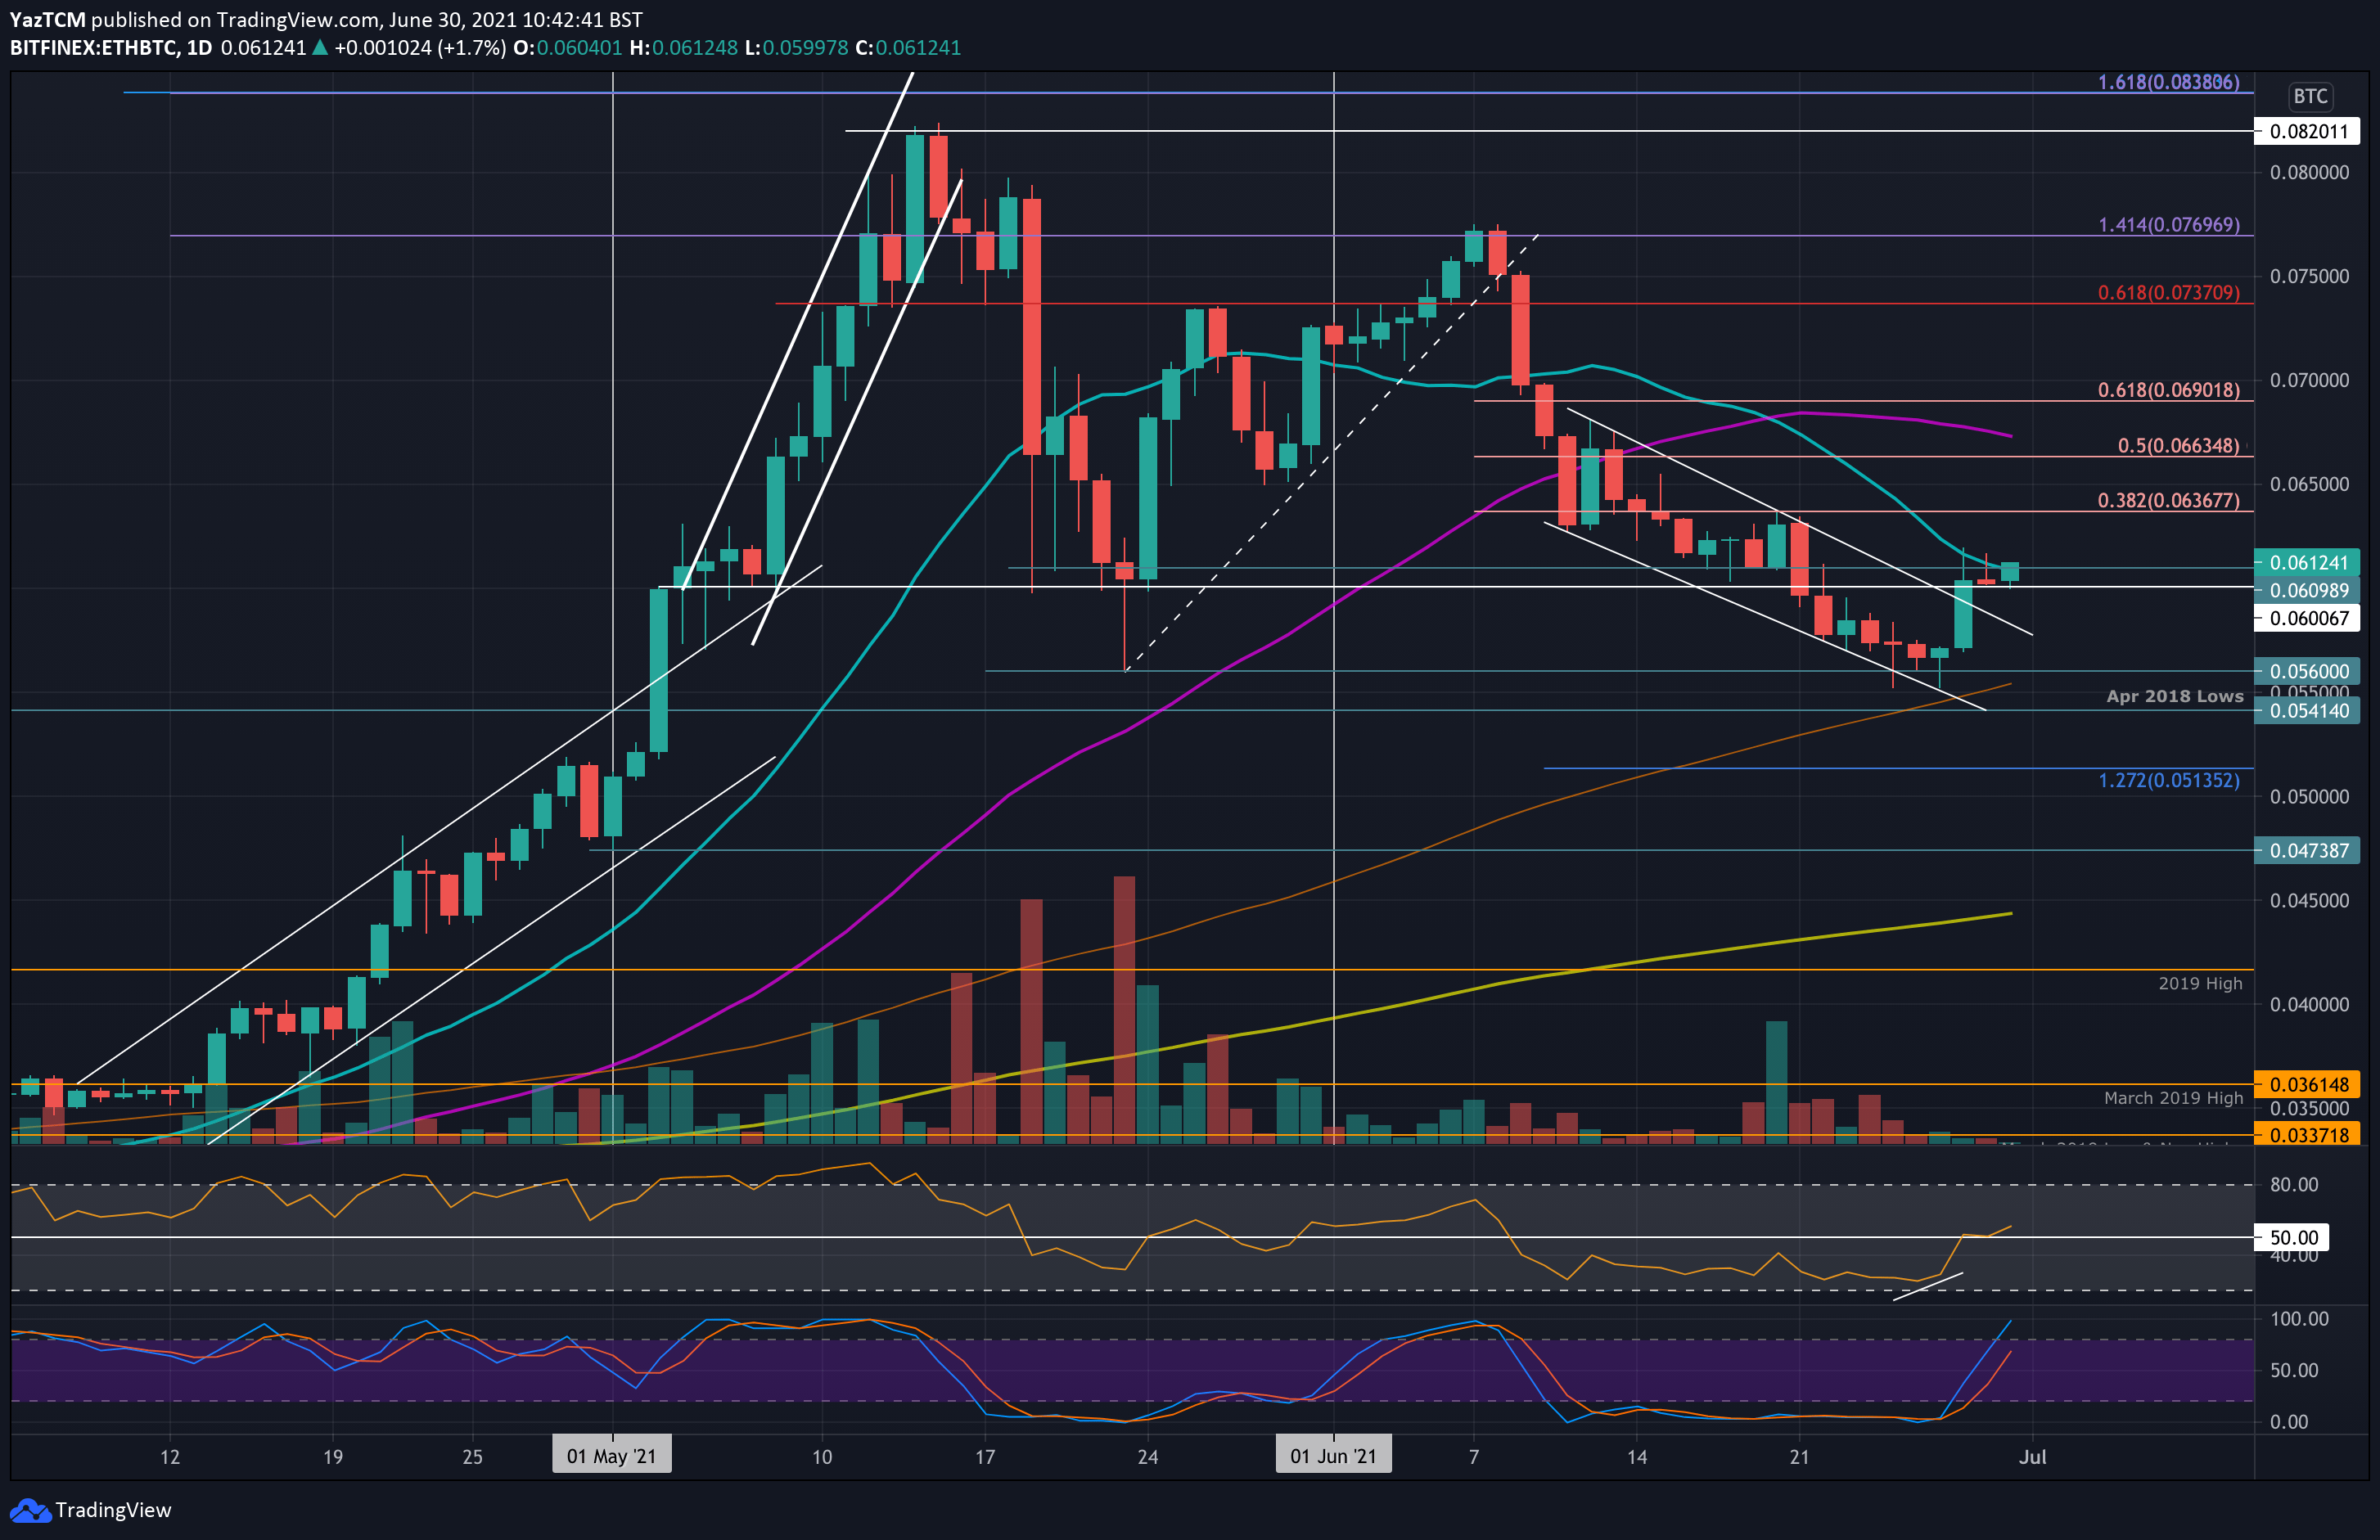
ETH-BTC Short Term Price Prediction
Moving forward, the first resistance above the 20-day MA lies at 0.0636 BTC (bearish .382 Fib). This is followed by 0.065 BTC, 0.066 BTC (bearish .5 Fib), and 0.069 BTC (bearish .618 Fib).
On the other side, the first support lies at 0.06 BTC. This is followed by 0.057 BTC, 0.056 BTC, 0.055 BTC (100-day MA), and 0.0541 BTC (April 2018 lows).
The RSI here managed to break above the midline, indicating that the buyers are attempting to take control of the market momentum.