ETH/USD – Market Falls Of Out Rising Pirce ChannelKey Support Levels: 65, 25, 58.Key Resistance Levels: 00, 81, 00.Yesterday, Ethereum dropped to 50 but quickly recovered by the end of the day to close the daily candle just beneath 00. Today, the market tumbled again and declined by another 10% to reach the current 50 level.Ethereum had slipped further earlier in the day, reaching a low of 58 before recovering to its current rate. The support here was provided by the low seen on February 2nd, 2021, and was further bolstered by a rising trend line.If ETH closes near these levels today, it would have fallen out of the ascending price channel that it has been trading within throughout the entire period of 2021.ETH/USD Daily Chart. Source: TradingViewETH-USD Short
Topics:
Yaz Sheikh considers the following as important: ETH Analysis, ETHBTC, Ethereum (ETH) Price, ethusd
This could be interesting, too:
Mandy Williams writes Ethereum Derivatives Metrics Signal Modest Downside Tail Risk Ahead: Nansen
Jordan Lyanchev writes Weekly Bitcoin, Ethereum ETF Recap: Light at the End of the Tunnel for BTC
CryptoVizArt writes Will Weak Momentum Drive ETH to .5K? (Ethereum Price Analysis)
Jordan Lyanchev writes Bybit Hack Fallout: Arthur Hayes, Samson Mow Push for Ethereum Rollback
ETH/USD – Market Falls Of Out Rising Pirce Channel
Key Support Levels: $1465, $1425, $1358.
Key Resistance Levels: $1600, $1681, $1700.
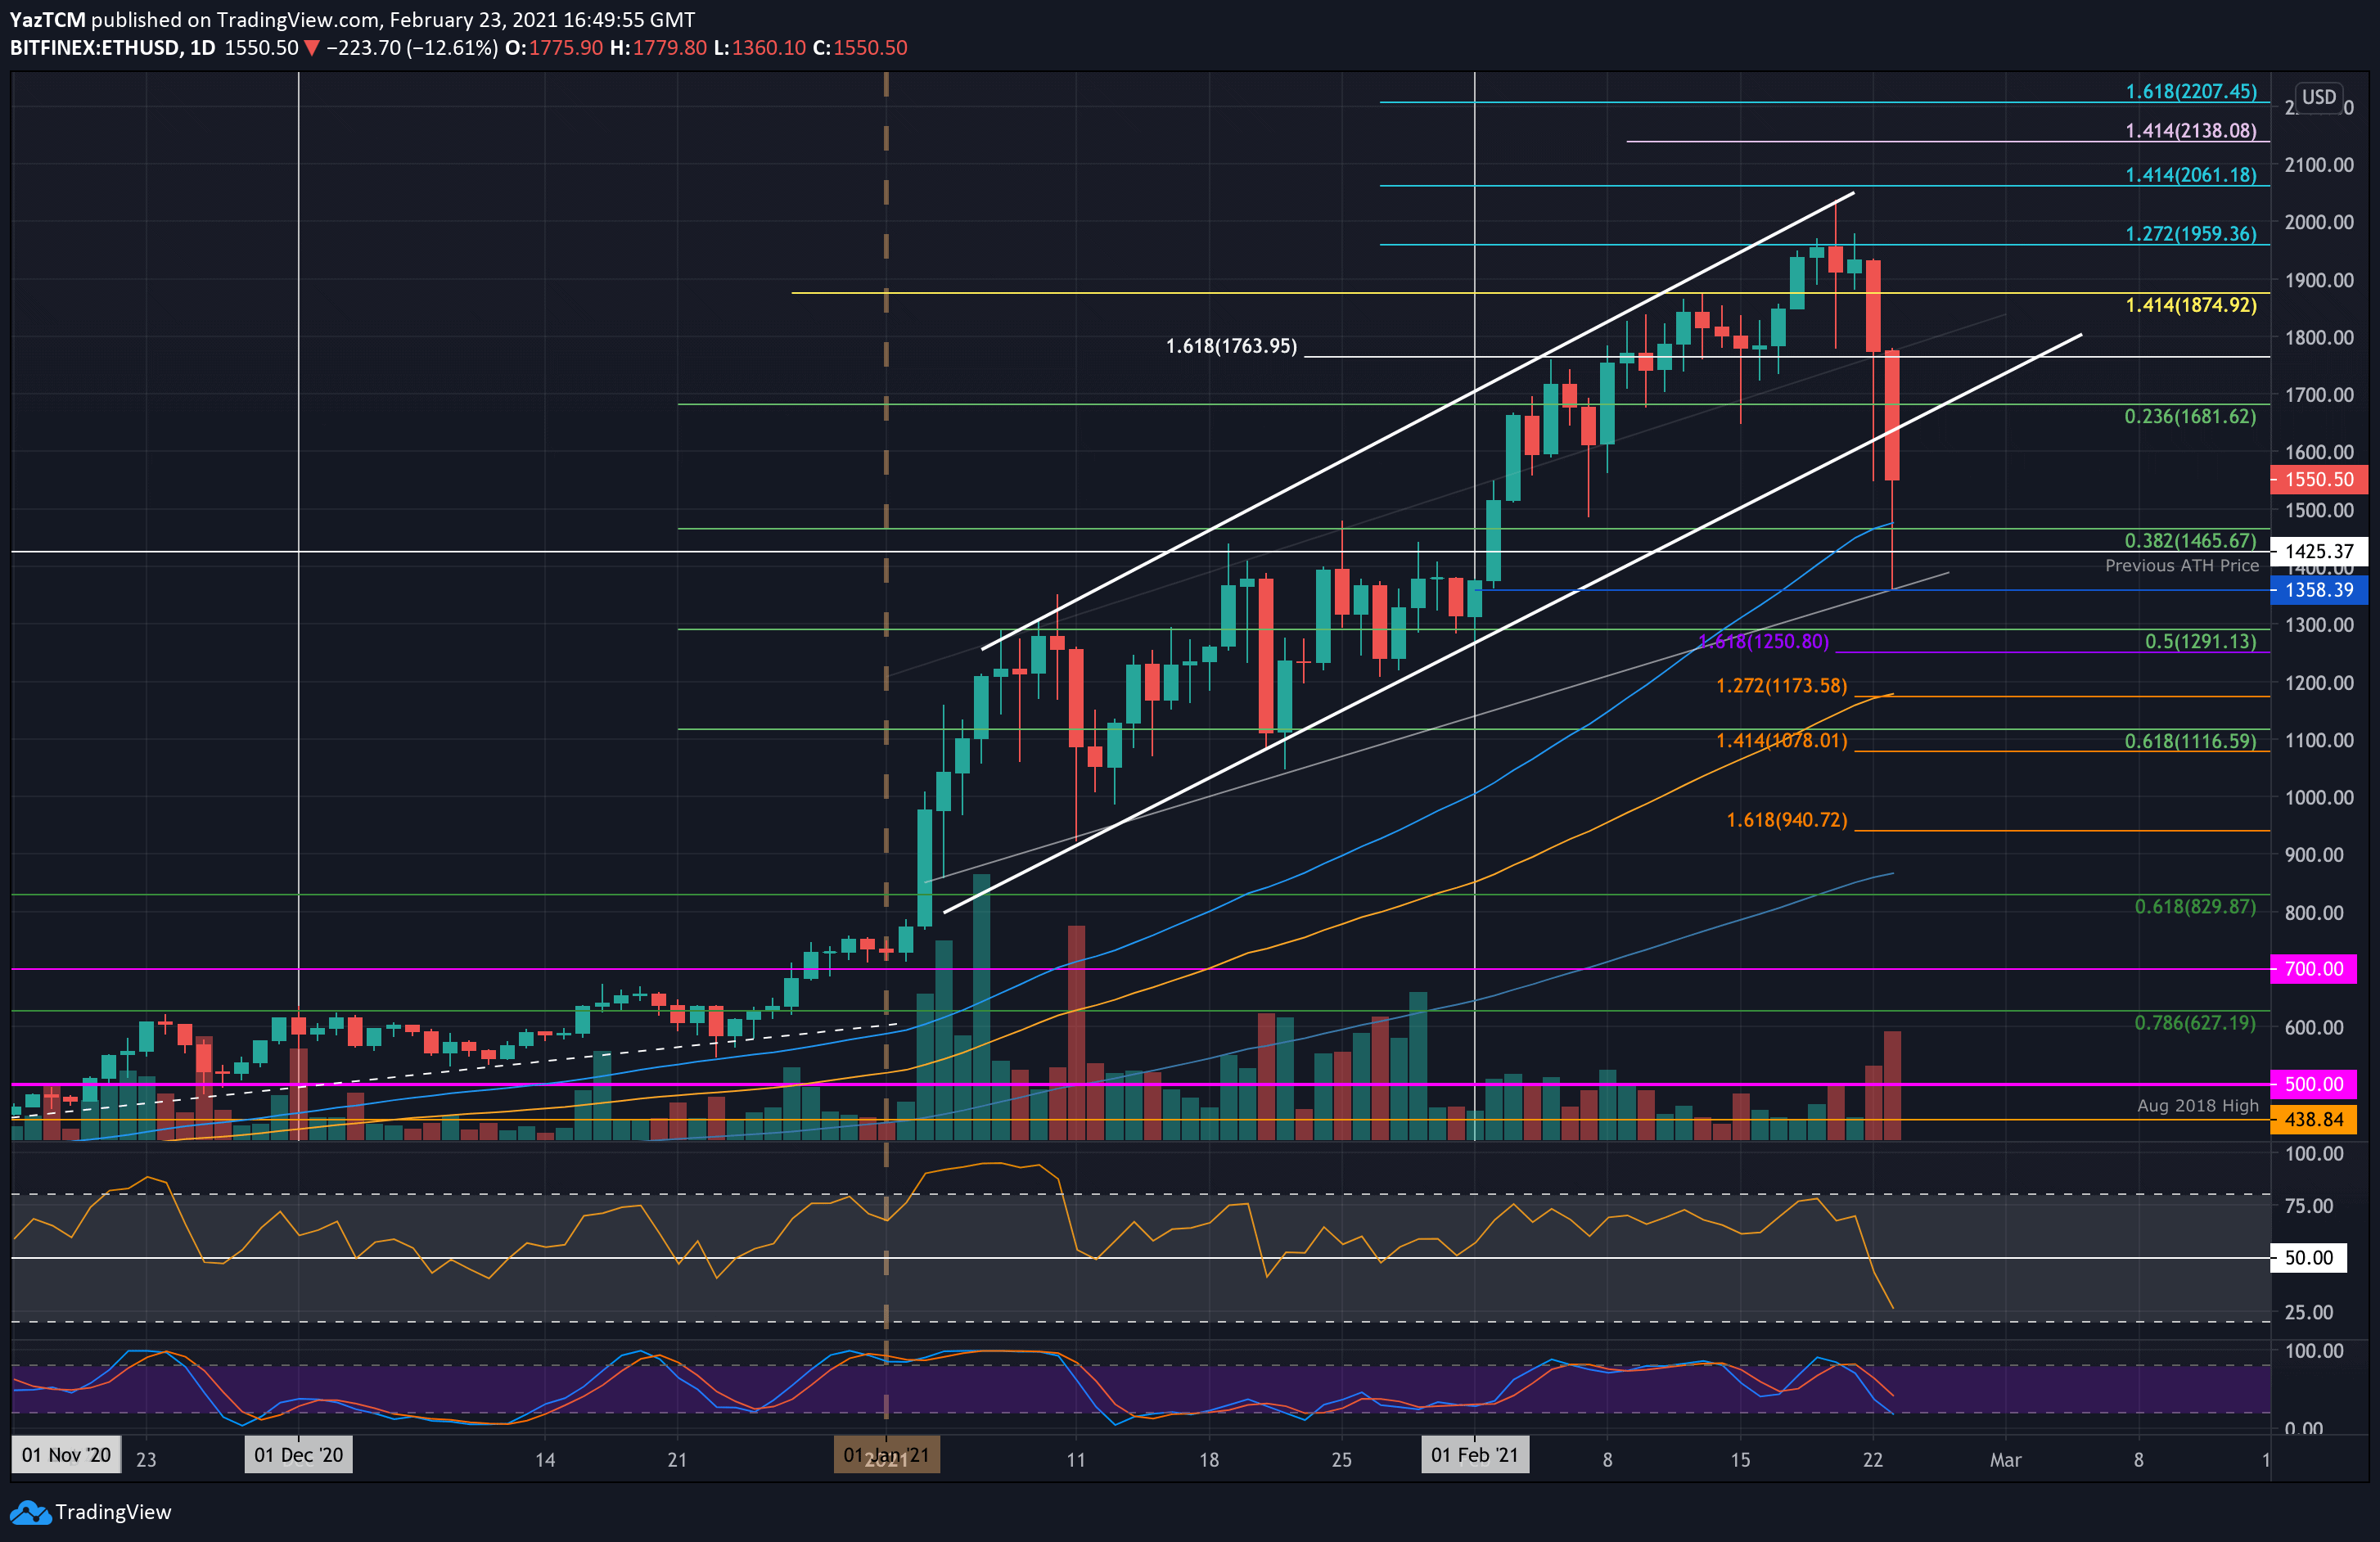
Yesterday, Ethereum dropped to $1550 but quickly recovered by the end of the day to close the daily candle just beneath $1800. Today, the market tumbled again and declined by another 10% to reach the current $1550 level.
Ethereum had slipped further earlier in the day, reaching a low of $1358 before recovering to its current rate. The support here was provided by the low seen on February 2nd, 2021, and was further bolstered by a rising trend line.
If ETH closes near these levels today, it would have fallen out of the ascending price channel that it has been trading within throughout the entire period of 2021.
ETH-USD Short Term Price Prediction
Looking ahead, if the bearish action continues, the first support lies at $1465 (.382 Fib & 50-day MA). This is followed by $1425, $1358 (today’s low), and $1291 (.5 Fib). Additional support lies at $1250 (downside 1.618 Fib) and $1173 (100-days EMA).
On the other side, the first resistance lies at $1600. This is followed by $1681 (previous channel support – now resistance), $1700, $1765, and $1800.
The daily RSI took a precipitous drop over the past few days as it fell from the bullish favor into extreme bearish territory. It has not been this bearish for quite some time, and we have to go all the way back to September to see a similar level. This is quite a promising situation as it gave the momentum an opportunity to reset after being parabolic for an extended period.
ETH/BTC – Bulls Attempting To Defend 200-days EMA
Key Support Levels: 0.0318 BTC, 0.03 BTC, 0.0295 BTC.
Key Resistance Levels: 0.0337 BTC, 0.035 BTC, 0.0361 BTC.
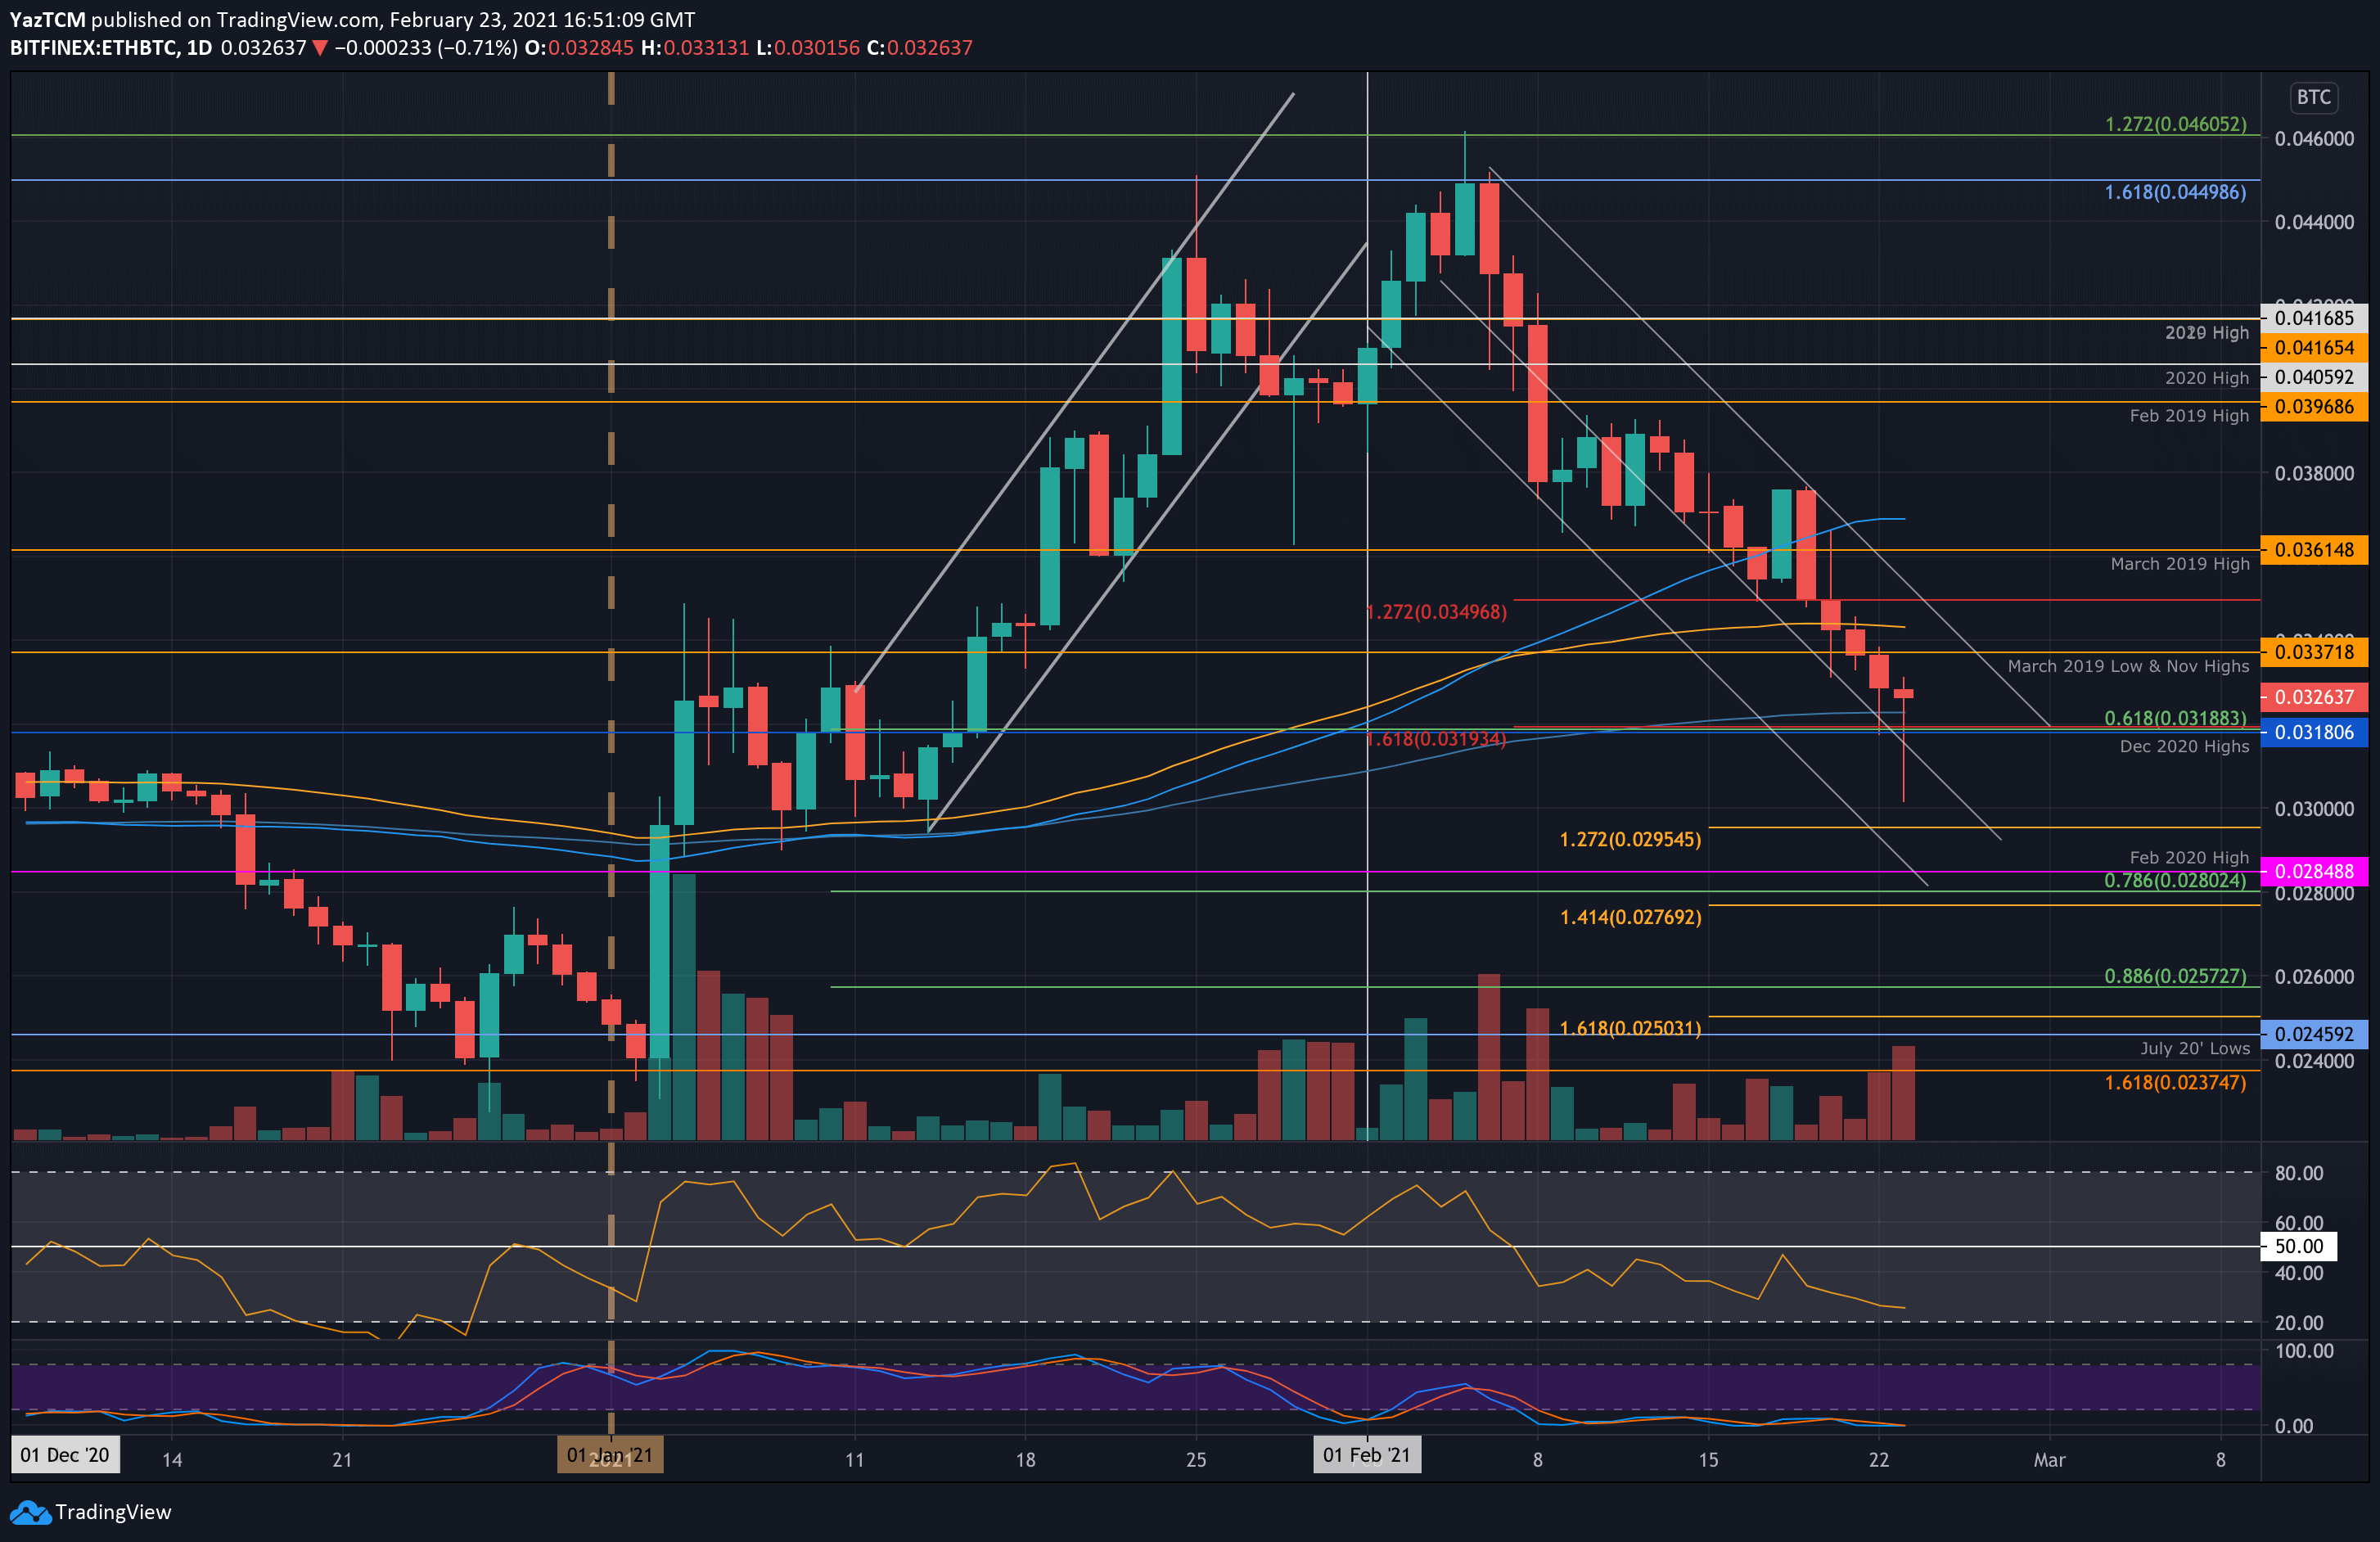
Against Bitcoin, Ethereum is also struggling quite significantly as it spikes as low as 0.03 BTC today. The cryptocurrency has now established a descending price channel and is trading above the midline of the channel.
It started the month by hitting a fresh 2021 high at 0.046 BTC but quickly rolled over from here to begin the downtrend. After hitting 0.03 BTC today, the bulls quickly regrouped to bring the price back above 0.032 BTC (200-day EMA).
A break beneath this 200-days EMA might send Ethereum into an extended bearish spiral over the next few weeks.
ETH-BTC Short Term Price Prediction
Looking ahead, the first support lies at 0.0318 BTC, which is combined support provided by the 200-days EMA, the December 2020 highs, the .618 Fib, and a downside 1.618 Fib Extension. Beneath this, support lies at 0.03 BTC, 0.0295 BTC (downside 1.272 Fib Extension), and 0.0284 BTC (Feb 2020 Highs).
On the other side, the first level of resistance now lies at 0.0337 BTC (Nov 2020 Highs). This is followed by 0.035 BTC, 0.0361 BTC, and 0.038 BTC.
The RSI has been in bearish territory for most of February for ETH/BTC. It is starting to level out today, which could suggest the bearish momentum is ready to start fading.