ETH/USD – Ether Falls Back Beneath 00 Key Support Levels: 90, 70, 00.Key Resistance Levels: 00, 80, 00. Ethereum fell a sharp 5% today as it dropped back beneath 00 to reach the current 00 support. Since falling below the neckline on a head & shoulders pattern last Monday, the cryptocurrency has been trapped inside a trading range for the past eight days between 80 and around 70 (100-day MA). The bulls rebounded from the lower boundary of the range on Sunday but could not overcome resistance at 80 yesterday. As a result, ETH fell back beneath 00 again today. The breakout of the current range will dictate the next direction for the market. ETH/USD Daily Chart. Source: TradingView.ETH-USD Short Term Price Prediction Looking ahead, if
Topics:
Yaz Sheikh considers the following as important: ETH Analysis, ETHBTC, Ethereum (ETH) Price, ethusd
This could be interesting, too:
Mandy Williams writes Ethereum Derivatives Metrics Signal Modest Downside Tail Risk Ahead: Nansen
Jordan Lyanchev writes Weekly Bitcoin, Ethereum ETF Recap: Light at the End of the Tunnel for BTC
CryptoVizArt writes Will Weak Momentum Drive ETH to .5K? (Ethereum Price Analysis)
Jordan Lyanchev writes Bybit Hack Fallout: Arthur Hayes, Samson Mow Push for Ethereum Rollback
ETH/USD – Ether Falls Back Beneath $3000
Key Support Levels: $2890, $2770, $2600.
Key Resistance Levels: $3000, $3180, $3200.
Ethereum fell a sharp 5% today as it dropped back beneath $3000 to reach the current $2900 support. Since falling below the neckline on a head & shoulders pattern last Monday, the cryptocurrency has been trapped inside a trading range for the past eight days between $3180 and around $2770 (100-day MA).
The bulls rebounded from the lower boundary of the range on Sunday but could not overcome resistance at $3180 yesterday. As a result, ETH fell back beneath $3000 again today.
The breakout of the current range will dictate the next direction for the market.
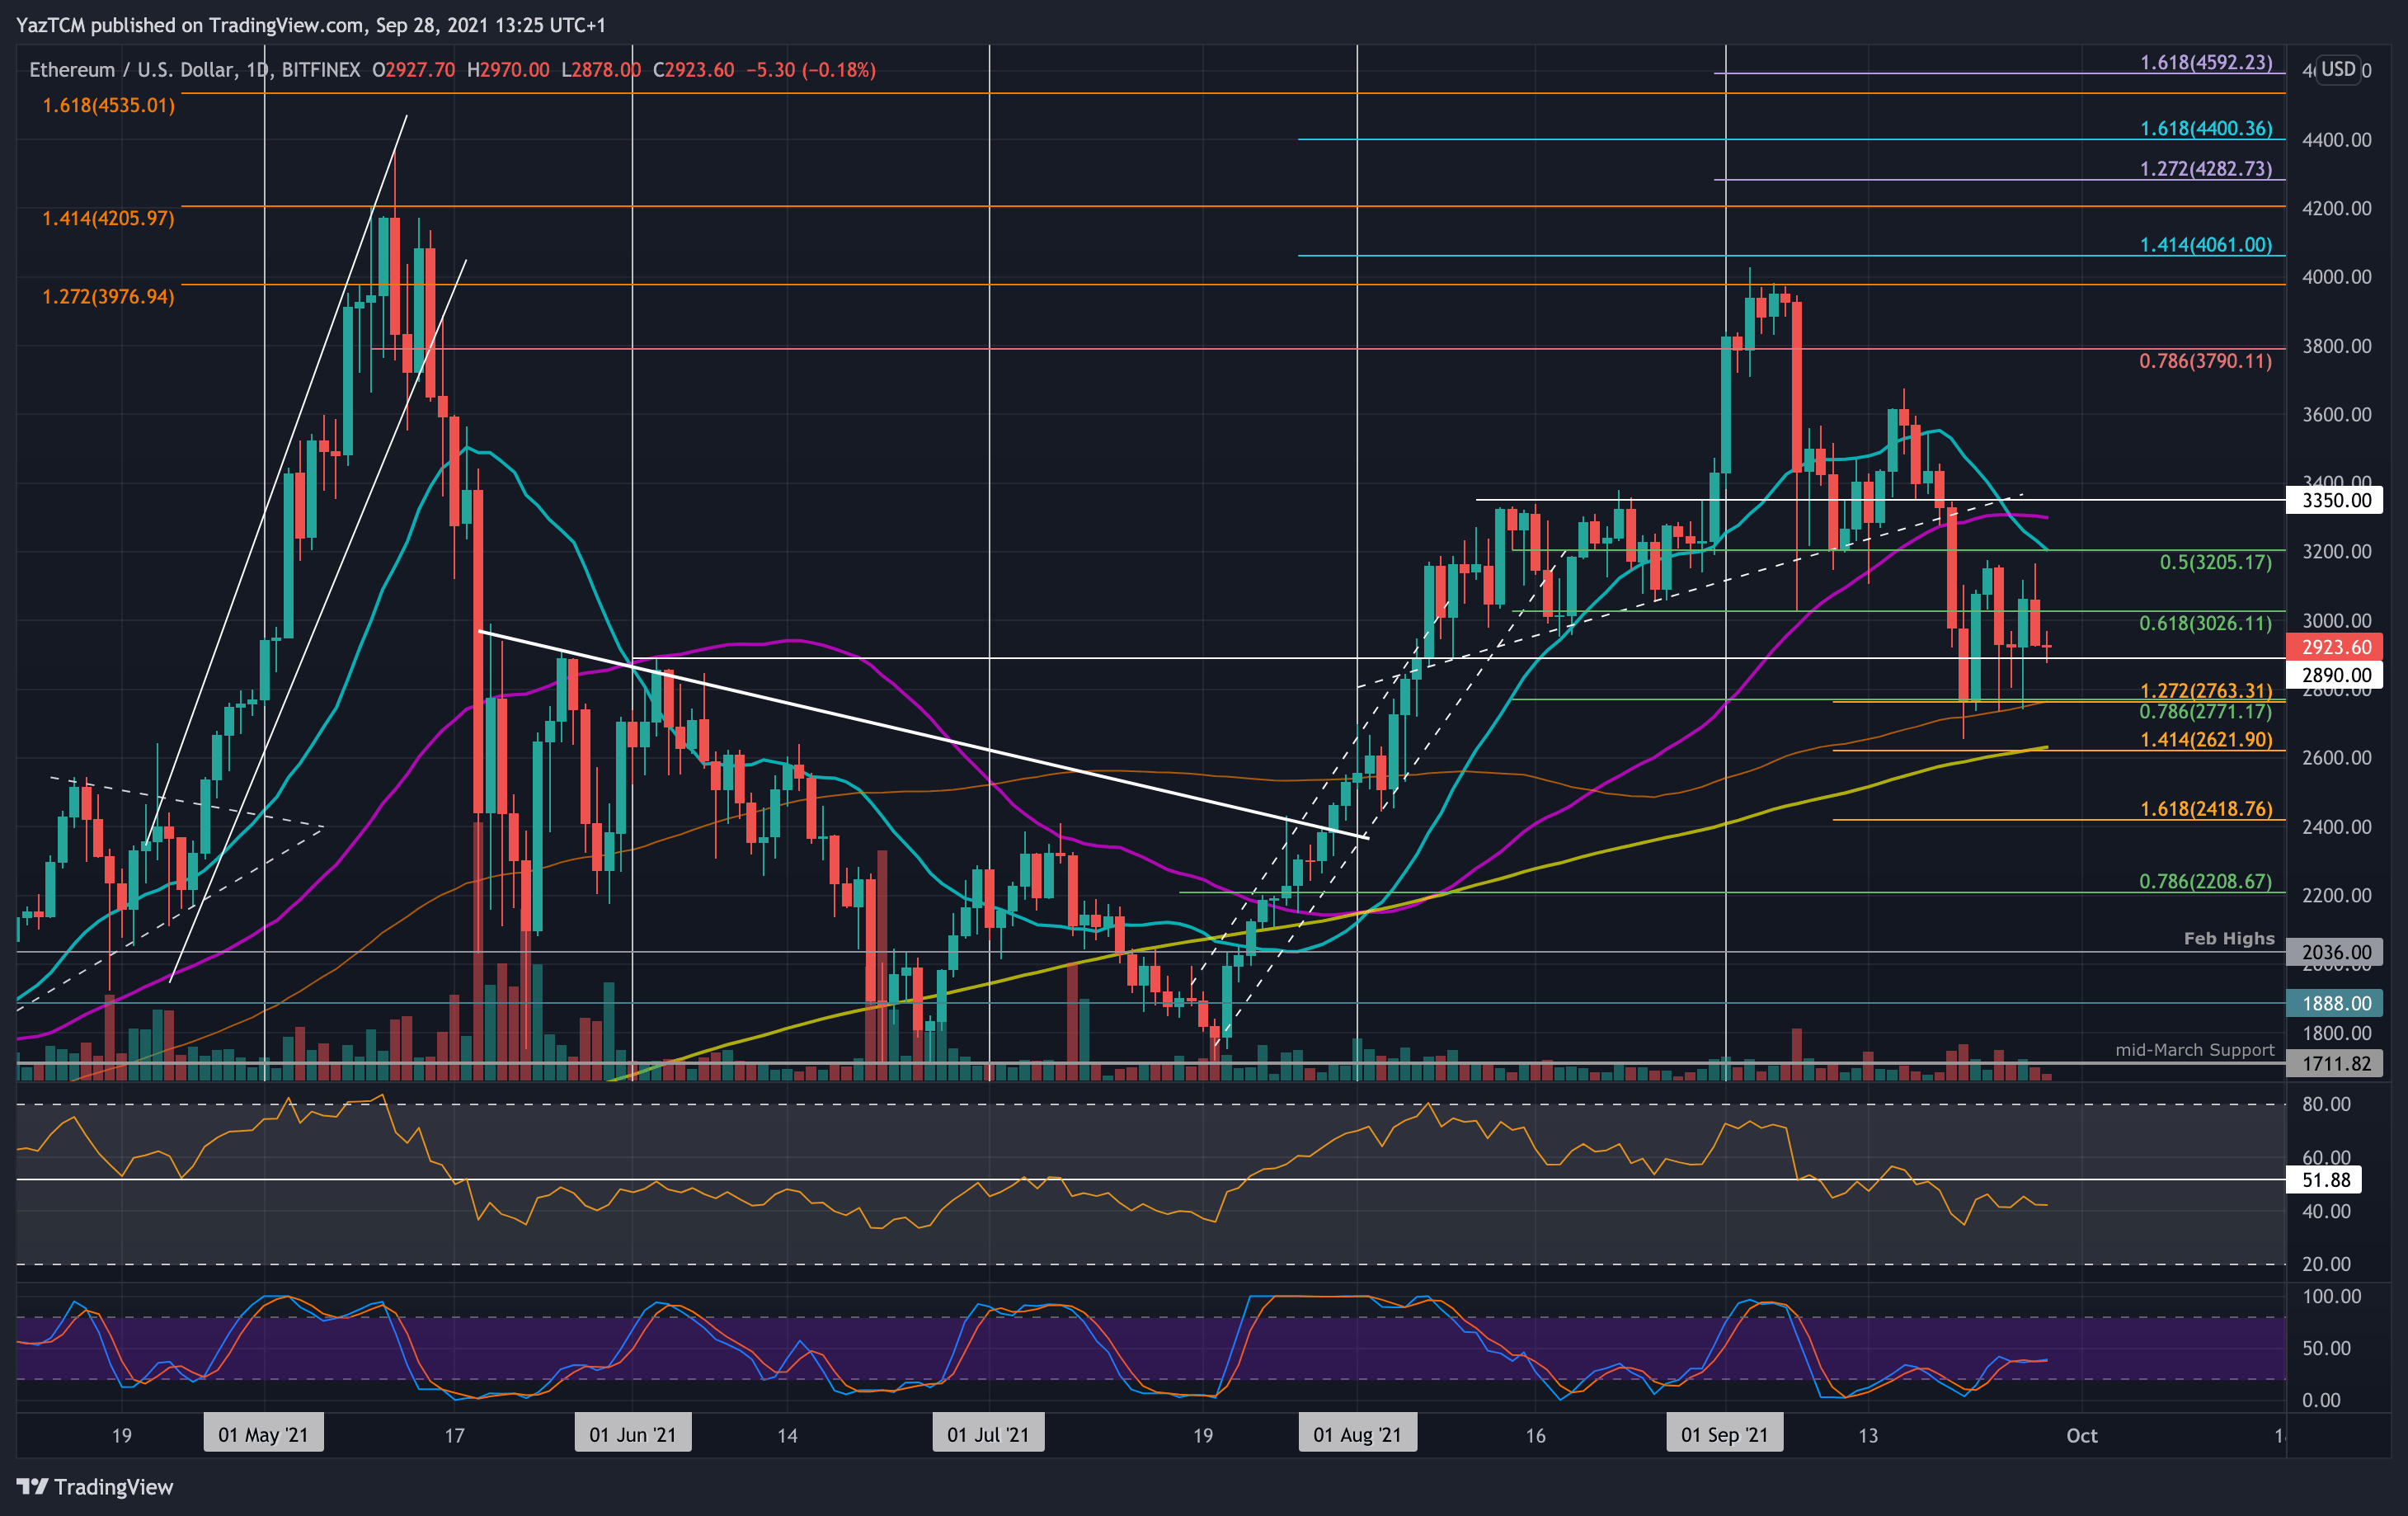
ETH-USD Short Term Price Prediction
Looking ahead, if the sellers push beneath $2890, the first support lies at $2770 (.786 Fib & 100-day MA). This is followed by $2600 (200-day MA) and $2500.
On the other side, the first resistance lies at $3000. This is followed by $3180 (upper boundary of the current range), $3200 (20-day MA), $3300 (50-day MA), $3350, and $3500.
The daily RSI continues to sit beneath the midline, indicating that the sellers control the market momentum.
ETH/BTC – ETH Holding Ascending Trend Line SUpport
Key Support Levels: 0.0691 BTC, 0.068 BTC, 0.0667 BTC.
Key Resistance Levels: 0.07 BTC, 0.0711 BTC, 0.072 BTC.
Against BTC, ETH is battling to hold the rising trend line that dates back to the end of July. The cryptocurrency has used this trend line as support over the past week and has struggled to break resistance at around 0.0711 BTC over the period.
On Sunday, ETH bounced higher from the ascending trend line to meet the resistance at 0.0711 BTC. Unfotutealy, the buyers were unable to break 0.0711 BTC and rolled over from there yesterday to meet the support at 0.0691 BTC today.
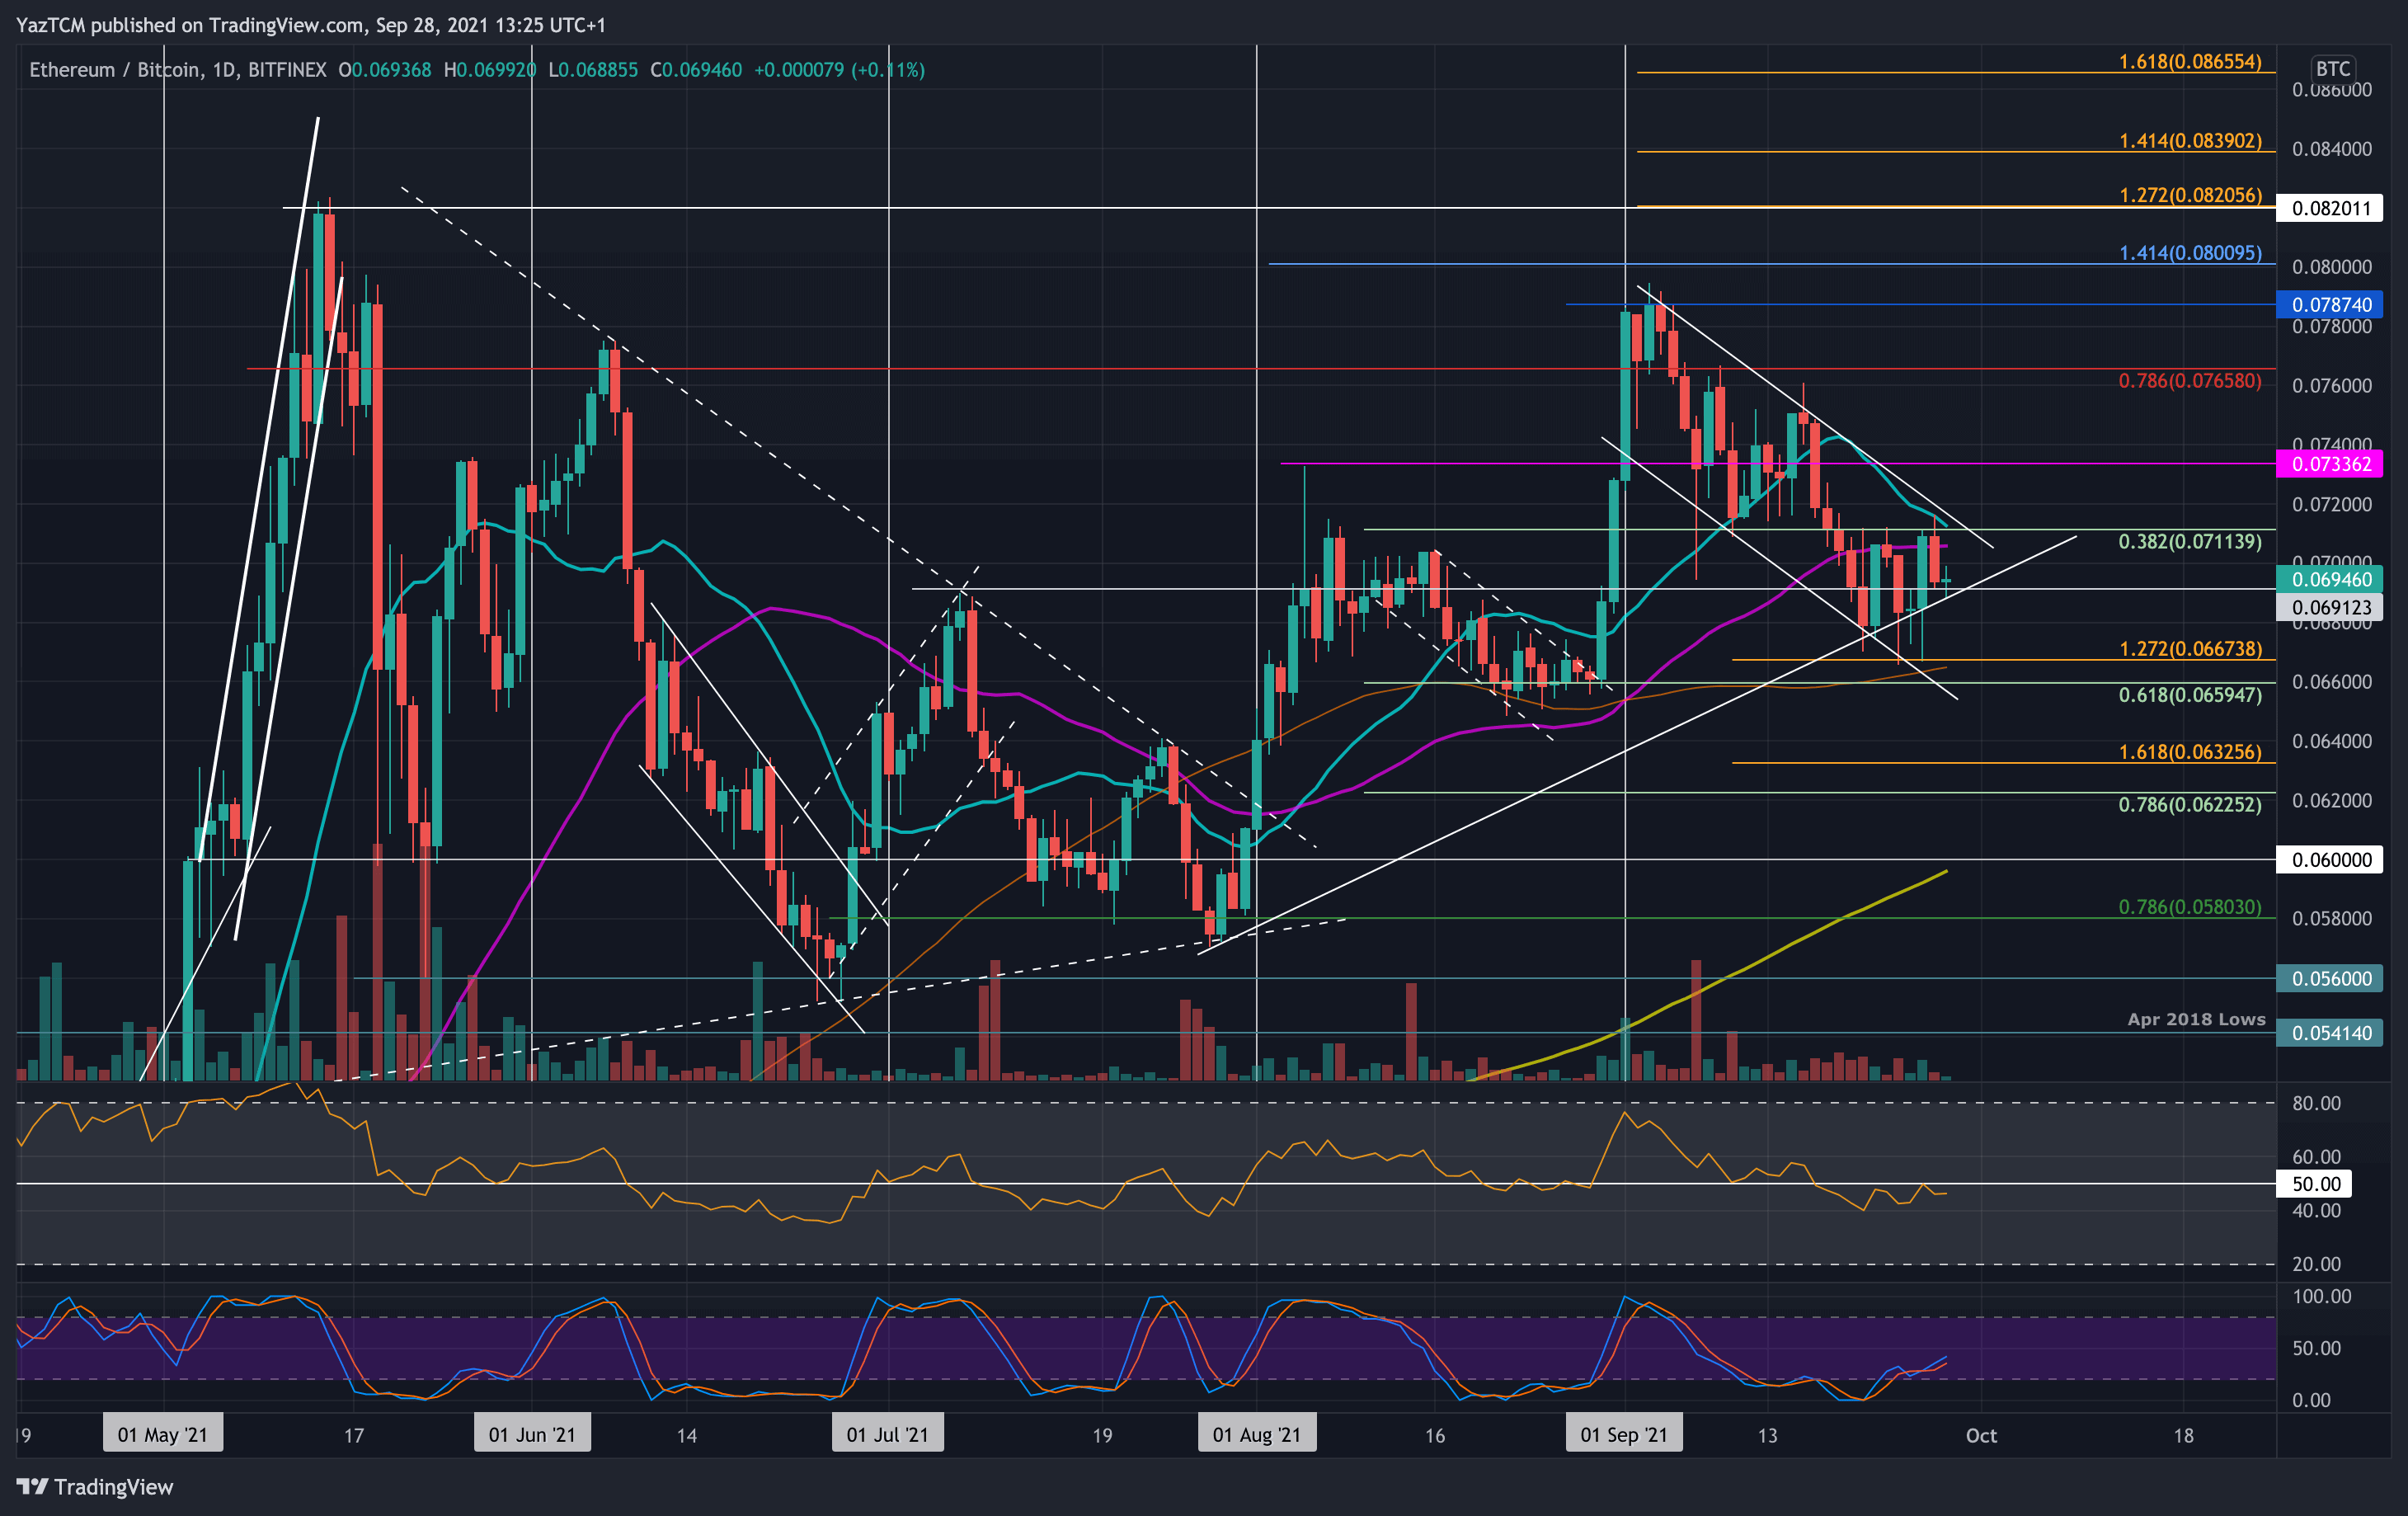
ETH-BTC Short Term Price Prediction
Moving forward, if the bears break beneath 0.0691 BTC, the first support lies at 0.068 BTC. This is followed by 0.0667 BTC (downside 1.272 Fib Extnesion & 100-day MA), 0.066 BTC (.618 Fib), and 0.065 BTC.
On the other side, the first resistance lies at 0.07 BTC. This is followed by 0.0711 BTC (20-day MA), 0.072 BTC, and 0.0733 BTC (August highs).
Again, the RSI is in bearish territory here as it sits beneath the midline.