ETH/USD – Ether Turns Parabolic Above Price Channel. Key Support Levels: 00, 90, 00.Key Resistance Levels: 50, 00, 50. Ethereum has been climbing aggressively ever since rebounding from the June support at 10 in the final half of July. Since then, ETH surged by a total of around 80% to reach the current 10 level. Throughout the majority of this surge, ETH was trading inside an ascending price channel. It broke toward the upside over the weekend as it hit 90 and climbed above 00 to reach 80. Today, ETH did spike beneath 00 earlier in the day but found solid support at 90 and rebounded higher to the current 10 level. ETH/USD Daily Chart. Source: TradingView.ETH-USD Short Term Price Prediction Looking ahead, the first resistance lies
Topics:
Yaz Sheikh considers the following as important: ETH Analysis, ETHBTC, Ethereum (ETH) Price, ethusd
This could be interesting, too:
Mandy Williams writes Ethereum Derivatives Metrics Signal Modest Downside Tail Risk Ahead: Nansen
Jordan Lyanchev writes Weekly Bitcoin, Ethereum ETF Recap: Light at the End of the Tunnel for BTC
CryptoVizArt writes Will Weak Momentum Drive ETH to .5K? (Ethereum Price Analysis)
Jordan Lyanchev writes Bybit Hack Fallout: Arthur Hayes, Samson Mow Push for Ethereum Rollback
ETH/USD – Ether Turns Parabolic Above Price Channel.
Key Support Levels: $3000, $2890, $2800.
Key Resistance Levels: $3150, $3200, $3350.
Ethereum has been climbing aggressively ever since rebounding from the June support at $1710 in the final half of July. Since then, ETH surged by a total of around 80% to reach the current $3110 level.
Throughout the majority of this surge, ETH was trading inside an ascending price channel. It broke toward the upside over the weekend as it hit $2890 and climbed above $3000 to reach $3180.
Today, ETH did spike beneath $3000 earlier in the day but found solid support at $2890 and rebounded higher to the current $3110 level.
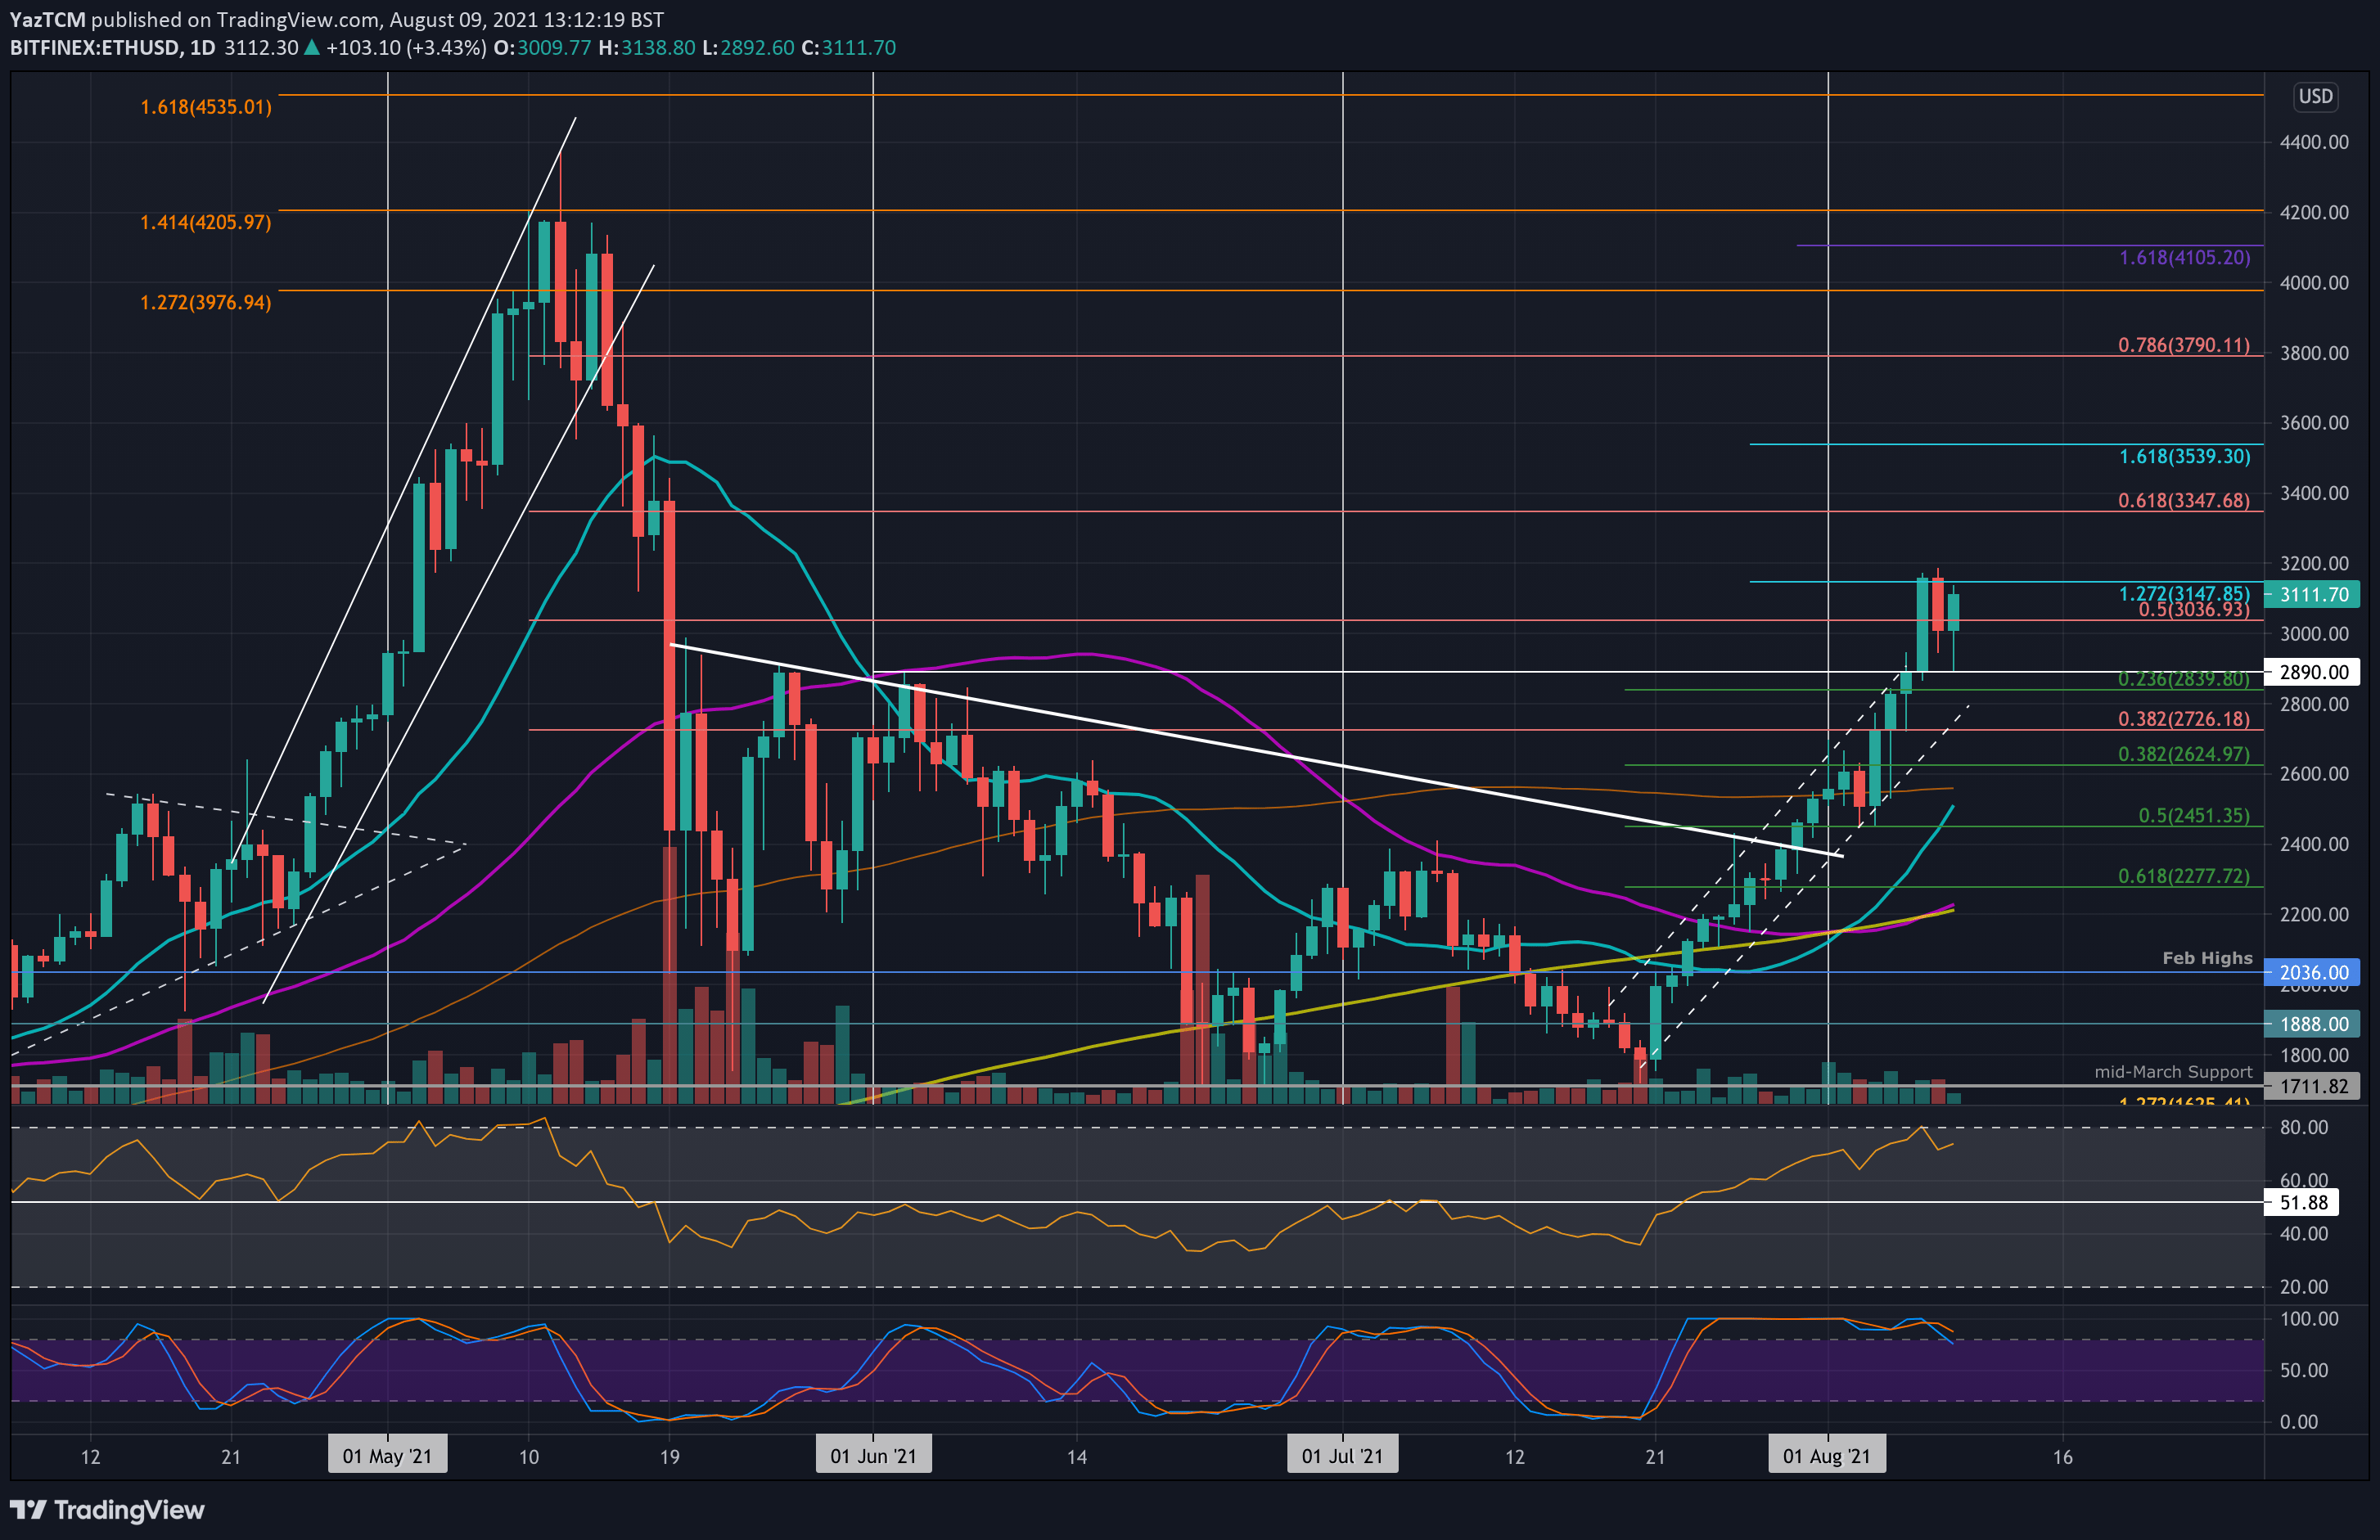
ETH-USD Short Term Price Prediction
Looking ahead, the first resistance lies at $3150 (1.272 Fib Extension). This is followed by $3200, $3350 (bearish .618 Fib), $3540 (1.618 Fib Extension), and $3790 (bearish .786 Fib).
On the other side, the first support lies at $3000. This is followed by $2890 (today’s support), $2800, $2625 (.382 Fib), and $2550 (200-day MA).
The RSI is well within the buyer’s favor and is still not yet overbought.
ETH/BTC – ETH Rolls Over From 0.07 BTC
Key Support Levels: 0.067 BTC, 0.0651 BTC, 0.0632 BTC.
Key Resistance Levels: 0.0691 BTC, 0.0715 BTC, 0.072 BTC.
Against bitcoin, ETH managed to break toward the upside of a symmetrical triangle pattern at the start of August. Since then, the cryptocurrency climbed higher as it broke the July resistance at 0.0691 BTC over the weekend to reach 0.0715 BTC on Saturday.
Yesterday, ETH rolled over from 0.07 BTC and started to head lower. It found support at 0.067 BTC (.382 Fib) today and is now trading at 0.068 BTC.
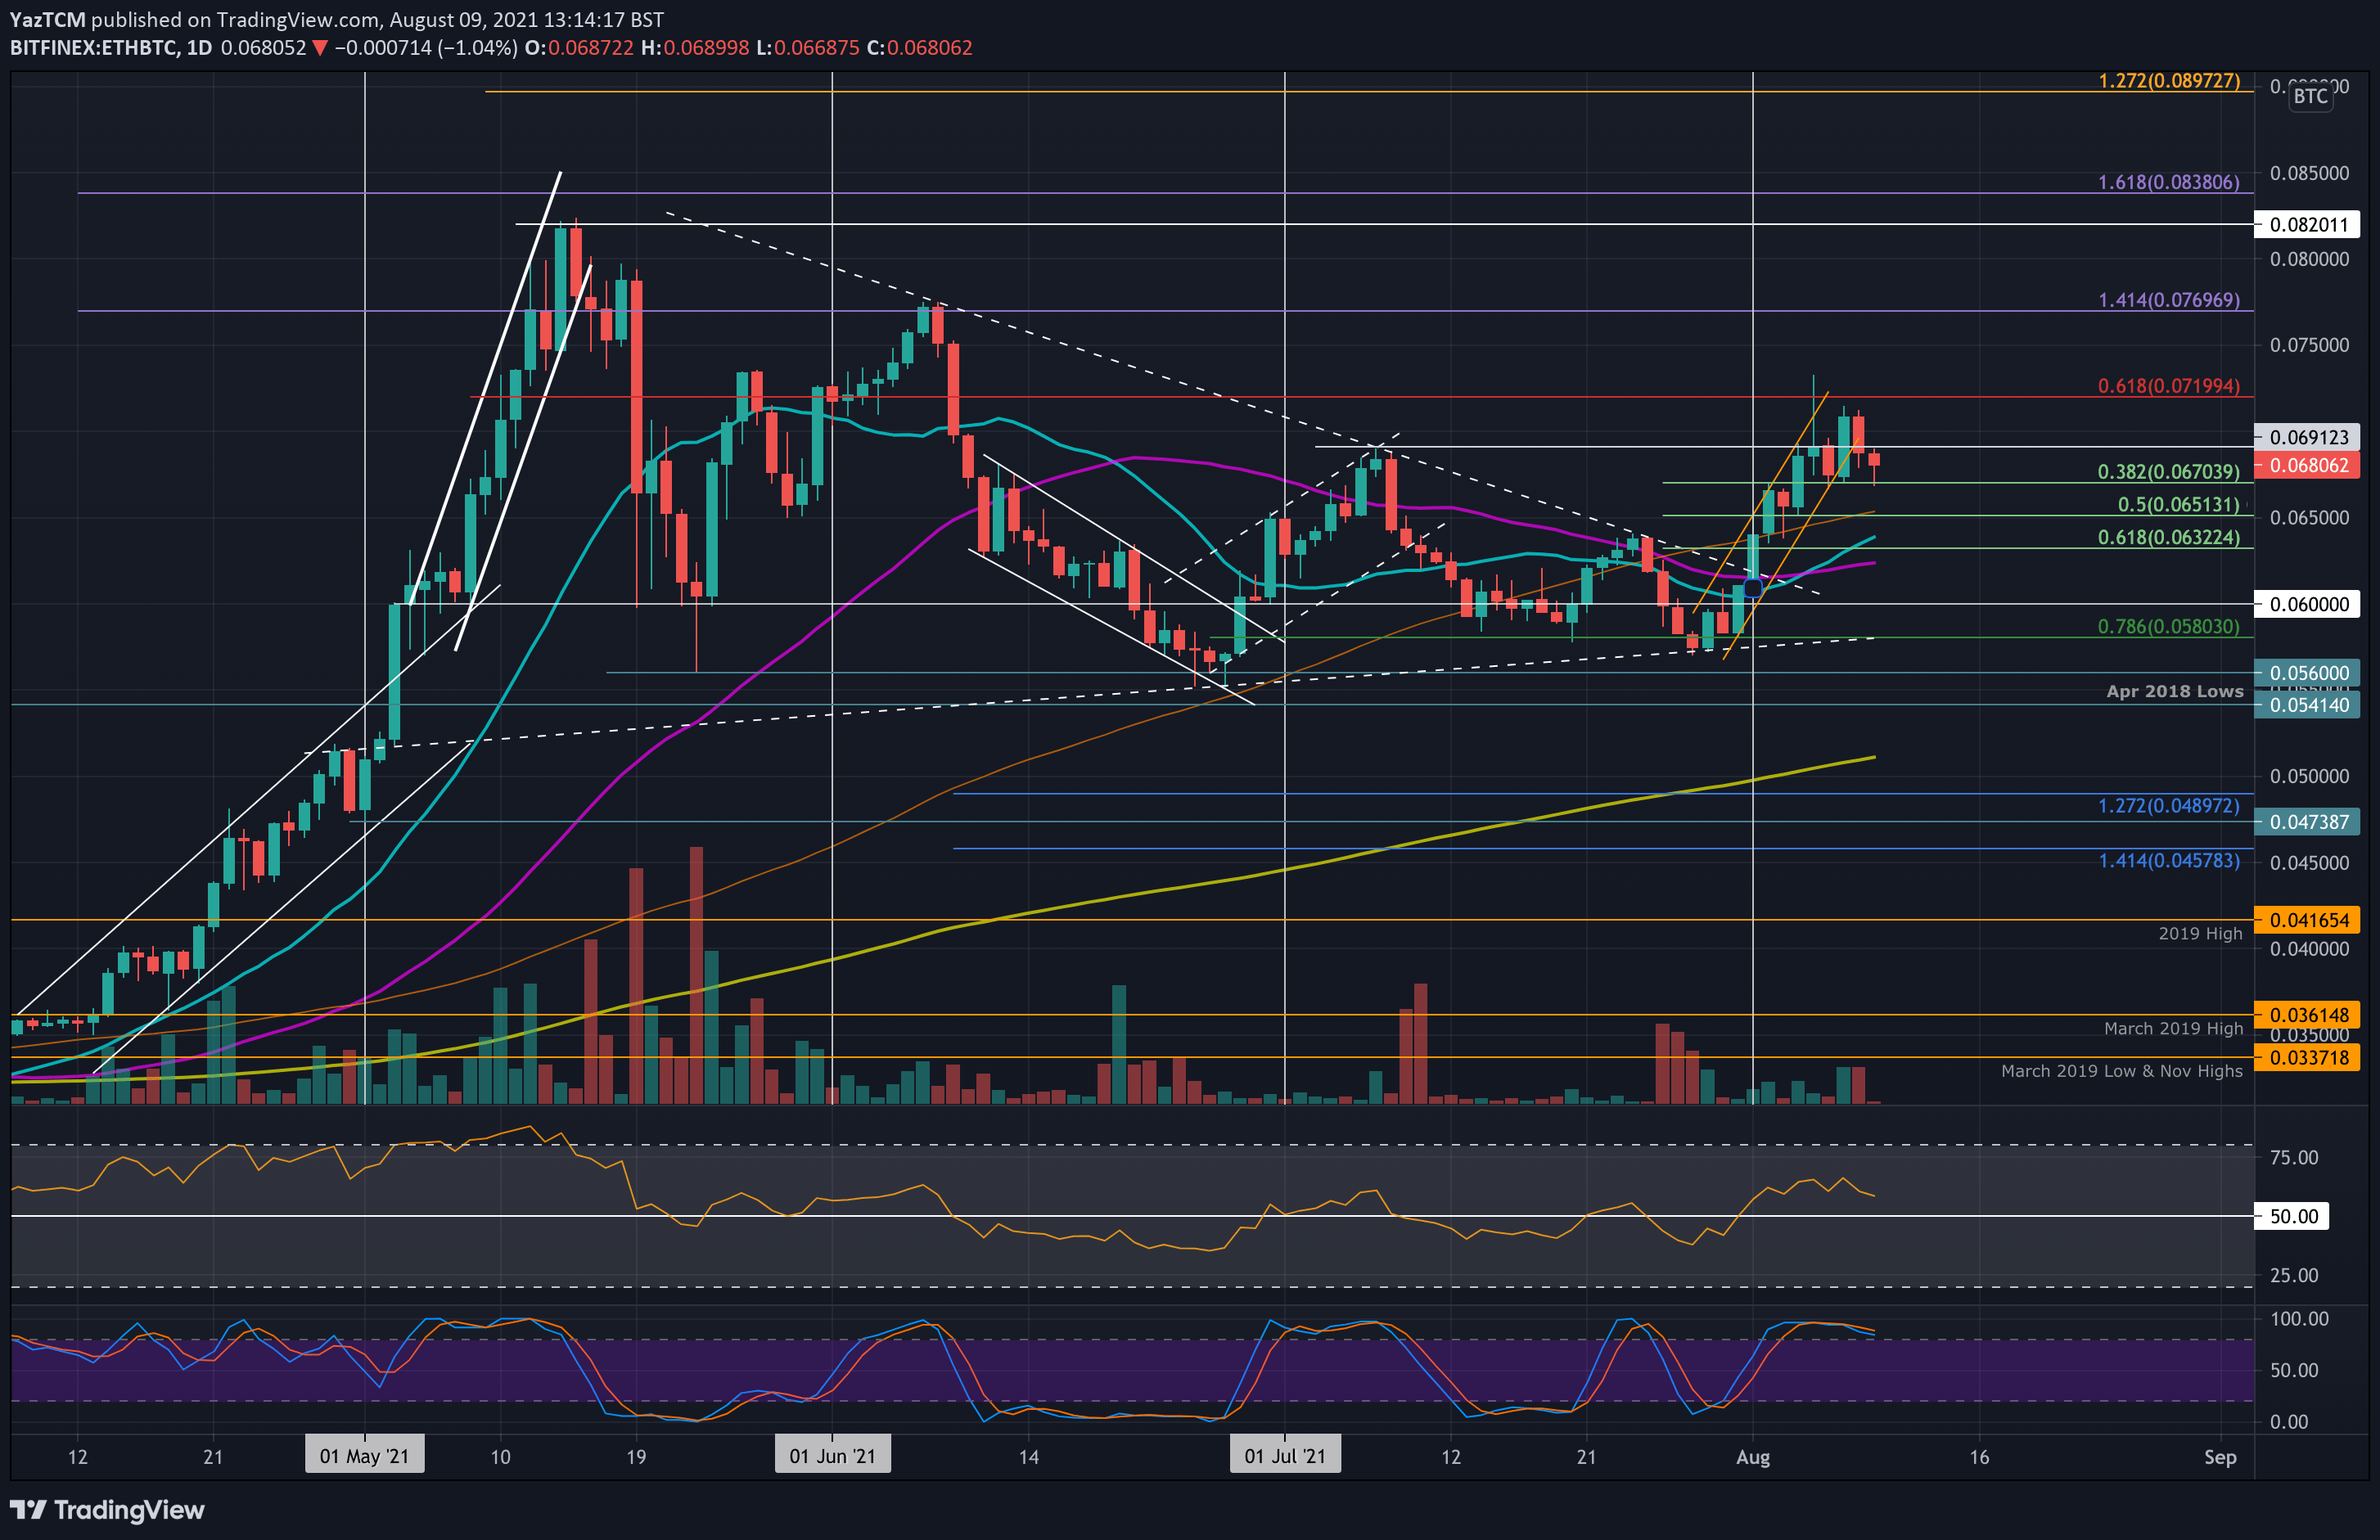
ETH-BTC Short Term Price Prediction
Moving forward, the first resistance lies at 0.0691 BTC. This is followed by 0.0715 BTC, 0.072 BTC (bearish .618 Fib), 0.075 BTC, and 0.0769 BTC (1.414 Fib extension).
On the other side, the first support lies at 0.067 BTC (.382 Fib). This is followed by 0.0651 BTC (200-day MA & .5 Fib), 0.0632 BTC (.618 Fib), and 0.0623 BTC (50-day MA).
The daily RSI is showing slight hints of bearish divergence which led to this weekend’s rollover.