ETH/USD – Ether Attempts To Hold 20-Day MA Key Support Levels: 30, 50, 40.Key Resistance Levels: 50, 00, 00. Etheruem fell beneath its rising price channel over the weekend as it rolled over from above 00 and dropped on Saturday. The cryptocurrency had been trading inside this channel since the end of April, which allowed it to go on a strong bull run over the past two weeks to set a new ATH at 73. Today, ETH continued to slide lower as it spiked down to 41, where it found support at a .5 Fib Retracement. It has since bounced higher to climb back above the 20-day MA level at around 80. ETH/USD Daily Chart. Source: TradingViewETH-USD Short Term Price Prediction Looking ahead, if the sellers break the 20-day MA, the first support lies at 30
Topics:
Yaz Sheikh considers the following as important: ETH Analysis, ETHBTC, Ethereum (ETH) Price, ethusd
This could be interesting, too:
Mandy Williams writes Ethereum Derivatives Metrics Signal Modest Downside Tail Risk Ahead: Nansen
Jordan Lyanchev writes Weekly Bitcoin, Ethereum ETF Recap: Light at the End of the Tunnel for BTC
CryptoVizArt writes Will Weak Momentum Drive ETH to .5K? (Ethereum Price Analysis)
Jordan Lyanchev writes Bybit Hack Fallout: Arthur Hayes, Samson Mow Push for Ethereum Rollback
ETH/USD – Ether Attempts To Hold 20-Day MA
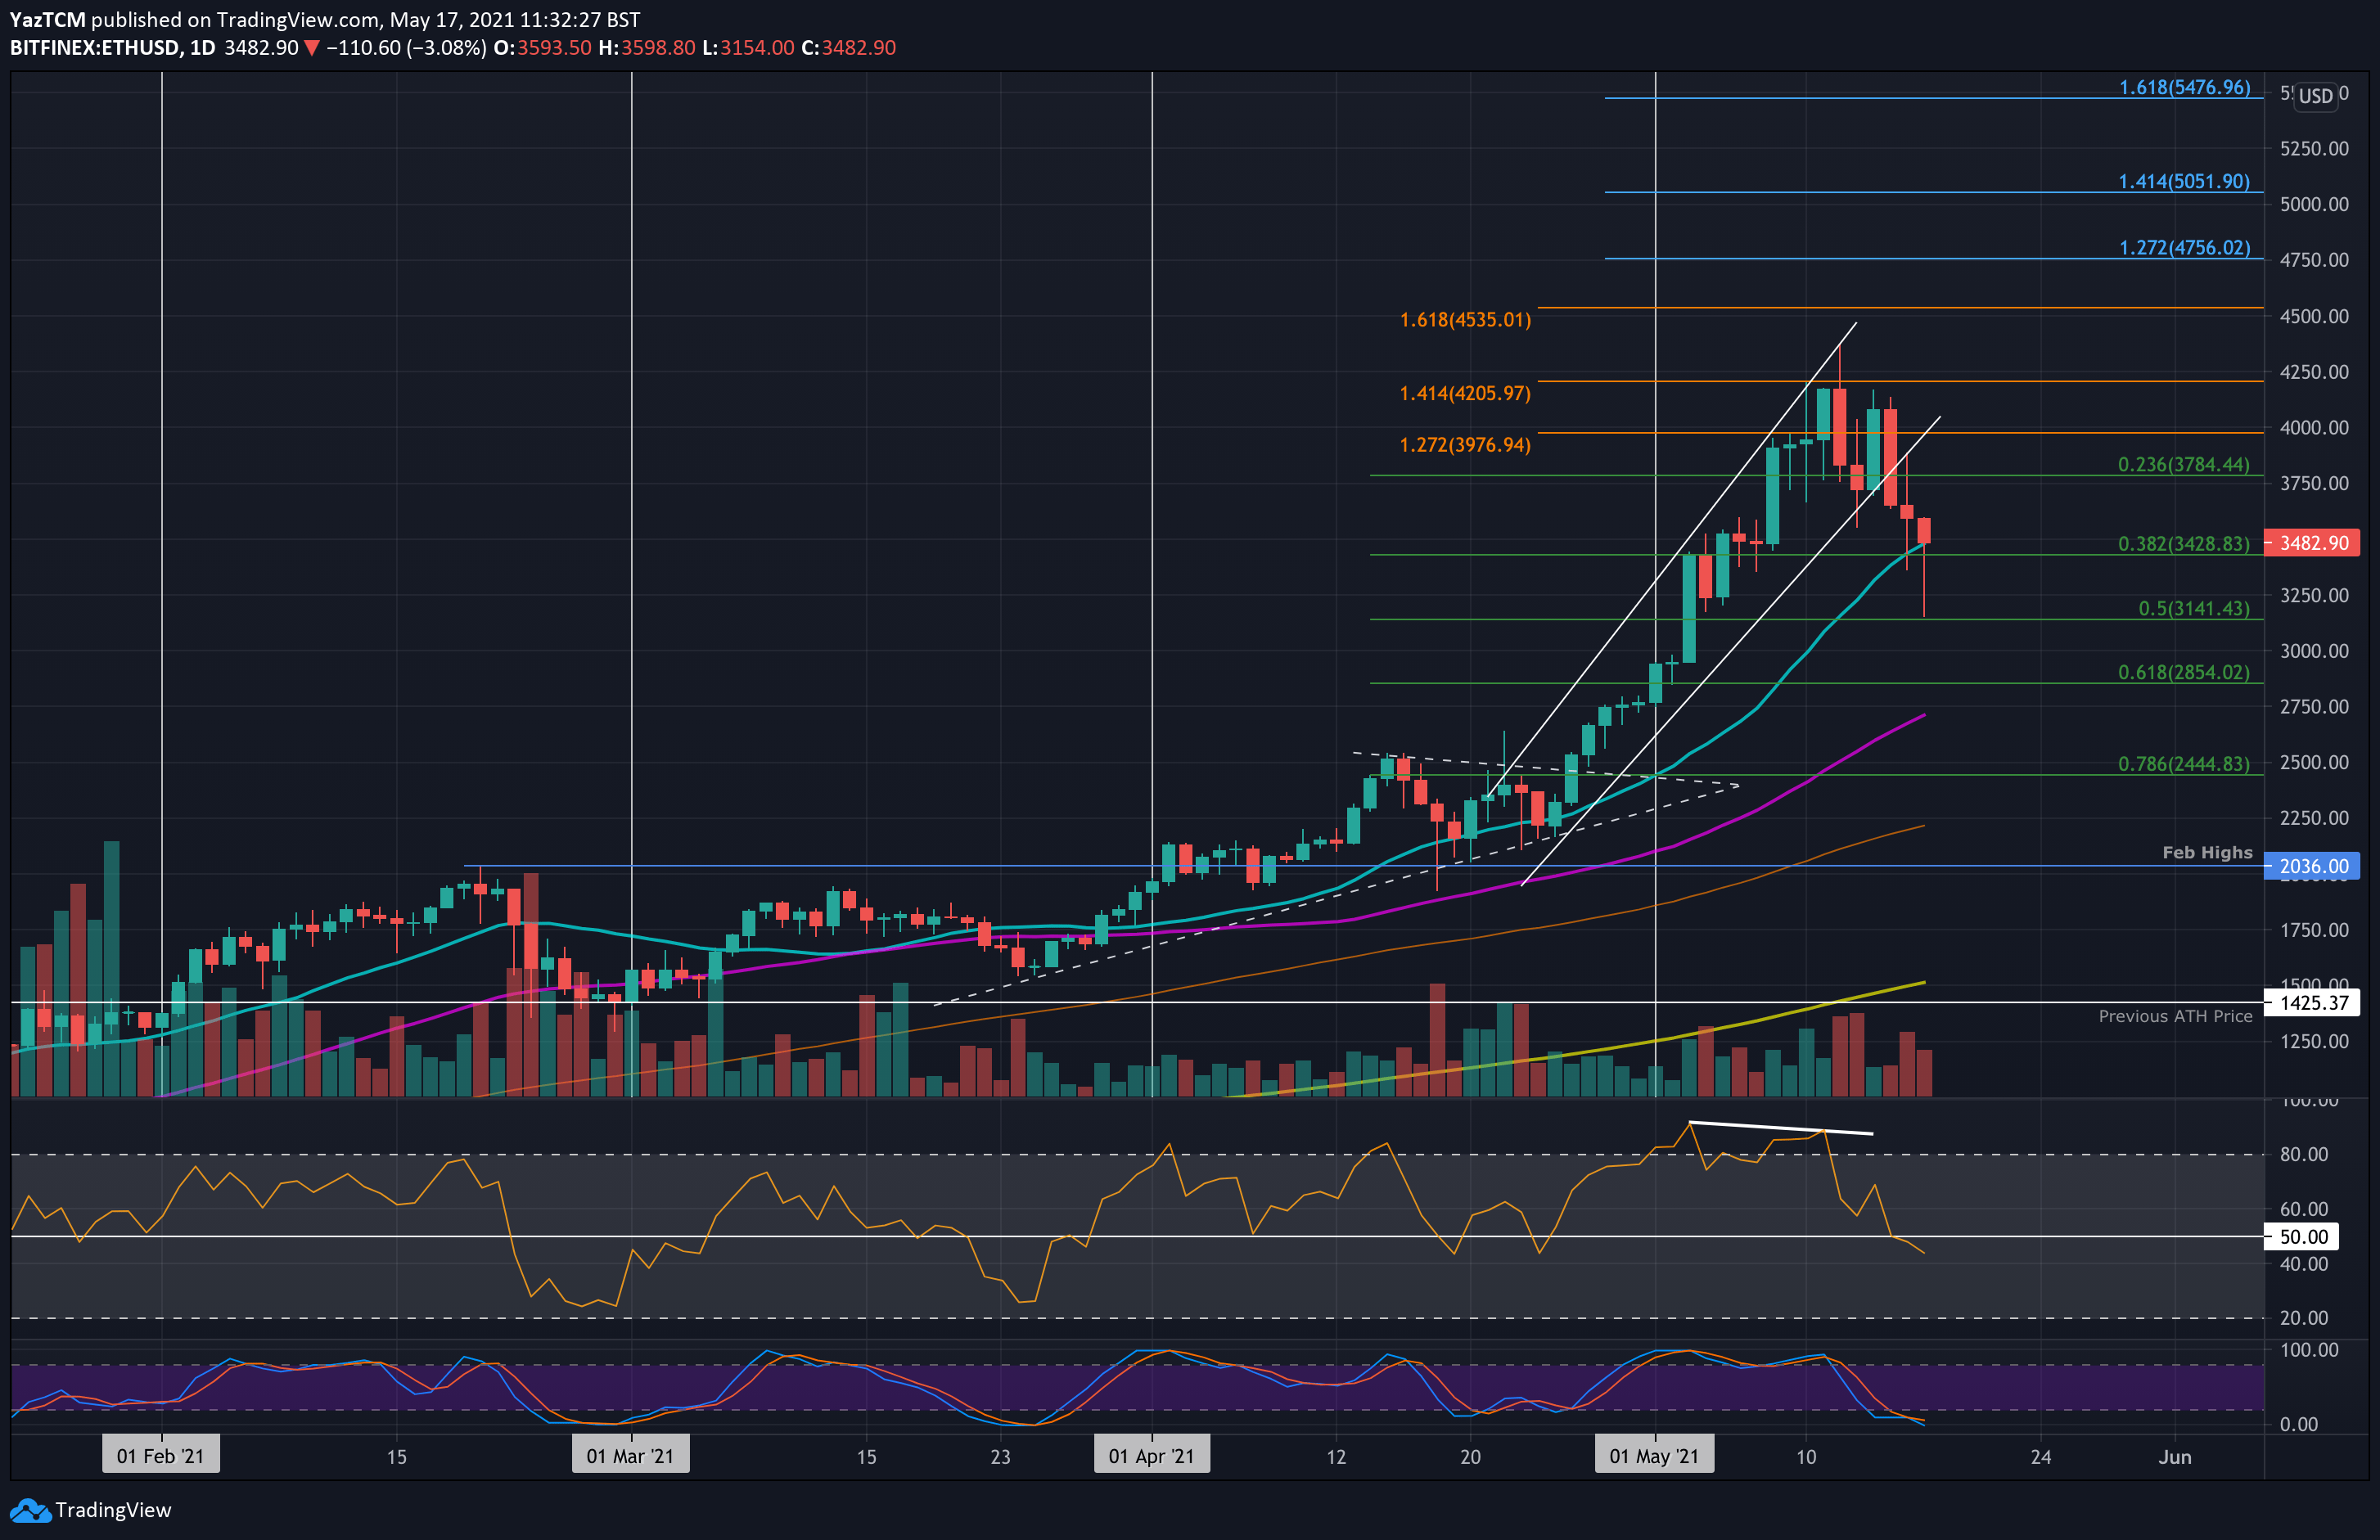
Key Support Levels: $3430, $3250, $3140.
Key Resistance Levels: $3750, $3800, $4000.
Etheruem fell beneath its rising price channel over the weekend as it rolled over from above $4000 and dropped on Saturday. The cryptocurrency had been trading inside this channel since the end of April, which allowed it to go on a strong bull run over the past two weeks to set a new ATH at $4373.
Today, ETH continued to slide lower as it spiked down to $3141, where it found support at a .5 Fib Retracement. It has since bounced higher to climb back above the 20-day MA level at around $3480.
ETH-USD Short Term Price Prediction
Looking ahead, if the sellers break the 20-day MA, the first support lies at $3430 (.382 Fib). This is followed by $3250, $3141 (.5 Fib), $3000, and $2855 (.618 Fib).
On the other side, the first strong resistance lies at $3750. This is followed by $3800, $4000, and $4200.
The RSI recently slipped beneath the midline, indicating that the bearish momentum is starting to increase. If it continues to dip, ETH can be expected to head back toward $3000.
ETH/BTC – Market Falls Beneath Price Channel
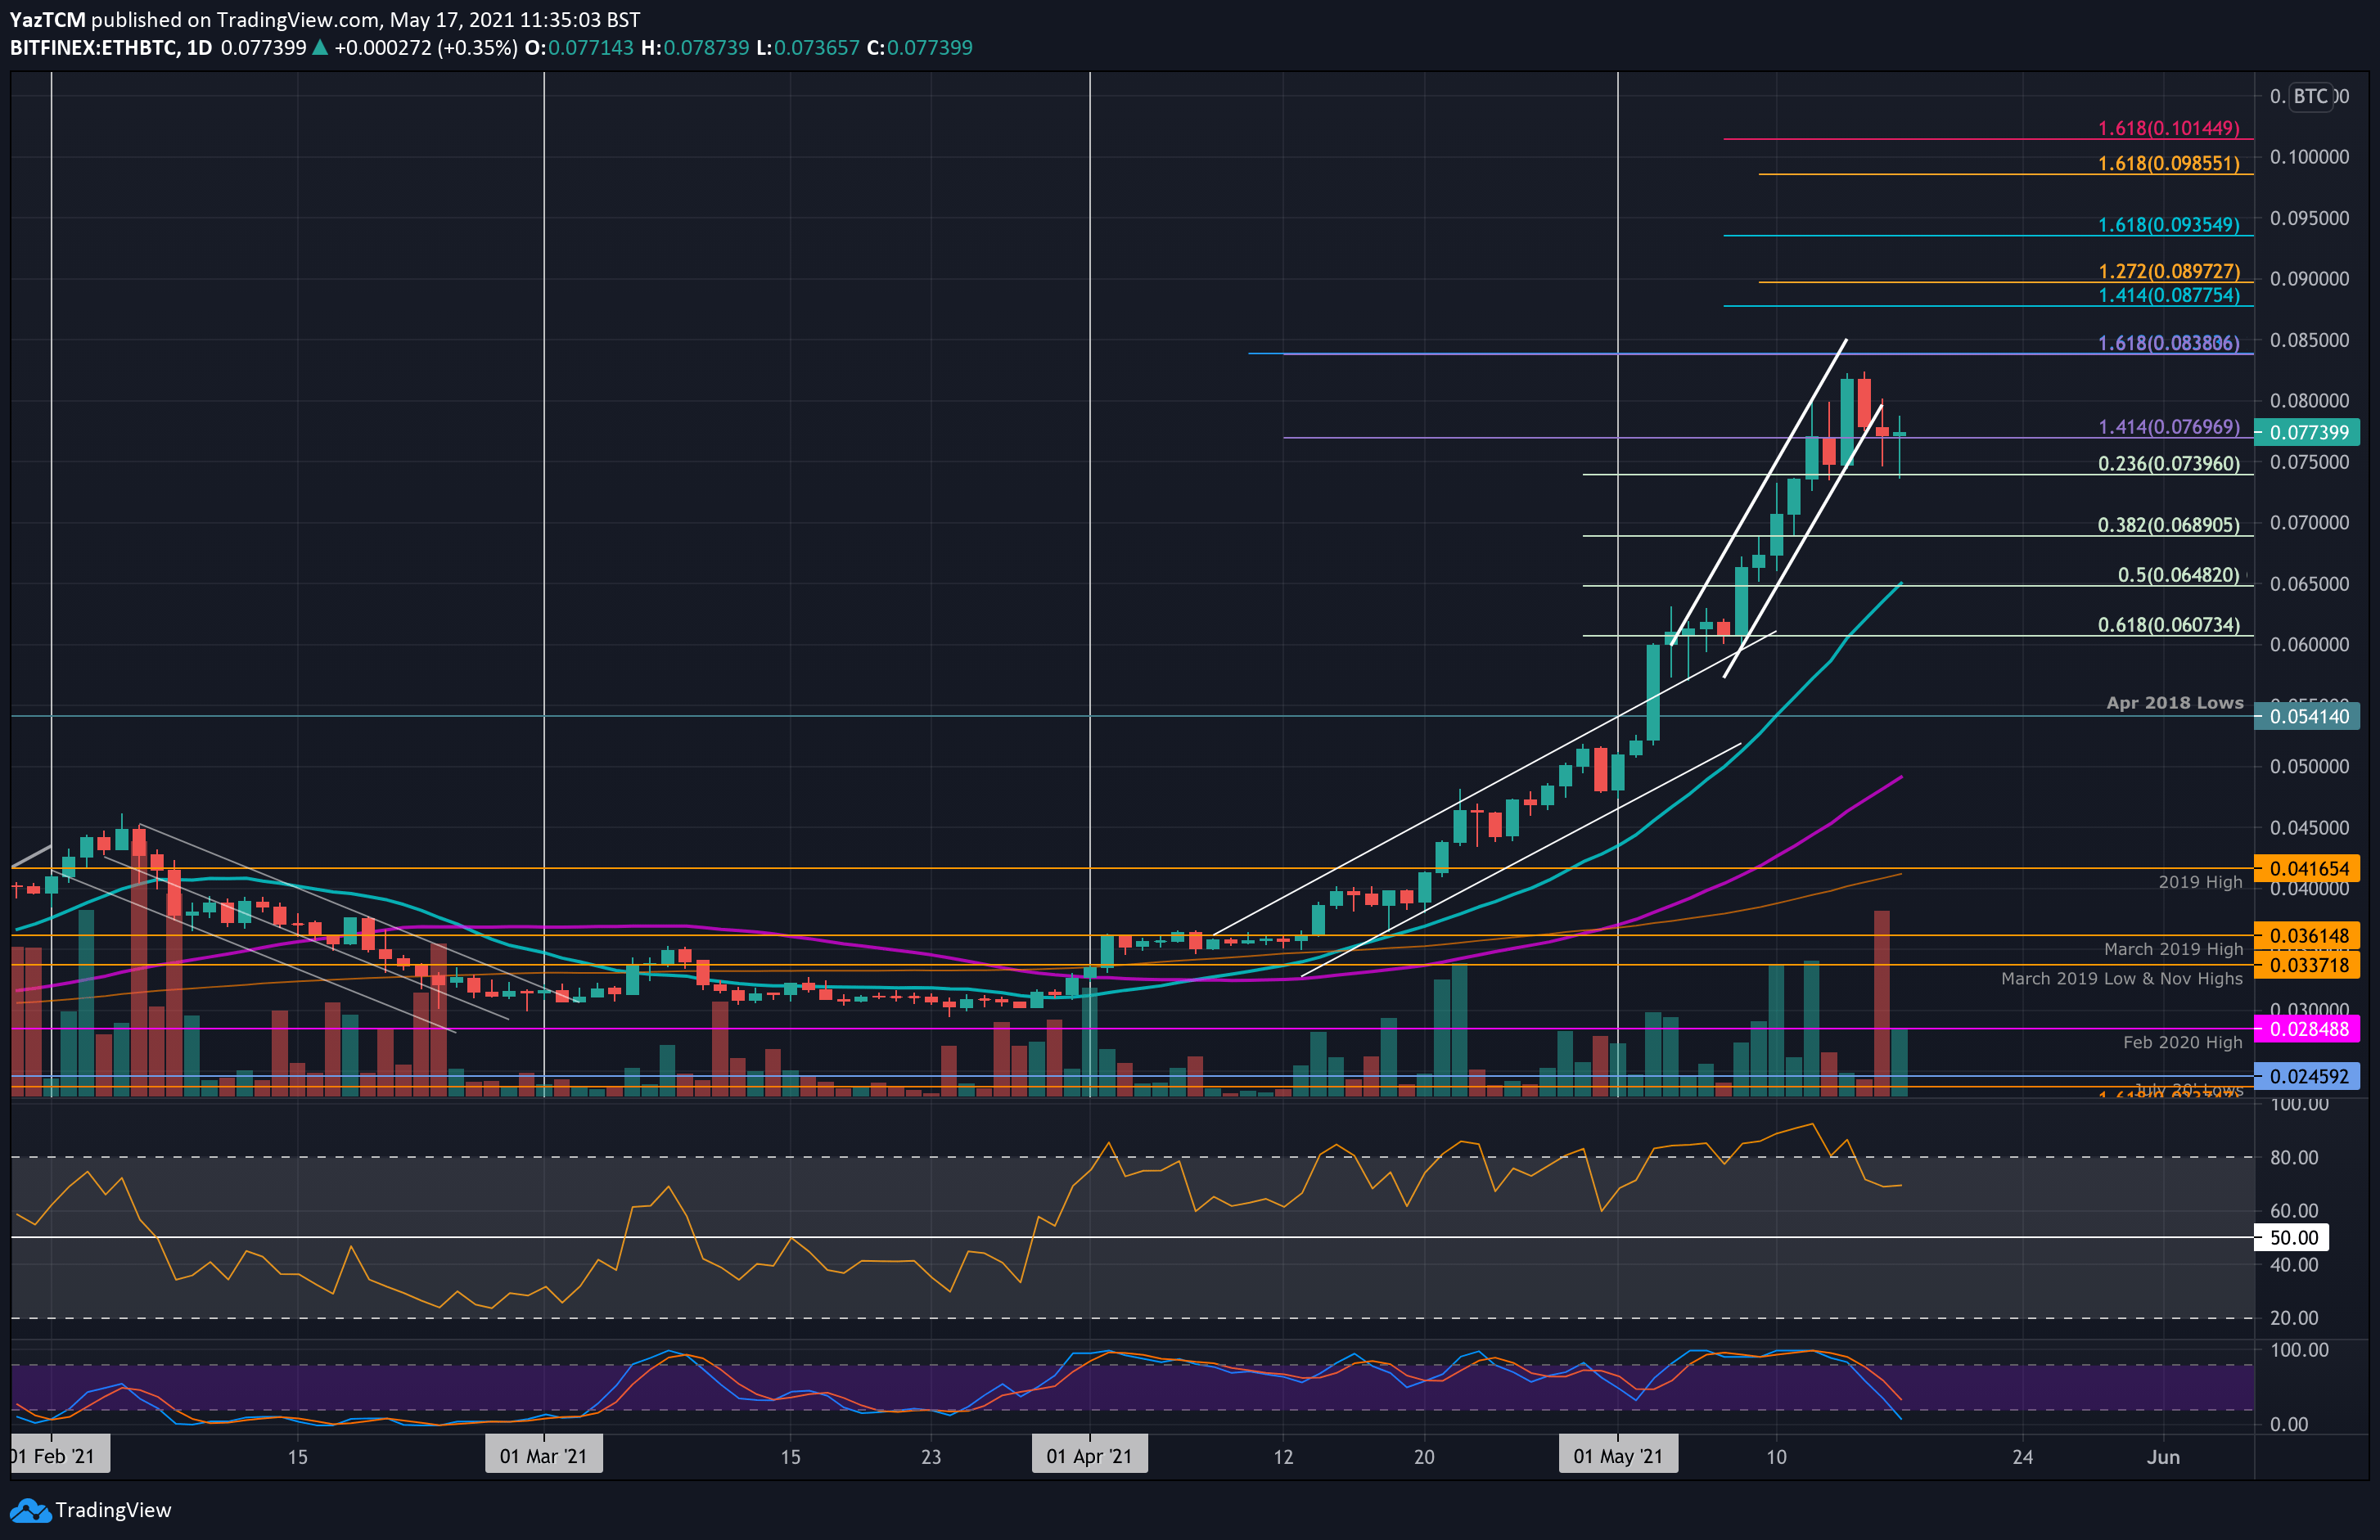
Key Support Levels: 0.0739 BTC, 0.0689 BTC, 0.065 BTC.
Key Resistance Levels: 0.08 BTC, 0.0822 BTC, 0.0838 BTC.
Against bitcoin, ETH managed to set a new ATH price on Friday as it hit 0.0822 BTC. However, from there, the momentum quickly stalled as it rolled over into the lower boundary of a rising price channel.
The market penetrated beneath this price channel yesterday but managed to close the daily candle above 0.077 BTC. Today, ETH dipped as low as 0.0739 BTC (.236 Fib) but has also rebounded back above 0.077 BTC as the bulls continue to attempt to defend the support.
ETH-BTC Short Term Price Prediction
Looking ahead, the first strong support lies at 0.0739 BTC (.236 Fib). This is followed by 0.0689 BTC (.382 Fib), 0.065 BTC (.5 Fib & 20-day MA), and 0.0607 BTC (.618 Fib).
On the other side, the first resistance lies at 0.08 BTC. This is followed by the ATH at 0.0822 BTC, 0.0838 BTC (1.618 Fib Extension – purple), 0.0877 BTC, and 0.09 BTC.
The RSI has also started to dip lower but is still above the midline as the buyers continue to control the market momentum.